Report on Cleveland (United States) — October 2013
Bulletin of the Global Volcanism Network, vol. 38, no. 10 (October 2013)
Managing Editor: Richard Wunderman.
Edited by Julie A. Herrick.
Cleveland (United States) Dome growth and destruction during 2012-2013
Please cite this report as:
Global Volcanism Program, 2013. Report on Cleveland (United States) (Herrick, J.A., and Wunderman, R., eds.). Bulletin of the Global Volcanism Network, 38:10. Smithsonian Institution. https://doi.org/10.5479/si.GVP.BGVN201310-311240
Cleveland
United States
52.825°N, 169.944°W; summit elev. 1730 m
All times are local (unless otherwise noted)
In the previous Bulletin report (BGVN 37:01) we discussed a cycle of lava-dome growth within the summit crater from late 2011 through early 2012. That cycle of extrusion and destruction of domes continued into 2013. The lava dome observed on 30 January 2013 persisted to the end of this reporting period, September 2013. The dynamic conditions at Cleveland caused the Alaska Volcano Observatory (AVO) to report numerous changes in the Aviation Color Code and Alert Level, fluctuating between Yellow/Advisory and Orange/Watch throughout this time period (table 5).
Table 5. During 2012-2013, AVO announced changes in the Aviation Color Code and Volcano Alert Level for Cleveland. AVO and other US Observatories use a combination color code and alert level system that addresses both airborne and ground-based hazards (Gardner and Guffanti, 2006); the lowest level in this 4-step system is Normal/Green and the highest is Warning/Red. Courtesy of USGS-AVO.
| Date of Change | Aviation Color Code/ Volcano Alert Level |
| 31 Jan 2012 | Orange/Watch |
| 23 Mar 2012 | Yellow/Advisory |
| 28 Mar 2012 | Orange/Watch |
| 30 May 2012 | Yellow/Advisory |
| 19 Jun 2012 | Orange/Watch |
| 05 Sep 2012 | Yellow/Advisory |
| 10 Nov 2012 | Orange/Watch |
| 21 Nov 2012 | Yellow/Advisory |
| 06 Feb 2013 | Orange/Watch |
| 08 Mar 2013 | Yellow/Advisory |
| 04 May 2013 | Orange/Watch |
| 04 Jun 2013 | Yellow/Advisory |
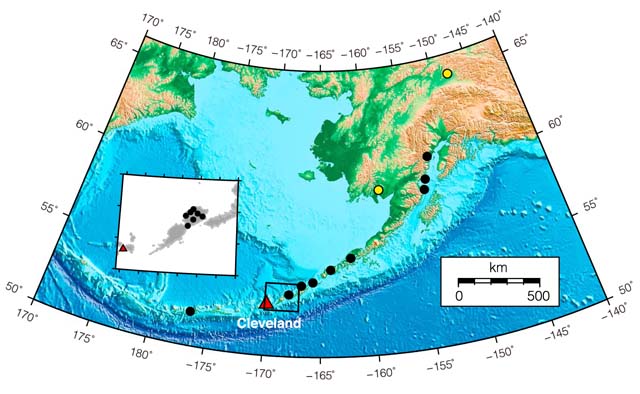
Continued explosions during 2012-2013. Cleveland has a history of frequent, minor ash emissions particularly during 2005-2009 (McGimsey and others, 2007; Neal and others, 2011) and with more frequency during 2011-2013 (Guffanti and Miller, 2013; De Angelis and others, 2012). During 2012-2013, Cleveland remained unmonitored by ground-based seismic instrumentation; volcanic unrest was primarily detected by the seismic network located on nearby Umnak Island (figure 12). Observations were also conducted with satellites that have capabilities of distinguishing ash from meteorological clouds during clear conditions: GOES (Geostationary Operational Environmental Satellite), POES (Polar Operational Environmental Satellite which carries the AVHRR scanner), and the Terra and Aqua satellites that carry MODIS sensors.
Additional assessments of explosive activity in this period were aided by (1) direct observations from mariners or pilots (PIREPS); (2) near real-time recordings of ground-coupled airwaves that characteristically arrive at seismic stations as extremely slow velocity signals, ~1 order of magnitude smaller than typical seismic velocity in the crust (De Angelis and others, 2012); (3) new infrasound detection capabilities recently expanded to include a station on Akutan (~500 km ENE of Cleveland).
De Angelis and others (2012) determined that 20 explosions were detected between December 2011 and August 2012, particularly by infrasound sensors as far away as 1,827 km from the active vent, as well as ground-coupled acoustic waves recorded at seismic stations across the Aleutian Arc. By retrospectively examining the record of airwaves from Cleveland, those authors determined that many explosions had gone unnoticed in satellite images, likely because of poor weather conditions that obscured the signal or because these explosions were brief, small, and lofted little ash.
Significant ash explosions in April-June 2012 and May 2013. During the 2012-2013reporting period, explosions from Cleveland's summit crater were most frequently detected during April and June 2012 (figure 13). Additional explosions were reported by AVO through July 2013. Relative quiescence (which included minor thermal anomalies visible in satellite images) followed and continued through September 2013.
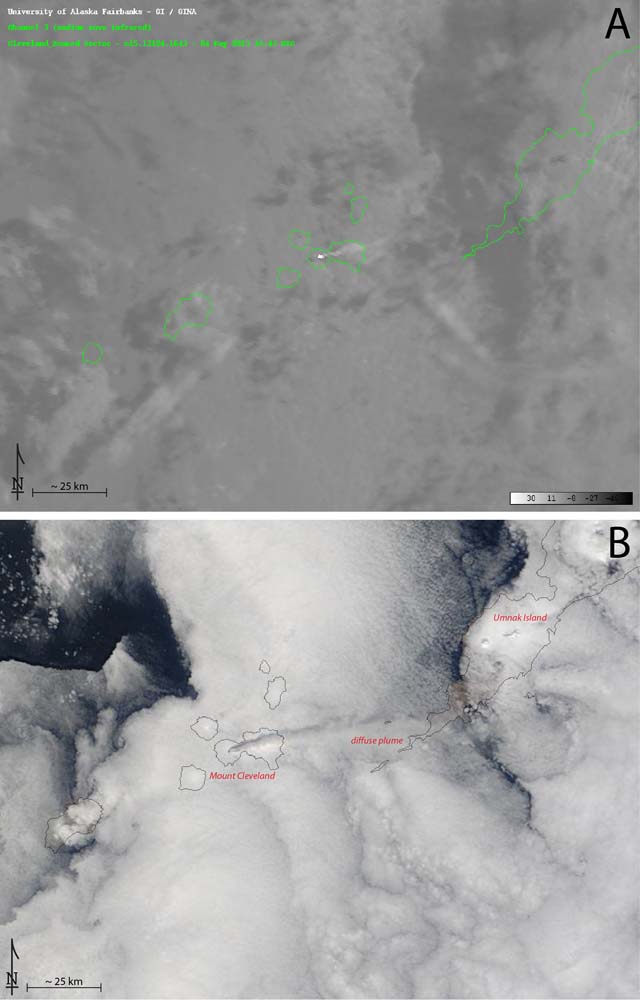
During 2012-2013, at least two explosions were large enough to generate ash plumes that reached >4 km above the summit crater. Both were reported by the Anchorage Volcanic Ash Advisory Center (VAAC) on 7 April 2012 and 4 May 2013. The April event produced a plume that rose ~6 km a.s.l.; AVO reported that ash drifted E at 18 m/s. The 4 May 2013 event (figure 14) generated an ash plume that rose ~4.6 km a.s.l. Based on POES data and AVO observations, the ash drifted SE at ~10 m/s and dissipated within 5 hours.
During 2012-2013, AVO reported that explosions were frequently attributed to dome destruction. Those events often completely removed the new lava domes from the crater (table 6).
Table 6. Cleveland's lava dome history during 2012-2013 based on a variety of observations of the Cleveland summit crater. Note that an earlier dome was destroyed during 25-29 December 2011 and was confirmed absent by 24 January 2012. Courtesy of USGS-AVO.
| New Dome Date | Observations |
| 30 Jan 2012 | 40 m across. Dome was gone by 11 March 2012. |
| 26 Mar 2012 | 70 m across. Dome was gone by 4 April 2012. |
| 25 Apr 2012 | 25 m across. Dome was gone some time before 29 April 2012. |
| 03 May 2012 | 25 m wide. Dome was gone by 6 May 2012. |
| 30 Jan 2013 | 100 m wide. Dome persisted through September 2013. |
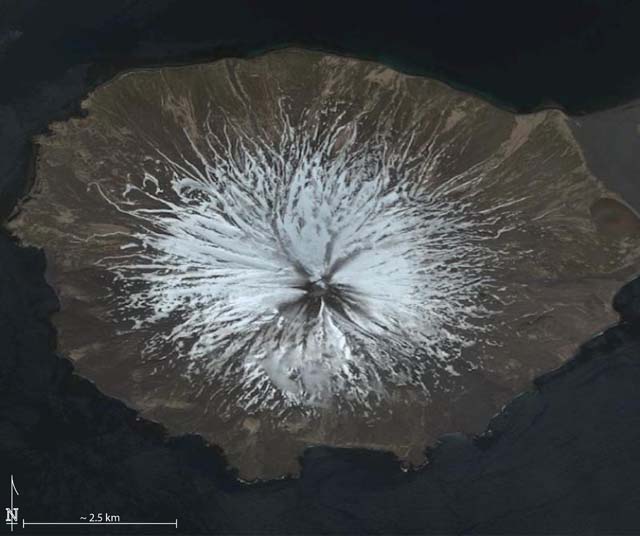
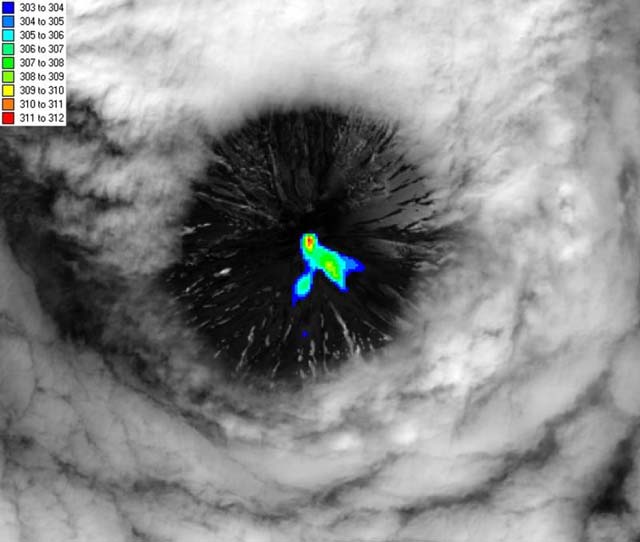
More on elevated surface temperatures during 2012-2013. In addition to the case shown in figure 14A, thermal anomalies in the vicinity of Cleveland's summit crater were frequently detected during this reporting period. AVO inferred that these observations reflected a variety of volcanic activity such as fresh, hot tephra from recent explosions, the hot open conduit at the bottom of the summit crater, incandescent rock such as the above mentioned domes (table 6) at the surface, or hot volcaniclastic flow deposits on the flanks (figure 15).
AVO reported that a satellite-based thermal alarm was triggered on 12 June 2012, attributed to the formation of hot lahars or rubble flows on Cleveland's flanks. While no lava dome was present at that time (see table 6), this was a significant event that transported debris to 700 m elevation on the NW flank (note that Cleveland has a summit elevation of 1,730 m). Other deposits, likely from other lahars, were mobilized on the NNW and NNE flanks. The deposits were mainly confined to drainages; deposits extended >1.5 km in length. Flowage features on the SE and SW flanks reached >1 km in length. AVO scientists also noted that all flanks had shown signs of melted snow but cautioned that the visual effect could also be attributed to non-eruptive remobilization of existing fragmental material on the steep flanks.
Volcaniclastic deposits were also noted based in satellite images on 10 November 2012. These features were located on the E flank and extended ~1 km down the slope.
References: De Angelis, S., Fee, D., Haney, M., and Schneider, D., 2012. Detecting hidden volcanic explosions from Mt. Cleveland Volcano, Alaska with infrasound and ground-coupled airwaves, Geophysical Research Letters, 39, L21312, doi:10.1029/2012GL053635.
Gardner, C.A. and Guffanti, M.C., 2006. U.S. Geological Survey's Alert Notification System for Volcanic Activity, USGS Fact Sheet 2006-3139.
Guffanti, M., and Miller, T., 2013. A volcanic activity alert-level system for aviation: review of its development and application in Alaska: Natural Hazards, 15 p., doi:0.1007/s11069-013-0761-4.
McGimsey, R.G., Neal, C.A., Dixon, J.P., and Ushakov, Sergey, 2007. 2005 Volcanic activity in Alaska, Kamchatka, and the Kurile Islands: Summary of events and response of the Alaska Volcano Observatory: U.S. Geological Survey Scientific Investigations Report 2007-5269, 94 p., available at http://pubs.usgs.gov/sir/2007/5269/.
Neal, C.A., McGimsey, R.G., Dixon, J.P., Cameron, C.E., Nuzhaev, A.A., and Chibisova, Marina, 2011. 2008 Volcanic activity in Alaska, Kamchatka, and the Kurile Islands: Summary of events and response of the Alaska Volcano Observatory: U.S. Geological Survey Scientific Investigations Report 2010-5243, 94 p., available at http://pubs.usgs.gov/sir/2010/5243.
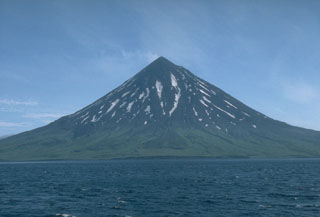
Geological Summary. The beautifully symmetrical Mount Cleveland stratovolcano is situated at the western end of the uninhabited Chuginadak Island. It lies SE across Carlisle Pass strait from Carlisle volcano and NE across Chuginadak Pass strait from Herbert volcano. Joined to the rest of Chuginadak Island by a low isthmus, Cleveland is the highest of the Islands of the Four Mountains group and is one of the most active of the Aleutian Islands. The native name, Chuginadak, refers to the Aleut goddess of fire, who was thought to reside on the volcano. Numerous large lava flows descend the steep-sided flanks. It is possible that some 18th-to-19th century eruptions attributed to Carlisle should be ascribed to Cleveland (Miller et al., 1998). In 1944 it produced the only known fatality from an Aleutian eruption. Recent eruptions have been characterized by short-lived explosive ash emissions, at times accompanied by lava fountaining and lava flows down the flanks.
Information Contacts: Alaska Volcano Observatory (AVO), a cooperative program of a)U.S. Geological Survey, 4200 University Drive, Anchorage, AK 99508-4667, USA (URL: http://www.avo.alaska.edu/), b)Geophysical Institute, University of Alaska, PO Box 757320, Fairbanks, AK 99775-7320, USA (URL: http://www.gi.alaska.edu/), and c)Alaska Division of Geological & Geophysical Surveys, 794 University Ave., Suite 200, Fairbanks, AK 99709, USA (URL: http://www.dggs.alaska.gov/); and Anchorage Volcanic Ash Advisory Center (VAAC), 6930 Sand Lake Road, Anchorage, AK 99502, USA (URL: http://vaac.arh.noaa.gov/list_vaas.php).

