Report on Galeras (Colombia) — January 2018
Bulletin of the Global Volcanism Network, vol. 43, no. 1 (January 2018)
Managing Editor: Edward Venzke.
Edited by A. Elizabeth Crafford.
Galeras (Colombia) Eruption with ash plumes May 2012-January 2014; steam emissions through 2017
Please cite this report as:
Global Volcanism Program, 2018. Report on Galeras (Colombia) (Crafford, A.E., and Venzke, E., eds.). Bulletin of the Global Volcanism Network, 43:1. Smithsonian Institution. https://doi.org/10.5479/si.GVP.BGVN201801-351080
Galeras
Colombia
1.22°N, 77.37°W; summit elev. 4276 m
All times are local (unless otherwise noted)
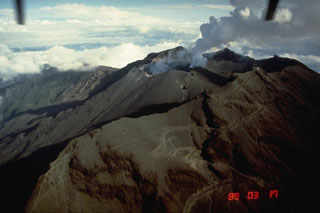
A central cone slightly lower than the summit caldera rim has been the site of numerous small-to-moderate historical eruptions recorded since the time of the Spanish conquistadors at Colombia's Galeras volcano. Persistent steam and gas, and occasional ash emissions from multiple vents around the summit have characterized activity for many years. Steam plumes are generally visible from two sites at the summit of the pyroclastic cone. Two small craters, known as Chavas and El Paisita, are located on the N and W rim of the larger central summit crater. Information for this report was gathered primarily from monthly technical reports provided by the Observatorio Vulcanológico y Sismológico de Pasto (OVSP) of the Sevicio Geologico Colombiano (SGC). Four webcams document the activity from the Observatorio Vulcanológico y Sismológico de Pasto (OVSP) located in Pasto (8 km ESE), from Consacá (11 km W), from the top of Galeras in the area called Barranco Alto (2.6 km NW), and from the SW flank at an area called Bruma.
The last time an Alert Level 1 (Red: imminent eruption or in progress) was issued was on 25 August 2010 when a plume of gas and ash rose 300 m above the summit and dispersed ash over numerous communities up to 30 km away. Seismicity decreased the following day, and steam and gas-only emissions returned. Fumarolic activity persisted throughout 2011, with only a single mention of possible low ash content in the plumes observed on 31 March and 1 April. Steam plumes rose a few hundred meters from the summit crater during January-May 2012. Seismic swarms were recorded in April and May.
An eruption with ash emissions began on 13 May 2012 and persisted until 30 January 2014 (BGVN 37:04, 38:03, 39:01). A summary of activity during that eruptive episode is provided below, along with additional information not previously reported. Activity after the end of that eruption, from February 2014 through December 2017, included only steam and gas emissions from the summit crater, and low levels of seismicity.
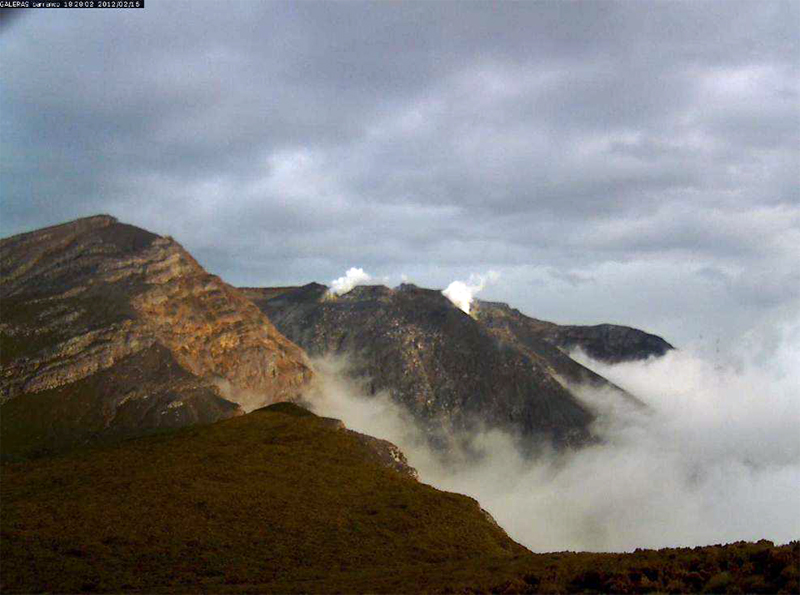
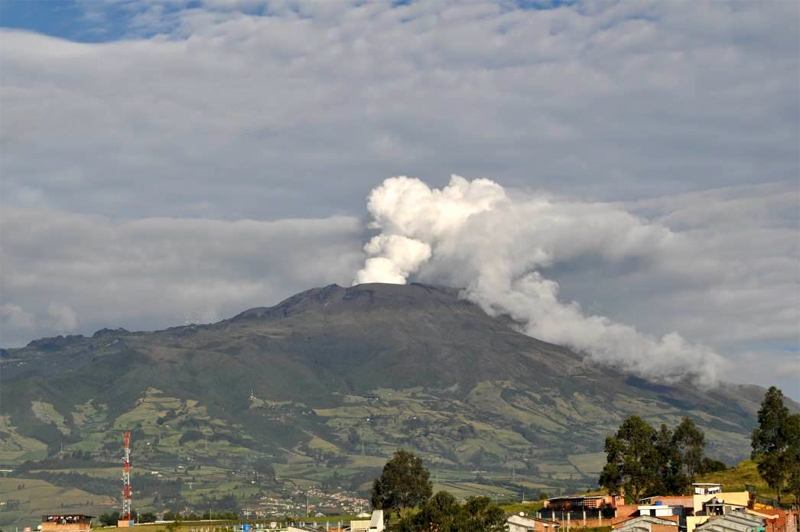
Activity during 2012. During January and February 2012, steam plumes rose 900-1,000 m above the summit, emerging from the El Paisita and Chavas vents at the N and W rims of the summit crater (figure 130). Plumes rose higher during March, reaching 1,900 m. VT seismic swarms were reported between 11 and 16 April 2012, and deformation sensors recorded inflation towards the W flank beginning in April. Most of the seismicity was located within the vicinity of the summit crater at depths less than 5 km. Steam plumes rose to 2,300 m above summit in April (figure 131).
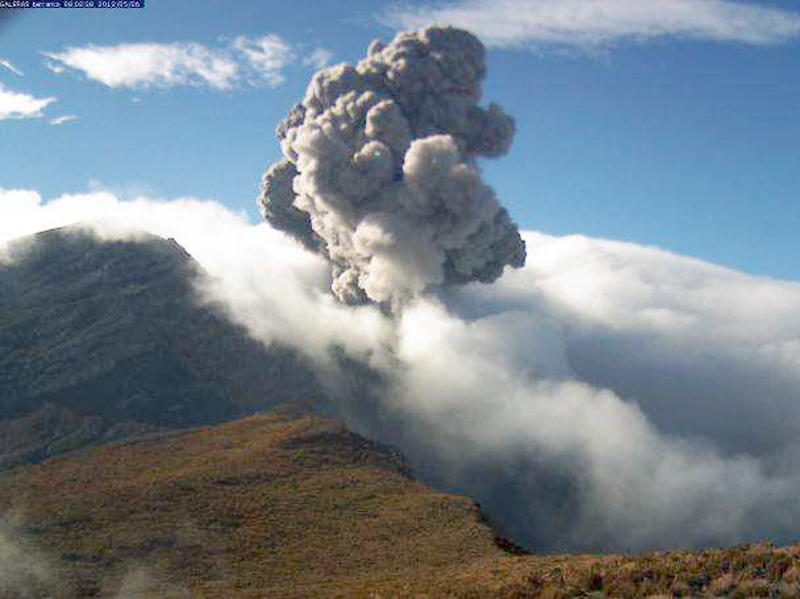
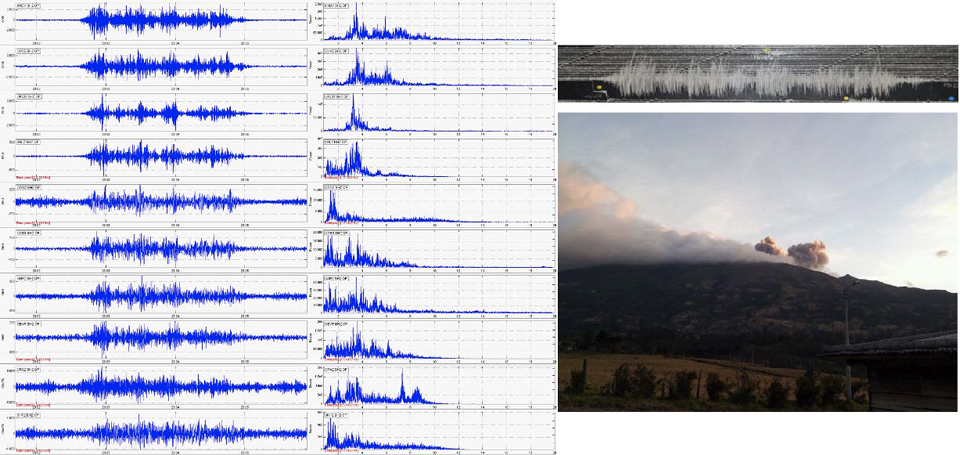
Steam plumes rose less than 200 m above the summit at the beginning of May; a second swarm of VT seismic events on 9 and 10 May 2012 preceded a new sequence of ash emissions that began on 13 May. Pulsating plumes of ash rose less than 800 m and deposited material primarily on the upper NW flank. Inflation continued to be measured in the inclinometers on the W flank, coinciding with the area of the epicenters of the 9-10 May seismic swarm. Ash-bearing emissions were reported on 13, 14, 17, 26 (figure 132), 27, and 30 May.
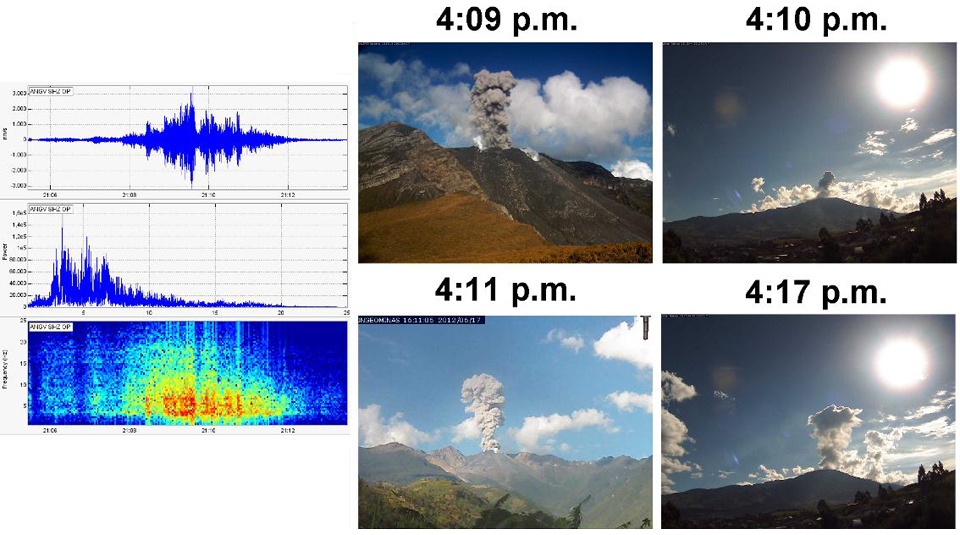
Ash emissions continued during June-August 2012. Plume heights during the period ranged from 1,300-2,500 m above the summit. Plumes recorded on 12 and 17 June (figure 133) resulted in ashfall in Sandoná (14 km NW) and Samaniego (32 km NW), Mapachico (9 km NE), and Genoy (7 km NNE). Additional days with reports of ash emissions included 5, 6, 8, 19, 22, 27 and 29 June. Ash-bearing emissions were reported on at least 16 days during July with reports of ashfall in Maragato, Chorillo (18 km W) and Genoy. Ash plumes rose to 2,500 m above the summit during at least nine different days of August, and ashfall was reported again in the Genoy area.
Tremor associated with gas and ash emissions persisted throughout September 2012; another VT seismic swarm was reported on 28 September. Ash-bearing emissions were reported during at least seven days of the month, and reached 2,000 m above the crater (figure 134). During at least 16 days of October, tremors were associated with ash emissions that rose as high as 1,800 m. On 19 October, fine-grained ashfall was reported by personnel of the Observatory who were working on the upper NE flank.
Gas and ash plumes rose 1,000-1,300 m during November and December 2012 and were also associated with tremor signals. The most significant emissions were observed on 1, 7, 14, 22, 23, 29 and 30 November, and 17 (figure 135), 19, 21, 26, 27 and 29 December.
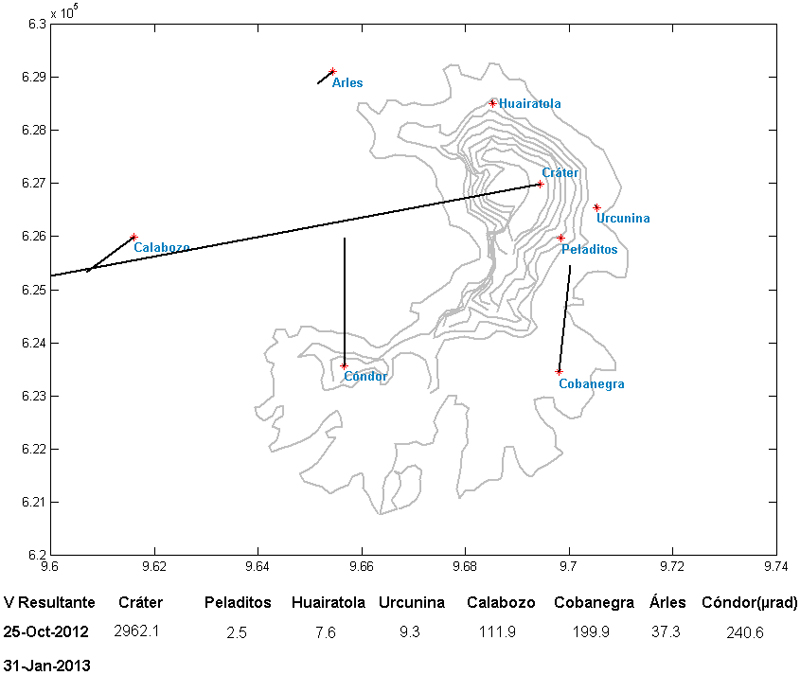
Activity during 2013. Continuous inflation towards the western flank was measured beginning in April 2012. Similar deformation processes continued at Galeras during much of 2013. The 'Crater' inclinometer located about 0.8 km E of the summit crater showed the most significant amount of westward inflation (figure 136).
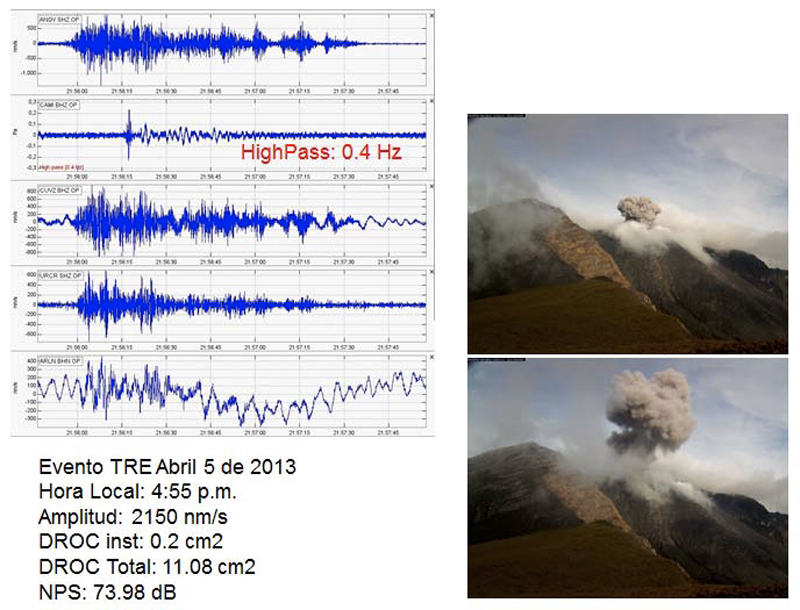
Eruptive activity continued in a similar manner to 2012 throughout 2013. During January, ash-bearing emissions rose up to 1,000 m at least nine times and drifted in various directions. The emission event of 22 January caused ashfall in Sandoná (13 km NW). During February, the most notable seismic activity was several tremor events associated with ash emissions. Plume heights remained below 1,500 m and were observed on at least 11 days of the month. There were reports of ashfall in San Isidro, the upper part of the municipality of Sandoná, NW of the volcano, during the morning of 24 February. Most of the ash emissions during March 2013 were deposited on the upper NW flank. The Crater, Cobanegra, and Calabozo inclinometers continued to show movement associated with inflation towards the W flank during March and April. Gas and ash plumes reached 1,000 m above the summit on 6, 7, 11, 22 and 25 March. Activity was similar during April, with plumes rising to 1,200 m and seismic tremors associated with ash and gas emissions reported on at least 13 days (figures 137 and 138).
Seismic activity decreased somewhat during May 2013, although tremor signals associated with ash and gas emissions were noted on at least eight occasions. The pulsating ash plumes were small, and deposited material mostly on the NW flank. The deformation network recorded stability at the Crater inclinometer for the first time in many months. SGC noted a seismic swarm during the evening of 22 May that included a tremor event that lasted for 11 minutes and possibly included ash emissions.
Emissions during June 2013 were mostly steam that rose to 1,300 m, but ash plumes were reported on seven days. The frequency of seismic activity remained steady during July, but the amount of energy released increased significantly. The Crater inclinometer showed deflation. Ash and gas plumes were noted on 6, 12, 13, 17 and 22 July rising as high as 1,500 m. Seismic frequency and energy both decreased during August and September 2013, and inclinometers showed little change in deformation. Plume heights, mostly gas and steam, remained below 500 m. Tremors associated with ash emissions were reported on five days of August and on 3, 11 and 14 September.
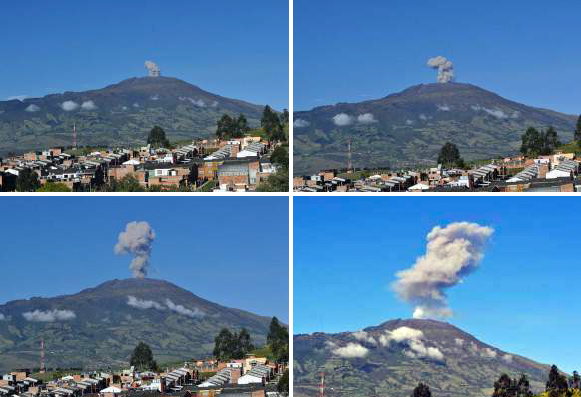
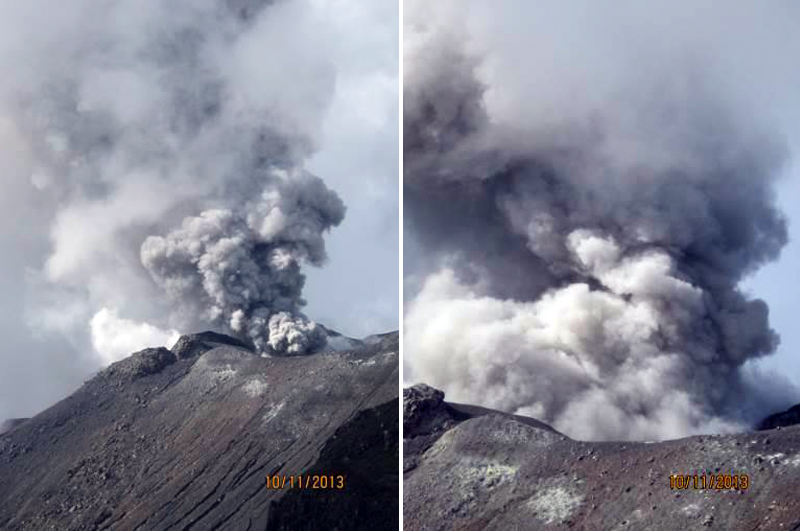
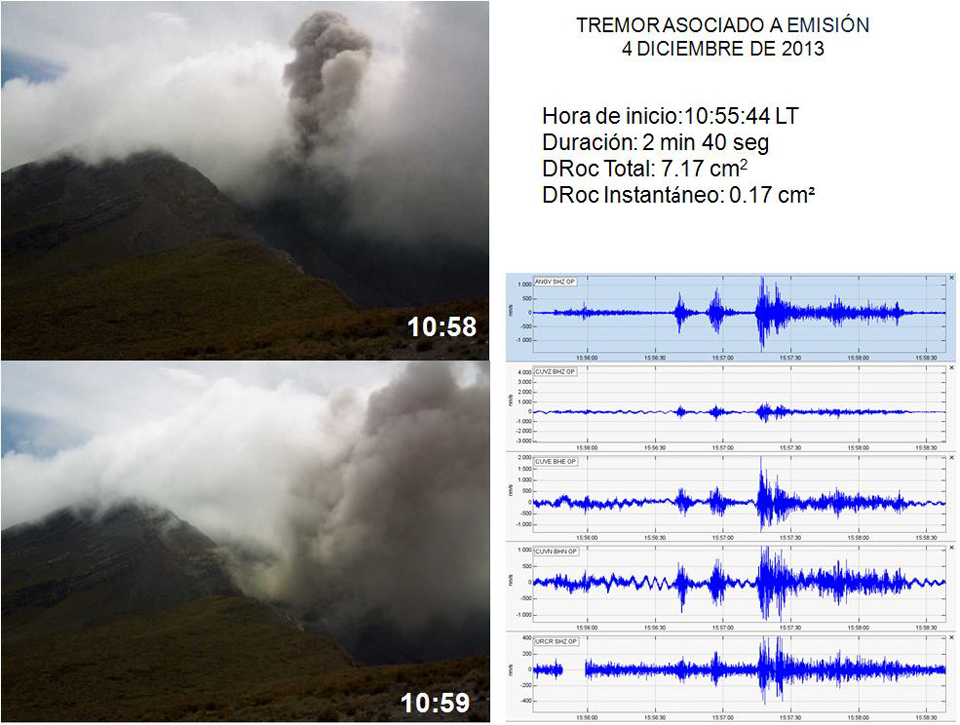
Seismicity increased in both amplitude and frequency during October and November 2013. The majority of the VT seismicity was located on the NE flank at 5-10 km depth. Steam plume heights remained below 600 m; emissions reported on 8 and 11 October included ash (figure 139). In addition to steam plumes observed throughout November, ash plumes were reported rising to 1,000 m on 17, 23, and 30 November. Seismicity decreased during December 2013 while deformation remained stable. Ash plumes were reported on 4, 13, 26, 27, and 31 December associated with tremor events (figure 140).
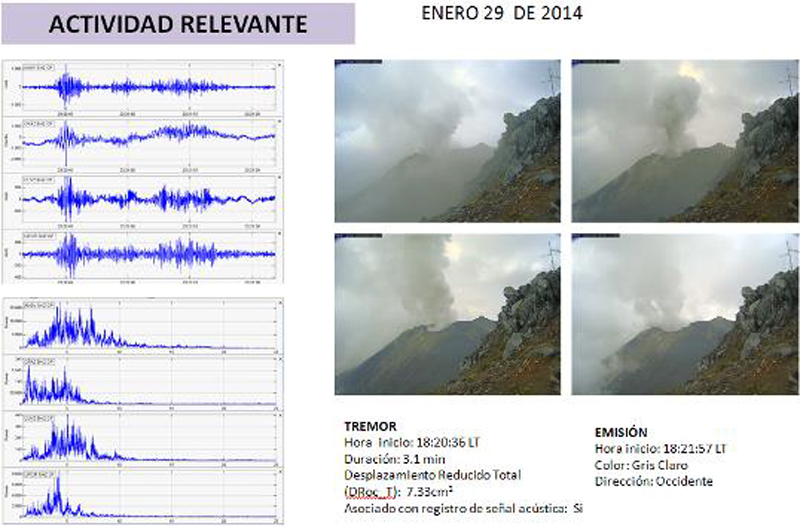
Activity during 2014. Tremor events during 11-14, 21, 23, and 27-30 January 2014 were associated with ash and gas emissions (figure 141) that reached 850 m above the summit. During the early hours of 11, 13, and 23 January, incandescence was observed at the crater. The last confirmed ash emission of the year occurred on 30 January 2014.
A decrease in both frequency and energy levels of seismicity were reported during March 2014. SGC noted several tremor-type seismic events associated with gas emissions; steam plumes rose up to 1,000 m above the summit. Although they reference "gas and ash" emissions in a few photographs, only steam is visible in the photographs from March. Reports of activity by SGC for April and May 2014 refer to only steam plumes rising 1,000 m from the summit from the vents on the N and W sides of the crater rim. No further reports are available for Galeras for 2014.
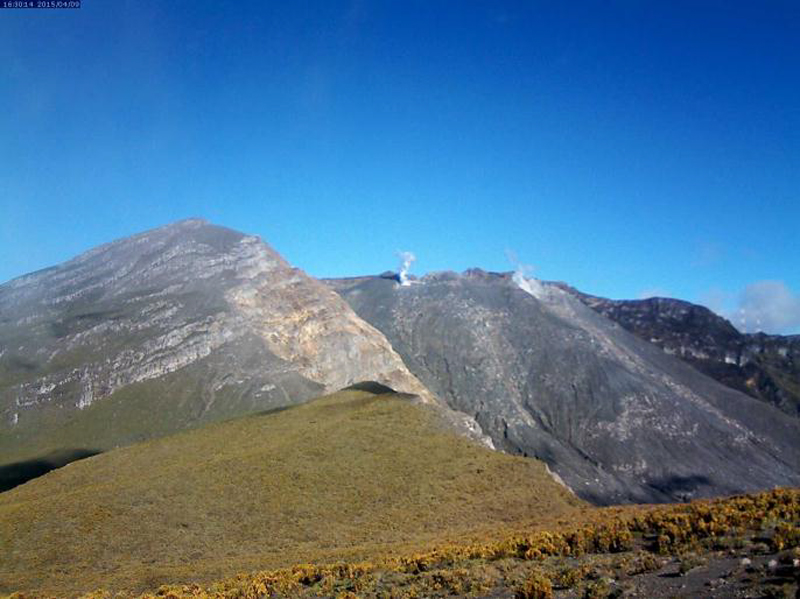
Activity during 2015-2017. Throughout 2015, SGC reported only steam plumes rising from the two vents at the summit of the Galeras pyroclastic cone, known as the Chaldean fumarole fields (Las Chavas) on the W rim, and the El Paisita on the N rim (figure 142). Plume heights were as high as 700 m in January, but dropped below 200 m by May, where they remained for the rest of the year. Inflation to the W began again in September 2014 and continued through May 2015.
Minor variations in seismic frequency and energy levels fluctuated throughout 2016 and 2017, but there were no reported particulate emissions. Steam emissions from the two primary vents at the summit crater (Las Chavas and El Paisita) rarely rose more than 200 m above the summit, often drifting NW.
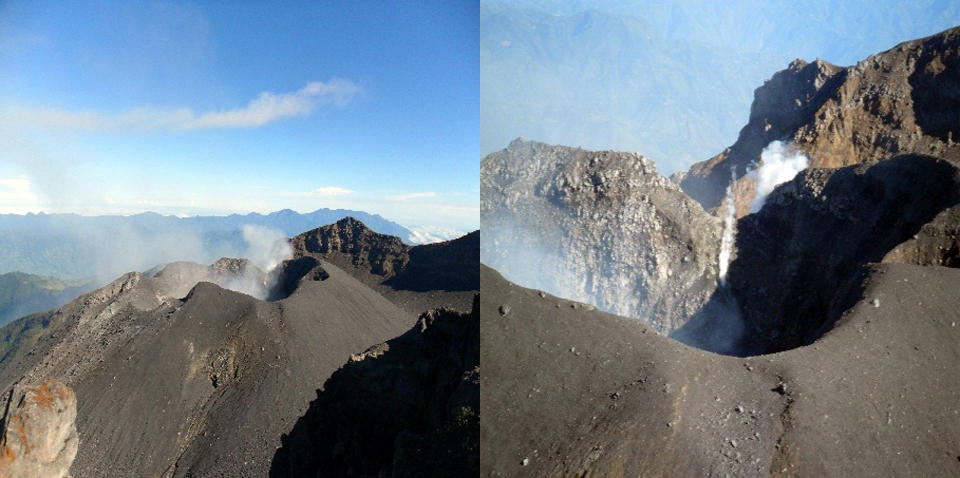
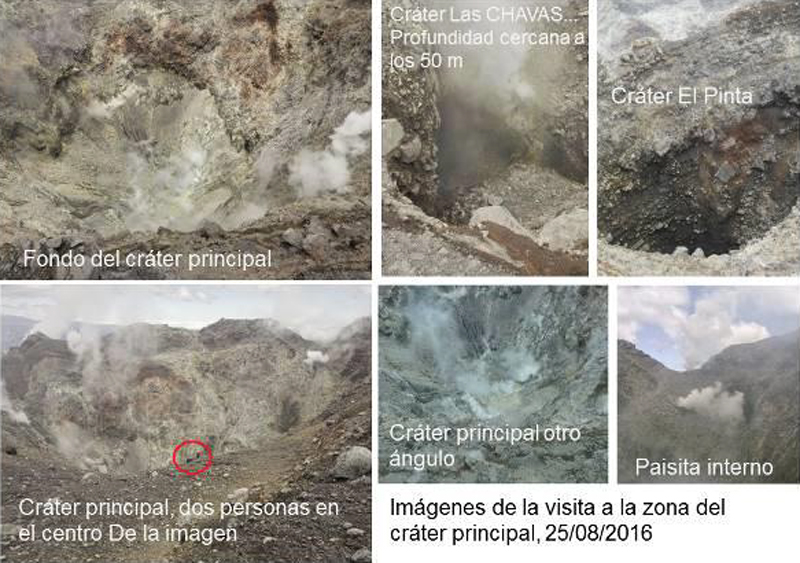
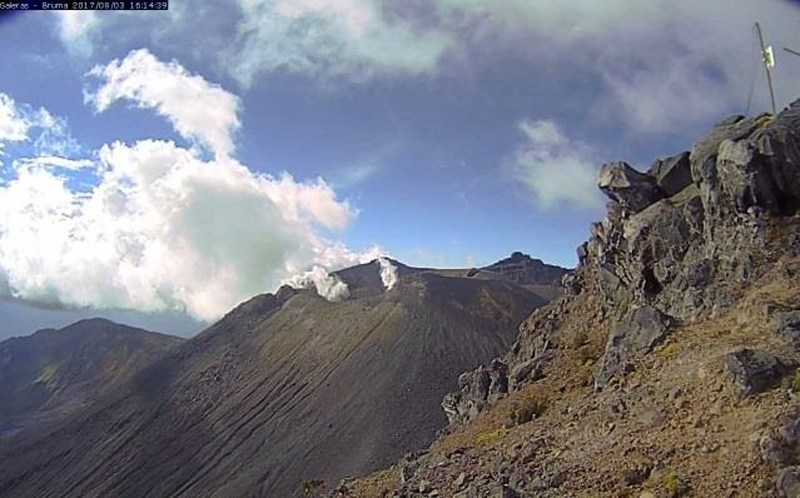
An inspection of the summit crater by SGC on 25 August 2016 revealed a deep vent with several points of gas emissions (figure 143), including areas on the N wall (El Paisita) and the E wall (Las Alterada). The W wall (Las Chavas) had a cave-like entrance of 50 m diameter with fumarolic activity on the back wall and the ceiling that condensed into a sulfur-rich water on the floor of the opening. The El Pinta vent had no observed emissions. A rare 200-m-high steam plume rose from the crater in October 2016, but otherwise activity remained very low at Galeras throughout 2017 (figure 144).
Geological Summary. Galeras, a stratovolcano with a large breached caldera located immediately west of the city of Pasto, is one of Colombia's most frequently active volcanoes. The dominantly andesitic complex has been active for more than 1 million years, and two major caldera collapse eruptions took place during the late Pleistocene. Long-term extensive hydrothermal alteration has contributed to large-scale edifice collapse on at least three occasions, producing debris avalanches that swept to the west and left a large open caldera inside which the modern cone has been constructed. Major explosive eruptions since the mid-Holocene have produced widespread tephra deposits and pyroclastic flows that swept all but the southern flanks. A central cone slightly lower than the caldera rim has been the site of numerous small-to-moderate eruptions since the time of the Spanish conquistadors.
Information Contacts: Servicio Geologico Colombiano (SGC), Diagonal 53 No. 34-53 - Bogotá D.C., Colombia (URL: https://www2.sgc.gov.co/volcanes/index.html).

