Report on Nevados de Chillan (Chile) — December 2021
Bulletin of the Global Volcanism Network, vol. 46, no. 12 (December 2021)
Managing Editor: Edward Venzke.
Edited by A. Elizabeth Crafford.
Nevados de Chillan (Chile) New lava flows and domes accompany heightened explosive activity, May-November 2021
Please cite this report as:
Global Volcanism Program, 2021. Report on Nevados de Chillan (Chile) (Crafford, A.E., and Venzke, E., eds.). Bulletin of the Global Volcanism Network, 46:12. Smithsonian Institution. https://doi.org/10.5479/si.GVP.BGVN202112-357070
Nevados de Chillan
Chile
36.868°S, 71.378°W; summit elev. 3180 m
All times are local (unless otherwise noted)
Nevados de Chillán is a large complex of late-Pleistocene to Holocene stratovolcanoes in the Chilean Central Andes that has had multiple recorded eruptions dating back to the seventeenth century. The most recent started with a phreatic explosion and ash emission on 8 January 2016 from a new crater (Nicanor) on the E flank of Nuevo crater, itself on the NW flank of the large Volcán Viejo stratovolcano. Strombolian explosions and ash emissions continued throughout 2016 and 2017; the growth of a lava dome within Nicanor was confirmed in early 2018. Multiple lava flows emerged from the crater beginning in late 2019, while explosions, block-and-ash pyroclastic flows, and frequent ash plumes continued into 2021. This report covers activity from May-November 2021 when ongoing eruptive activity produced ash plumes, the growth of domes inside the crater, and multiple lava flows extending down the N and NE flanks. Information for this report is provided primarily by Chile's Servicio Nacional de Geología y Minería (SERNAGEOMIN)-Observatorio Volcanológico de Los Andes del Sur (OVDAS), the Buenos Aires Volcanic Ash Advisory Center (VAAC) and from satellite data.
During May-November 2021 there was continuing activity on the existing L5 flow and the development of three new flows (L6, L7, and L8) that traveled hundreds of meters down the N and NE flanks. Ash plumes rose generally 1-2 km above the crater, generated by the hundreds to thousands of explosions reported each month. Multiple daily reports of ash emissions were issued by the Buenos Aires VAAC during May through mid-August, followed by more intermittent emissions through September, before returning to multiple daily reports for most of October and November. Block and ash flows descended several hundred meters down the flanks, mostly N and NE, multiple times each month. Incandescent ejecta rose several hundred meters above the summit during many of the explosions, with ejecta falling back into the crater and also onto the flanks. The growth of two new domes was reported in September and October, followed by surges of lava flow activity in November. Thermal activity, as reflected in the MIROVA data (figure 79), closely followed the activity observed at the various flows.
Activity during May-June 2021. At the beginning of May 2021, the L5 lava flow, which first appeared on the N flank of Nicanor crater in June 2020, was reported as extending 938 m from the edge of the crater, about 50 m thick at the front, and moving at a rate of about 10 cm/hour. An increase in the eruptive rate had been noted after 28 April. The character of the eruption changed on 2 May with higher, denser, ash plumes, and greater intensity of incandescence. Explosions generated block and ash pyroclastic flows that extended less than 400 m down the NE flank and resulted in partial destruction of the dome inside the crater. Shorter block-and-ash flows also affected the SW flank, and ash was deposited around the crater rim.
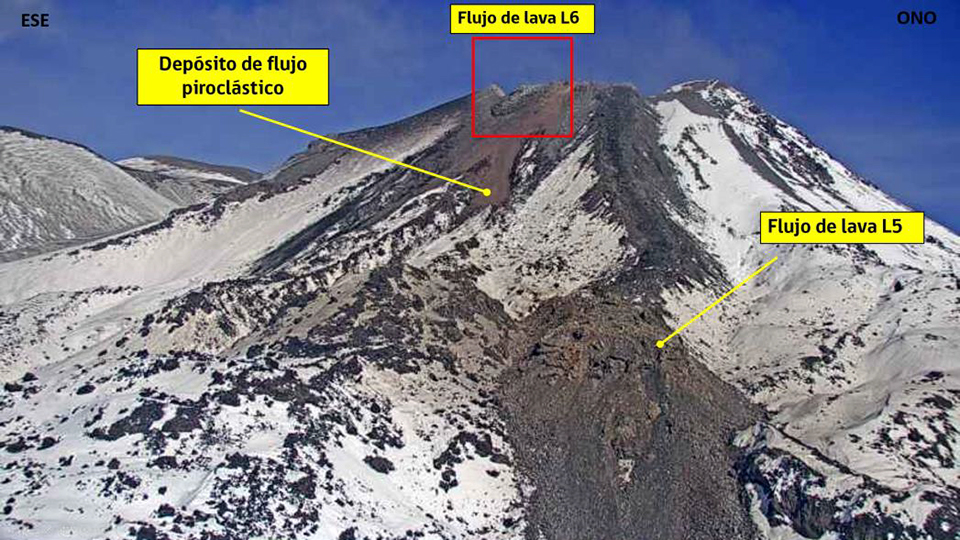
Satellite imagery on 4 May indicated a new thermal anomaly at the NE crater rim. This was confirmed the next day as a new lava flow (L6) reached 100 m from the rim (figure 80). Thermal camera measurements indicated a maximum temperature at L6 of 278°C and a new area of high temperature at the edge of L5 that registered as 307°C. Flow L5 continued to advance on the N flank with a maximum temperature of 208°C (figure 81).
During 6-15 May there were 127 VT seismic events and 1,652 discrete explosions reported. Explosions produced ash and steam plumes that reached up to 1,300 m above the crater (figure 82). Increased explosive activity resulted in a greater volume of ash in the emissions (figure 83). Additionally, the intensity, frequency, and extent of distribution of incandescent ejecta from the dome also increased, affecting the E, SE, and NE flanks. Pyroclastic flows extended 1.1 km NE and 230 m SE from the crater, and ash deposits were reported between 3.5 and 5 km away on the SW, S, and SE flanks.
The fissure feeding flow L5 grew to 40 m wide and 80 m long during the first half of May. Its growth resulted in the partial collapse of the NE rim, producing a deposit 160 m long. Activity at the dome was characterized by destruction of its E portion, which resulted in the source of the new L6 flow. By 15 May, L5 had reached 966 m from the rim, moving at a rate of 20 cm/hour and the secondary flow from the NE rim near L5 had reached 220 m from the crater rim. Flow L6 was moving rapidly, advancing at a rate of 3.6 m/hour and grew to 640 m in length. Sentinel-2 satellite imagery showed the advance of the L6 flow down the NE flank during May (figure 84)
Explosive activity increased significantly during the second half of May with 3,668 recorded events. Ash plumes rose as high as 1,400 m above the rim and nighttime incandescence was concentrated in the E part of the crater. Ejecta affected the E, SE, and NE flanks, and block-and-ash pyroclastic flows reached 1.1 km NE of the volcano. Flow L5 did not advance, its front remaining at 966 m from the rim, but new material flowed over the existing channel and widened the lower part of the flow. L6 continued to advance at a velocity of 1.16 m/hour and reached 894 m from the rim. The secondary lobe off L5 also continued to advance and recorded a temperature similar to L6. Data from the GNSS network showed a vertical component deflation of 51 mm during 2-14 May.
Explosions continued at a high rate during the first half of June 2021 with 2,853 discrete events. Ash plumes rose as high as 1,140 m above the summit; nighttime incandescence was concentrated on the E part of the crater, and ejecta affected the E and SE flanks. Pyroclastic flows reached 600 m down the E flank and 400 m on the S flank. A series of LP seismic events on 14 June produced incandescent ejecta that rose 200 m and sent multiple blocks down the flanks. During the second half of the month plumes, frequently with ash, reached 1,400 m above the summit; 1,901 explosive events were recorded (figure 85). Incandescent ejecta rose as high as 500 m and affected the N, E, and S flanks (figure 86). Pyroclastic flows on 19, 27, 28, and 29 June traveled up to 500 m down the NE flank.
Flows L5 and L6 remained active during the first half of June. Flow L5 reached 1 km in length with a very slow advance rate as most of the activity produced flows overtop of the existing channel that spread out laterally, widening the flow on the distal slope and causing frequent block avalanches. Flow L6 remained at 894 m by mid-June; activity was largely widening the flow in the middle section. A new pulse of lava on 6 June produced levees along the L6 channel and created a zone of accumulation near the toe of the flow. By the end of June, flow L5 had reached 1,022 m from the crater rim; activity on L6 continued, but it expanded laterally and thickened without extending in length. The flow rate increased during 17-19 and 27-29 June, resulting in new lobes advanced over existing flows with temperatures considerably higher than observed previously (figure 87). There was also increased nighttime incandescence, additional block-and-ash pyroclastic flows, and higher plumes. Fresh lava at flow L5 extended the front by at least 100 m. Two new emission centers with explosive activity and gas emissions appeared at the crater rim between flows L5 and L6.
Activity during July-August 2021. During the first half of July 2021 there were 2,208 explosive events identified either acoustically or visually; ash plumes reached up to 1,140 m above the crater. The high levels of explosive activity produced frequent nighttime incandescence and incandescent blocks descended the N, E, and S flanks, reaching as far as 500 m down the E flank. SERNAGEOMIN issued numerous special reports describing explosions that produced ash plumes rising several hundred meters and drifting in multiple directions, including multiple events of pulsating ash and ejecta on 10 July. No pyroclastic flows were observed. Flow L5 was measured at 1,064 m in length from the crater rim, advancing slowly at 50 cm/hour by mid-month. The overall length of L6 remained at 894 m, but a surge of activity from the L6 vent during 5-10 July produced a thermal anomaly 420 m down the flow. Both flows showed significant instability, with collapses and block avalanches from the flow fronts on the NE slope.
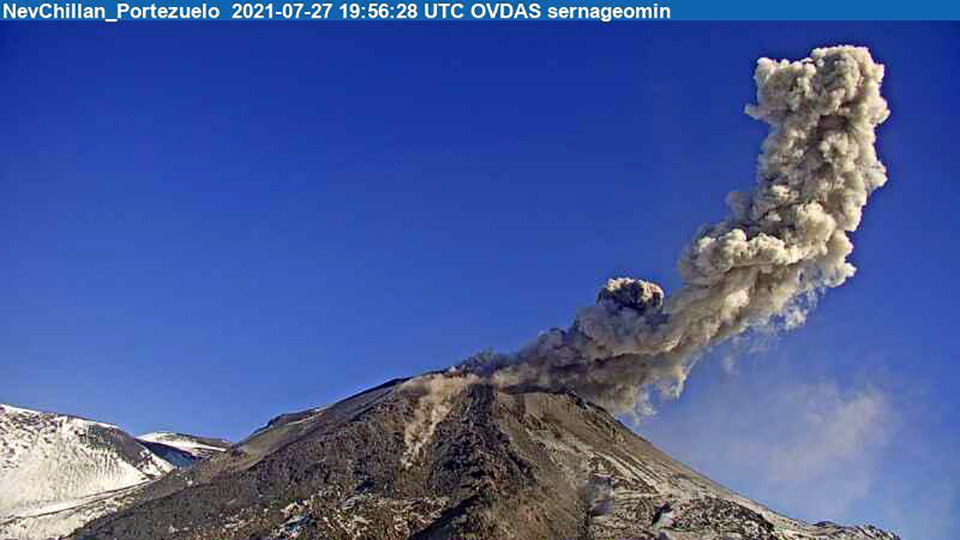
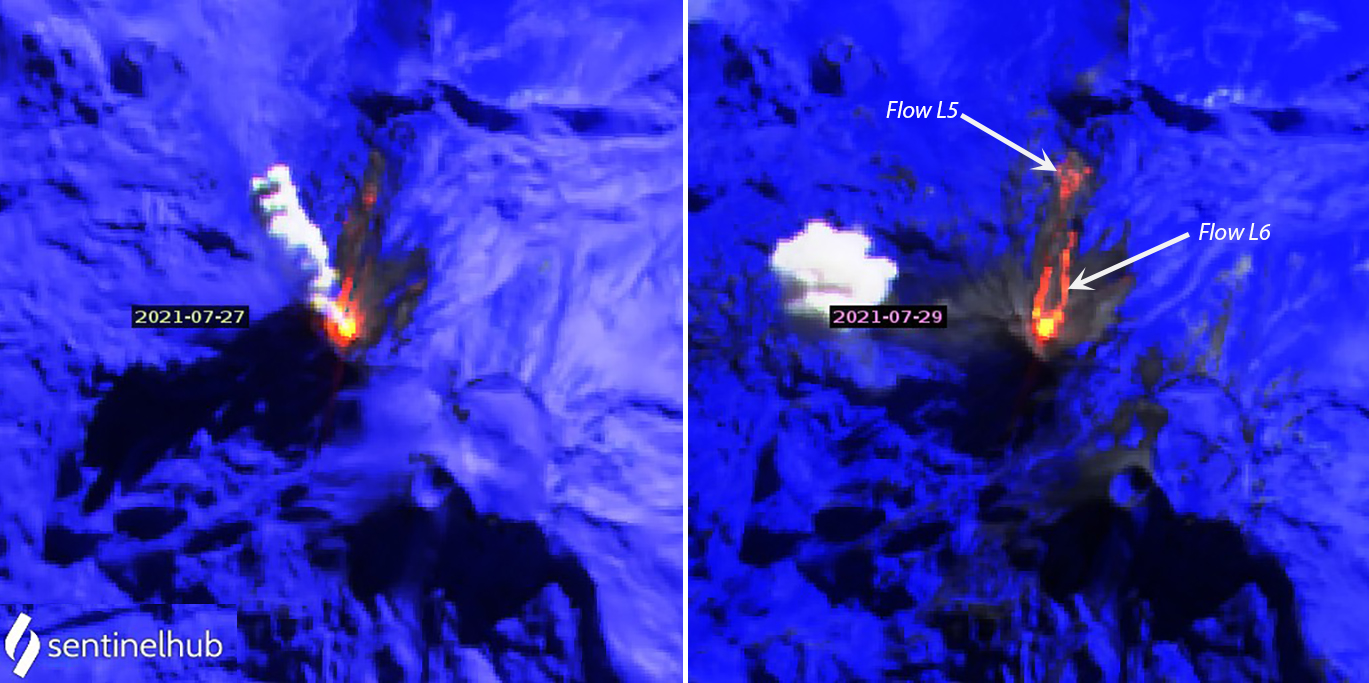
High levels of explosive activity continued during the second half of July with 2,964 events either seen in webcams or detected acoustically. Ash-rich plumes rose up to 1,900 m above the crater. A new explosive center located SE of the L5 flow vent was responsible for explosions with incandescent blocks that fell up to 500 m down all of the flanks. Pyroclastic flows occurred on 27 and 28 July on the NE flank, both N and S of L6, and to the NNW (figure 88). The farthest-reaching pyroclastic flow traveled 555 m down the NE flank on 28 July. Frequent collapses continued from the edges of both lava flows. Flow L5 continued advancing slowly at 10 cm/hour, reaching 1,101 m in length; flow L6 did not advance until the last four days of the month. High thermal radiance was observed along the entire length of L5, while a significant decrease in the temperature of L6 was observed until a new pulse of lava was detected on 27 July (figure 89); it advanced 100 m in four days.
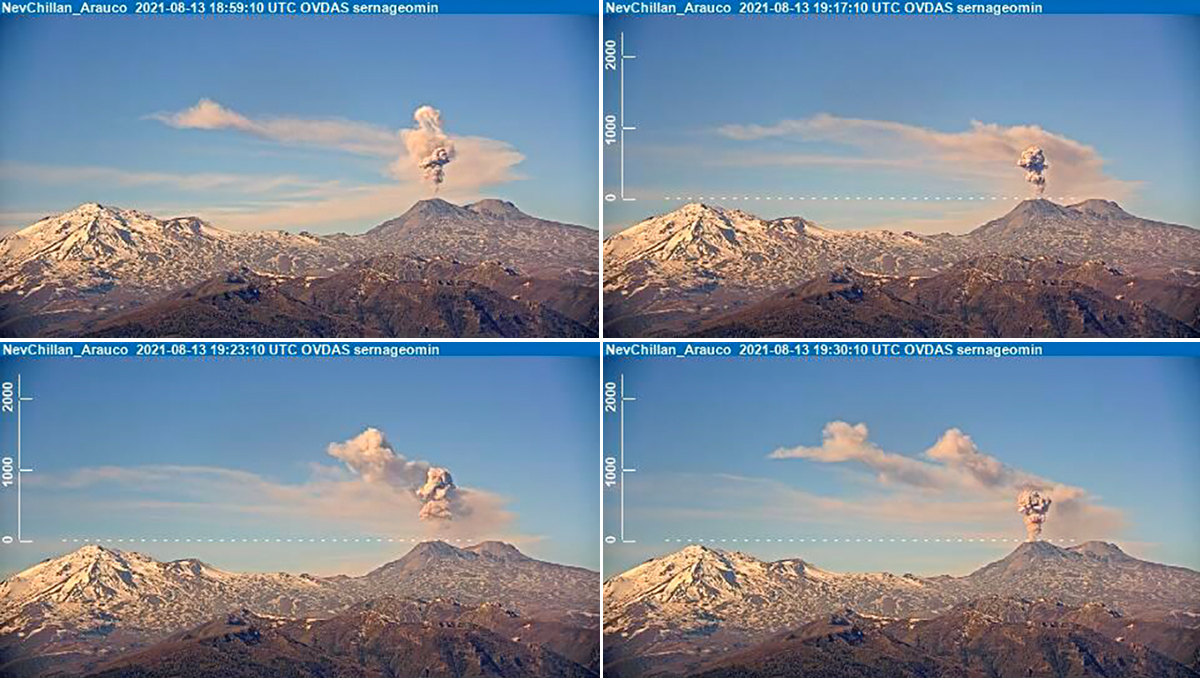
The increase in explosive activity continued into August 2021 with over 3,000 events recorded from either acoustic measurements or emissions seen in webcams during the first half of the month. Dense ash plumes rose up to 1,480 m above the summit. Two adjacent emissions centers were active inside the Nicanor crater. The high levels of explosive activity produced incandescent blocks and ash that dispersed up to 500 m down all the flanks. During 8-12 August the explosion rate increased, and pyroclastic flows affected the NE flank, extending 570 m E, 450 m N, and 270 m NE (figure 90). Four closely spaced explosions on 13 August produced a series of plumes that rose to 1,240 m and were captured by the Arauco webcam to the N (figure 91). Collapses were common along the flow fronts of both L5 and L6, sometimes triggered by explosions.
Flow L5 continued advancing during the first half of August at a much higher rate of 1.2 m/hour compared to previous months, and reached 1,277 m from the crater rim, while L6 remained constant at 850 m. Webcams showed a constant supply of fresh material in the central channel of L5; the flow changed course to the NW after encountering a topographic barrier. Sentinel-2 images showed a thermal anomaly in the center channel of L6 for about the first week, after which there was only a strong anomaly at the emission point inside the central crater. A site visit to the front of L5 during the first two weeks of August corroborated the instability and recurring collapses of the flow as seen in webcam images. The thickness of the flow front was estimated at 20 m and maximum temperatures there were 440-460°C; most temperatures in the medial part of the L5 flow were around 265°C. Scientists observed levees and secondary flows along the length of the flow, and a high degree of alteration and instability at the front. Rock and ash samples of the L5 flow were taken.
A sharp decline in activity was reported for the second half of August 2021. Poor weather reduced visibility; only 476 explosions were observed. Most of the plumes, which reached up to 1,080 m, consisted of gas and steam, but they were more frequently interspersed with ash-bearing plumes at the end of the month. The drainages on the NE flank were affected the most by pyroclastic flows and blocks from the flow-front collapses, especially from flow L5, with the longest pyroclastic flow reaching 560 m from the crater rim. Although flow L5 grew to 1,380 m long with a flow rate of 1 m/hour, flow L6 remained static through the end of August, and the overall thermal anomalies decreased significantly. Data recorded in the GNSS instruments suggested an inflation of the volcano of 5 mm between 27 July and the end of August.
Activity during September-November 2021. Slightly over 300 explosions were either observed in webcams or measured with acoustic monitors during the first half of September 2021. New harmonic tremors were detected on 7 September. During 10 September there was a sudden increase in the size of the LP seismicity which continued through 15 September along with another pulse of harmonic tremor on 14 September. The plumes from explosive events reached 1,060 m above the crater rim, most with high concentrations of ash during the first week, changing to mostly steam and gas by the end of the second week. A few of the explosions contained very dense concentrations of maroon-colored tephra originating from the center of the crater. A pyroclastic flow on 3 September reached 550 m down the NE flank. Little nighttime incandescence was reported except for 14 September when ejecta rose less than 200 m high and remained within the crater.
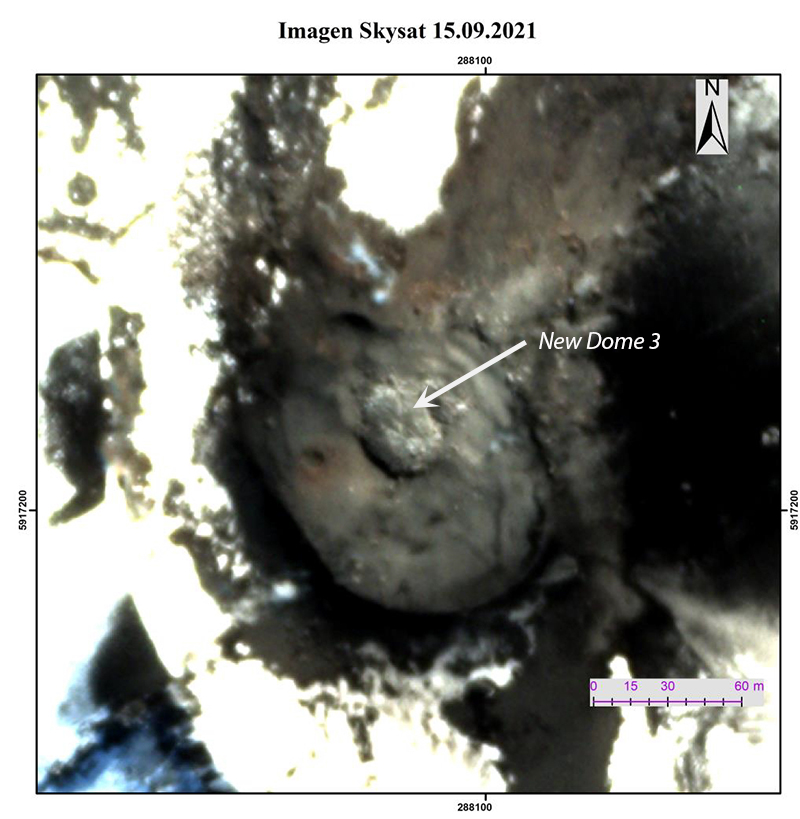
Flows L5 and L6 showed very little movement; during the first week, the central channel of L5 was active but diminished by the end of the second week. Satellite images showed no thermal anomalies in the channels of either flow throughout the month. The growth of a new lava dome (Dome 3) inside the crater was confirmed by satellite imagery on 15 September and was measured to be 27 x 40 by SERNAGEOMIN (figure 92). The fissure feeding the dome was located slightly NW of the fissure that fed flow L6. Inflation continued to be measured with a vertical rate of about 10 mm/month and a horizontal radial inflation pattern of about 5 mm/month.
Although the number of explosive events increased in the second half of the month, the overall energy of the events decreased significantly. Most plumes rose only 300 m; the highest reached 1 km on 27 September. They were white and gray with low quantities of ash. No pyroclastic flows were observed, but permanent incandescence was visible from inside Nicanor crater. A fourth dome was identified adjacent to Dome 3 in satellite images on 18 September with elliptical dimensions of 36 x 43 m. Dome 3 continued to enlarge and was estimated to be 39 x 64 m on 24 September. Evidence from the webcams on 29 September suggested that a new flow (L7) issued from Dome 4, between flows L5 and L6, and measured about 50 m from the crater rim, moving at a rate of about 40 cm/hour. Also apparent was a reactivation from the vent that fed flow L5, which grew to 50 m in length, with the new material descending adjacent to the previous flow. Vertical inflation continued at a rate of about 50 mm/month, and the horizontal component showed a slight increase as well.
Explosions during the first half of October 2021 produced white and gray plumes with a moderate content of ash and ejecta. Most plumes rose less than 400 m, but the tallest reached 1,620 m on 9 October. Incandescence was visible during both day and night, and ejecta that rose as high as 350 m landed around the crater and on the NW rim in the area of the new lava flow. Flow L7 remained active with the main channel in the saddle between L5 and L6; a secondary lobe (L7b) traveled over the previous L6 channel. By 18 October the central channel of L7 was estimated to be 930 m long from the emission point, moving at a speed of 1.5 m/hour. Flow L7b had reached 350 m by 14 October when movement ceased. The new L8 flow (figure 93), located W of L5, reached 280 from the emission point, moving at a speed of 20 cm/hour. Flow L5 remained inactive.
Satellite imagery from 6 and 7 October showed the area of Dome 3 to be about 4,000 m2. Vertical inflation continued to be measured at a rate of 50 mm/m with a total accumulation since early August of 1.4 cm. A significant increase in the temperature around the active crater was measured in thermal imagery, associated with the growth of flows L7 and L8. During explosive activity on 3 and 7-10 October temperatures exceeded the range of the thermal camera measurements (over 360°C). The average temperature of L7 was 152°C on 4 October and a maximum temperature of 280°C was observed during collapses associated with an increase in the velocity of the flow. Flow L8 was initially measured at 106°C on 7 October, and the maximum temperature of 240°C was measured the next day when the flow rate increased.
Many of the 956 recorded explosive events that occurred during the second half of October produced plumes of gas and ash. The plumes rose from the Nicanor crater, and alternated white, vapor-dense plumes and gray plumes with ash. The highest plume reached 1,580 m above the crater on 18 October. Occasional stronger explosive events sent incandescent ejecta onto the N slope and pyroclastic flows onto the NE slope as far as 500 m. The height of the ejecta didn’t exceed 350 m from its source at the L8 flow vent on the NE rim of the crater. Surface explosions increased in energy on 18 and 23 October. The flow rate for flows L7 and L8 decreased during the second half of October. By 29 October L7 had reached 943 m in length, and L8 had reached 382 m. The lobe L7b did not advance after 14 October. The geodetic network indicated deformation stability with little or no continued inflation observed.
Explosions from the Nicanor crater during the first half of November continued to alternate between steam-dense white plumes and ash-laden gray plumes. Discrete explosions produced emissions that rose as high as 2 km on 8 November. The stronger explosions caused incandescent blocks on the N slope as well as pyroclastic flows on the NE flank. The largest events, on 8 and 10 November sent material as far as 700 m down the flank and ash emissions to 1,120 m above the summit that drifted SE.
Neither flows L7 or L8 extended in length during the period, but both remained active with lava moving in their main channels. Satellite images also identified a new effusive body around the emission center of L7 estimated at 80 m long and 55 m wide. SERNAGEOMIN inferred that the extrusion began around 28 October, and that most of the structure was destroyed during explosions on 8 November. Following this, a new pulse of lava from L7 was observed in webcams on 9 and 14 November, with growth of the flow to the SE and E. An increase in the vertical inflation rate of the volcano to 10 mm/month was noted, but the horizontal component remained stable.
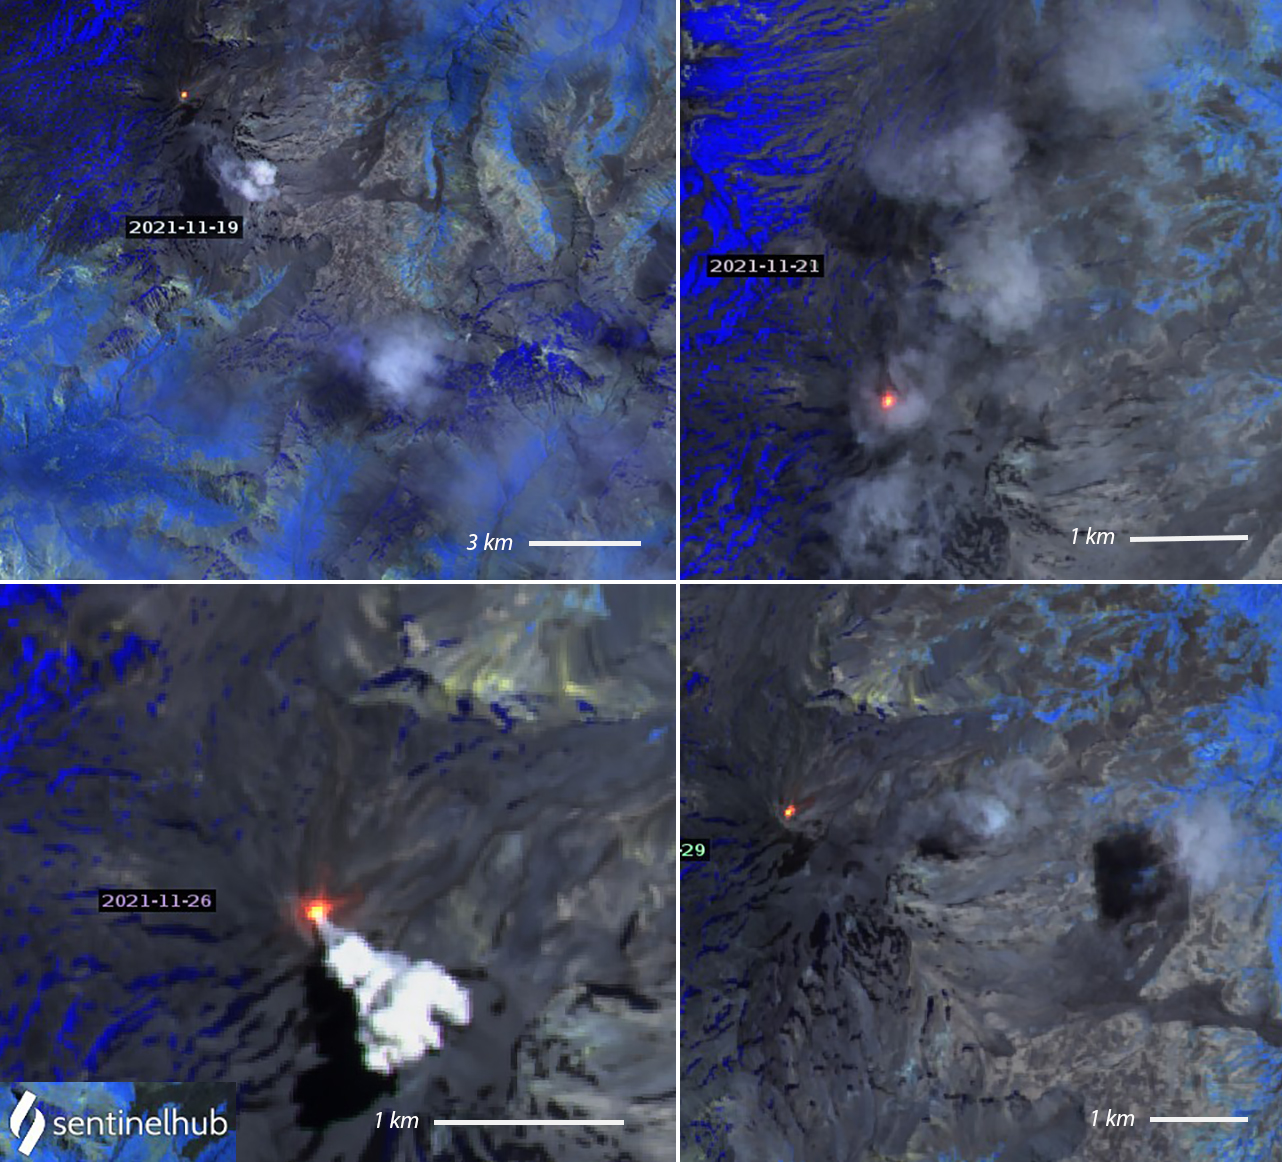
Both gray and white explosions continued for the rest of November 2021 with the tallest plume reaching 1,700 m above the summit on 22 November. Pulsating explosions released multiple plumes on several different days (figure 94). Incandescent ejecta was frequently reported on the N flank, and the number of daily explosions increased towards the end of the month. Occasional pyroclastic flows were observed on the NE flank, reaching up to 500 m from the crater rim. There were multiple new pulses of lava feeding the L7 and L8 flows. A new pulse on 19 November at flow L7 sent lava 477 m to the N and 465 m down the L7b channel to the NE. A pulse in the flow L8 channel reached 198 m the same day, moving with a velocity of 30 cm/hour. Vertical inflation continued at an estimated rate of about 10 mm/month; both vertical and horizontal inflation increased the most during 20-23 November.
Geological Summary. The compound volcano of Nevados de Chillán is one of the most active of the Central Andes. Three late-Pleistocene to Holocene stratovolcanoes were constructed along a NNW-SSE line within three nested Pleistocene calderas, which produced ignimbrite sheets extending more than 100 km into the Central Depression of Chile. The dominantly andesitic Cerro Blanco (Volcán Nevado) stratovolcano is located at the NW end of the massif. Volcán Viejo (Volcán Chillán), which was the main active vent during the 17th-19th centuries, occupies the SE end. The Volcán Nuevo lava-dome complex formed during 1906-1945 on the NW flank of Viejo. The Volcán Arrau dome complex was then constructed on the SE side of Volcán Nuevo between 1973 and 1986, and eventually exceeded its height. Smaller domes or cones are present in the 5-km valley between the two major edifices.
Information Contacts: Servicio Nacional de Geología y Minería (SERNAGEOMIN), Observatorio Volcanológico de Los Andes del Sur (OVDAS), Avda Sta María No. 0104, Santiago, Chile (URL: http://www.sernageomin.cl/, https://twitter.com/Sernageomin); MIROVA (Middle InfraRed Observation of Volcanic Activity), a collaborative project between the Universities of Turin and Florence (Italy) supported by the Centre for Volcanic Risk of the Italian Civil Protection Department (URL: http://www.mirovaweb.it/); Buenos Aires Volcanic Ash Advisory Center (VAAC), Servicio Meteorológico Nacional-Fuerza Aérea Argentina, 25 de mayo 658, Buenos Aires, Argentina (URL: http://www.smn.gov.ar/vaac/buenosaires/inicio.php); Sentinel Hub Playground (URL: https://www.sentinel-hub.com/explore/sentinel-playground).


