
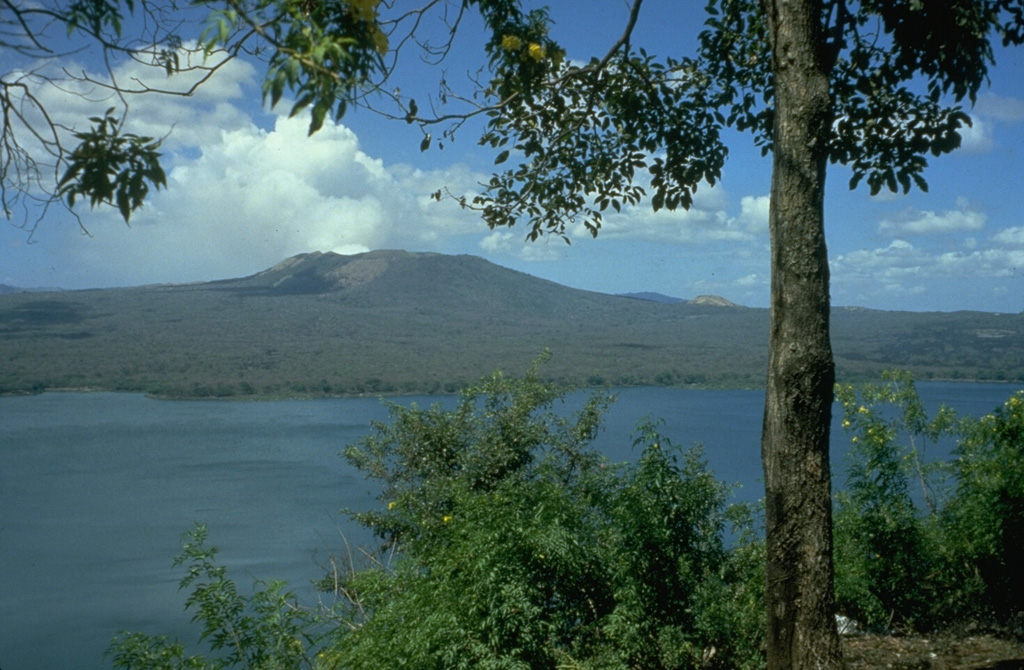
On 18 April INETER reported that there continued to be no signs of lava-lake activity at the bottom of Masaya’s Santiago Crater after material from a landslide had covered the lake on 2 March. Small landslides continued to occur periodically, and one was shown in a webcam photo from 17 April. Continuous diffuse gas emissions rose from a vent on the crater floor and from a new vent located on the inner SW wall.
Source: Instituto Nicaragüense de Estudios Territoriales (INETER)
Thermal anomalies in the summit crater during February-July 2023
Masaya, located about 20 km SE of Managua, the capital Nicaragua, is a broad, 6 x 11 km caldera with steep-sided walls up to 300 m high. The caldera is filled on its NW end by more than a dozen vents that erupted along a circular, 4-km-diameter fracture system. Eruptions have originated from the Nindirí and Masaya cones, which were constructed at the southern end of the fracture system and contain multiple summit craters, including the currently active Santiago crater. The Santiago crater contains a small lava lake that emits weak gas-and-steam plumes. The current eruption period began in October 2015 and more recently has been characterized by thermal activity in the summit crater (BGVN 48:03). This report covers similar activity from February through July 2023, consisting of continuing thermal activity and sulfur dioxide emissions, according to monthly reports from Instituto Nicaragüense de Estudios Territoriales (INETER) and satellite data.
Thermal activity has remained relatively consistent, according to a MIROVA (Middle InfraRed Observation of Volcanic Activity) analysis of MODIS satellite data, which showed occasional low-power thermal anomalies during the reporting period. There were six anomalies were detected during February, four during March, three during April, one during early June, and one during late July (figure 109). Infrared satellite imagery showed occasional hotspots in the Santiago crater’s lava lake throughout the reporting period (figure 110). The TROPOMI instrument on the Sentinel-5P satellite detected weak and small sulfur dioxide plumes that drifted generally W and SW on 8-9 February, 3-4, 13, and 18 March, 25 and 30 April, 11-12 May, 1-2 and 11 June, and 3 July.
Activity was relatively low throughout the reporting period. Seismic tremor was at 60 RSAM units during February and March. On 10 February FLIR temperature of the lava lake was measured from Santiago crater, recording values of 290°C, which was within the typical range of 200-500°C. INETER noted that the level of the lava lake had decreased compared to previous observations made during October 2022. On 15 March gas measurements were made with a Mobile DOAS technique, showing average sulfur dioxide values of 1,448 tons/day (t/d); the previous date that measurements were taken was on 14 November 2022 with a value of 1,222 t/d. On 25 April sulfur dioxide measurements decreased slightly to an average of 1,042 t/d. Temperature values of the lava lake from Santiago crater were 254°C on 26 April.
Seismic tremor was at 50 RSAM units during May and consisted of one volcano-tectonic (VT) event and 347 low-frequency (LF) events. On 5 May INETER recorded a temperature of the lava lake from Santiago crater of 270°C and reported that the level of the lava lake was lower compared to previous observations made in April. Sulfur dioxide measurements taken on 15 May were 1,438 t/d. During June and July, seismic tremor was maintained at 50 RSAM units and included one VT event and 221 LP-type events during June, and three LP-type events during July. On 28 June measurements of the lava lake had increased slightly to 315°C and the level of the lava lake continued to decrease. The average values of released sulfur dioxide emissions were 1,056 t/d on 19 June and 1,012 t/d on 14 July.
Information Contacts: Instituto Nicaragüense de Estudios Territoriales (INETER), Apartado Postal 2110, Managua, Nicaragua (URL: http://www.ineter.gob.ni/); MIROVA (Middle InfraRed Observation of Volcanic Activity), a collaborative project between the Universities of Turin and Florence (Italy) supported by the Centre for Volcanic Risk of the Italian Civil Protection Department (URL: http://www.mirovaweb.it/); NASA Global Sulfur Dioxide Monitoring Page, Atmospheric Chemistry and Dynamics Laboratory, NASA Goddard Space Flight Center (NASA/GSFC), 8800 Greenbelt Road, Goddard, Maryland, USA (URL: https://so2.gsfc.nasa.gov/); Copernicus Browser, Copernicus Data Space Ecosystem, European Space Agency (URL: https://dataspace.copernicus.eu/browser/).
2024: March
| April
2019: July
| October
2017: January
| May
2016: January
| February
| March
| April
| May
| August
| November
2015: December
2008: April
| June
| August
| September
| October
| November
| December
2007: April
| June
| December
2004: June
2003: October
2001: April
| May
On 18 April INETER reported that there continued to be no signs of lava-lake activity at the bottom of Masaya’s Santiago Crater after material from a landslide had covered the lake on 2 March. Small landslides continued to occur periodically, and one was shown in a webcam photo from 17 April. Continuous diffuse gas emissions rose from a vent on the crater floor and from a new vent located on the inner SW wall.
Source: Instituto Nicaragüense de Estudios Territoriales (INETER)
According to the U.S. Embassy in Nicaragua the Parque Nacional Volcán Masaya continued to be closed on 12 March due to an increased potential for explosive activity due to the blocking of the lava lake from landslide deposits in Santiago Crater. A satellite image from 13 March showed a slightly larger thermal anomaly on the NE crater floor compared to an 8 March image. According to a 13 March news article, INETER reported that landslides from the inner SW and NW crater walls were continuing. In a 14 March news article, a resident that lived near the volcano noted that the typical gas emissions seen before the 2 March landslide were no longer observed.
Sources: 100% Noticias; Copernicus; Onda Local; U.S. Embassy in Nicaragua
According to news articles, INETER reported that gas emissions increased at Masaya’s Santiago Crater in February, small landslides occurred from the inner NW crater wall, and the level of the lava lake had slightly increased. The report noted that SINAPRED recommended limits on the number of people and the time spent at the viewing area at the crater rim. A larger landslide occurred on 2 March and covered the active lava lake. A satellite image from 3 March showed a much smaller thermal anomaly on the crater floor compared to a 22 February image. According to an 8 March news article, INETER reported that small landslides continued to occur, originating from the inner SW and NW crater walls; a more notable landslide was recorded at 0900. The lava lakes remained covered with the deposits. Constant gas emissions rose from vents possibly on the crater floor and from fractures on the inner walls, though the gas flux was at lower rate, estimated to be 25-30 percent of the normal values. Seismicity was low with RSAM values around 23. The report noted that the Parque Nacional Volcán Masaya may partially open, though the public was warned to stay 800 m away from Santiago Crater.
Sources: Copernicus; La Prensa (Nicaragua); El 19 Digital
According to news reports, ash was emitted from Masaya on 15 October, causing very minor ashfall in Colonia 4 de Mayo, 6 km NW.
Source: La Jornada
INETER reported that at 1655 on 21 July a small explosion at Masaya’s Santiago Crater produced a gas-and-ash plume that drifted NW and W. A thin layer of ash was deposited near the volcano and in surrounding communities downwind, including San Ignacio, Panamá, and Arenal. During field visits during 21-22 July, INETER volcanologists confirmed that the emissions had originated from a vent on the crater floor.
Source: Instituto Nicaragüense de Estudios Territoriales (INETER)
The Washington VAAC reported that on 13 May a west-drifting ash emission from Masaya was identified in satellite images and observed by a pilot.
Source: Washington Volcanic Ash Advisory Center (VAAC)
Based on satellite images, the Washington VAAC reported that on 21 January a possible emission from Masaya with minor ash content drifted almost 25 km NW.
Source: Washington Volcanic Ash Advisory Center (VAAC)
Based on analysis of satellite imagery, the Washington VAAC reported that on 5 January a gas, steam, and ash plume from Masaya drifted W.
Source: Washington Volcanic Ash Advisory Center (VAAC)
Based on webcam images, the Washington VAAC reported that a steam-and-gas plume from Masaya possibly contained some ash on 3 November.
Source: Washington Volcanic Ash Advisory Center (VAAC)
Based on analysis of satellite imagery, the Washington VAAC reported that on 28 August a gas plume with possible ash rose from Masaya to an altitude of 1.8 km (6,000 ft) a.s.l. and drifted over 45 km W.
Source: Washington Volcanic Ash Advisory Center (VAAC)
Based on analysis of satellite imagery, the Washington VAAC reported that on 15 August a possible ash plume from Masaya rose to an altitude of 1.8 km (6,000 ft) a.s.l. and drifted NW. Elevated seismicity and a thermal anomaly detected in satellite images indicated increased activity. In a report posted later that day the Washington VAAC noted that the webcam recorded minor ash emissions.
Source: Washington Volcanic Ash Advisory Center (VAAC)
INETER reported that during 18-19 May RSAM values at Masaya fluctuated between 300 and 700 units which are low-to-moderate values. The lava lake in Santiago Crater continued to strongly circulate and the vent widened through 24 May.
Source: Instituto Nicaragüense de Estudios Territoriales (INETER)
INETER reported that between 1700 and 2400 on 3 May volcanic tremor at Masaya increased; RSAM values spiked at 1,000 units and then dropped to 250. Gas emissions at Santiago crater were at low-to-moderate levels, and the lava lake continued to strongly circulate. On 5 May RSAM values fluctuated between 250 and 500 units which are low-to-moderate values.
Source: Instituto Nicaragüense de Estudios Territoriales (INETER)
INETER reported that between 1700 and 2400 on 3 May volcanic tremor at Masaya increased; RSAM values spiked at 1,000 units and then dropped to 250. Gas emissions at Santiago crater were at low-to-moderate levels, and the lava lake continued to strongly circulate. On 5 May RSAM values fluctuated between 250 and 500 units, which are low-to-moderate values.
Source: Instituto Nicaragüense de Estudios Territoriales (INETER)
INETER reported that during 27 April-3 May gas emissions at Masaya's Santiago crater were at low-to-moderate levels. Seismic tremor decreased though continued to fluctuate between low to moderate levels. The lava lake continued to strongly circulate.
Source: Instituto Nicaragüense de Estudios Territoriales (INETER)
INETER reported that during 20-23 April gas emissions at Masaya's Santiago crater were at low-to-moderate levels and RSAM values were at moderate-to-high levels. On 22 April the level of the lava lake decreased, though strong lake circulation was reported on 23 April.
Source: Instituto Nicaragüense de Estudios Territoriales (INETER)
INETER reported that during 6-12 April the lava lake on the floor of Masaya's Santiago crater remained visible. RSAM values were at high levels and gas emissions were low.
Source: Instituto Nicaragüense de Estudios Territoriales (INETER)
On 30 March INETER reported that the lava lake rose in Masaya's Santiago crater and several landslide deposits from the precious few days were visible in the NE crater. RSAM values were at moderate-to-high levels. On 4 April SINAPRED noted that tremor continued and the widening of the vent in the SE part of the crater persisted.
Sources: Instituto Nicaragüense de Estudios Territoriales (INETER); Sistema Nacional para la Prevención, Mitigación y Atención de Desastres (SINAPRED)
According to a SINAPRED report on 28 March INETER noted that lava-lake activity at Masaya's Santiago crater was intense and the craters continued to gradually widen. Emissions were at low levels.
Source: Sistema Nacional para la Prevención, Mitigación y Atención de Desastres (SINAPRED)
INETER reported that on 3 March the lava lake on the SW floor of Masaya's Santiago crater was very active. Volcanic tremor remained high and RSAM values were at high to very high levels.
Source: Instituto Nicaragüense de Estudios Territoriales (INETER)
INETER reported that the lava lakes in three vents on the floor of Masaya's Santiago crater were active during 20 February-1 March. Volcanic tremor remained high and RSAM values were at high to very high levels. On 23 February small explosions ejected spatter onto the crater floor. During fieldwork volcanologists observed active lava lakes in all three vents on the crater floor, and noted that the inner walls of the crater were being eroded due to the lava lake. A new vent was forming on the SE part of the crater floor. During a second visit on 24 February INETER staff noted that the vents had become larger due to landslides on the crater walls. Small streams of lava sporadically originated from the NE vent. By 1 March the two vents in the SW part of the crater had almost merged.
Source: Instituto Nicaragüense de Estudios Territoriales (INETER)
On 17 February INETER reported that the lava lake on the floor of Masaya's Santiago crater remained visible. RSAM values were at high levels and gas emissions were low.
Source: Instituto Nicaragüense de Estudios Territoriales (INETER)
During 10-11 February sulfur dioxide emissions at Masaya rose to high levels (1,500 tons per day), and RSAM values were at moderately-high levels due to higher levels of volcanic tremor. This activity coincided with an increase in the size of the lava lake. Gas emissions were at moderate and low levels on 12 and 16 February, respectively.
Source: Instituto Nicaragüense de Estudios Territoriales (INETER)
INETER reported that during 4-5 and 7-8 February volcanic tremor at Masaya was at high levels. On 8 February the lava lake in the vent on the SE part of the Santiago crater floor was partially visible.
Source: Instituto Nicaragüense de Estudios Territoriales (INETER)
INETER reported that on 27 January the two lava lakes in Masaya's Santiago crater were smaller and sound waves generated by the activity were at moderate levels. Emissions drifted W and SW. The next day emissions decreased and the lava lake in the SW vent was less visible. On 29 January both lava lakes were again prominent, and a third vent opened in the SE part of the crater floor.
Source: Instituto Nicaragüense de Estudios Territoriales (INETER)
INETER reported that during 20-22 January the lava lake in Masaya's Santiago crater continued to be active. Abundant gas emissions rose 350 m above the crater rim on 20 January, and an increase in sound waves from the lava-lake activity was reported. During a field visit that same day, volcanologists noted that the lava lake in the vent on the S part of the crater floor had risen, and that a vent on the NE part of the floor was incandescent. During 21-22 January small gas explosions sounded like gunshots.
Source: Instituto Nicaragüense de Estudios Territoriales (INETER)
INETER reported that the lava lake in Masaya's Santiago crater continued to be active during 13-18 January. RSAM values indicated low to moderate seismicity.
Source: Instituto Nicaragüense de Estudios Territoriales (INETER)
INETER reported that during 6-8 January the lava lake at Masaya was observed in satellite images and sloshing sounds were noted. Gas emissions rose as high as 400 m above the crater and drifted W and SW. On 8 January very small explosions ejected tephra onto the crater.
Source: Instituto Nicaragüense de Estudios Territoriales (INETER)
INETER reported that rumbling and shock waves from small gas explosions at Masaya's Santiago Crater were reported during 15-17 December. Scientists conducting field work on 18 December observed that the crater hosting a lava lake had widened. Sounds from the volcano were louder and sulfur dioxide emissions had increased. During 19-20 December spatter from the lava lake was ejected from the vent and landed a few meters away on the crater floor. RSAM levels were stable at low-to-moderate levels.
Source: Instituto Nicaragüense de Estudios Territoriales (INETER)
INETER reported that during 11-12 December a lava lake formed in Masaya's Santiago Crater, small explosions were recorded, and rumbling was heard.
Source: Instituto Nicaragüense de Estudios Territoriales (INETER)
Based on analysis of satellite imagery, the Washington VAAC reported that on 17 December a gas plume with possible ash rose to altitudes of 5.3-6.1 km (17,500-20,000 ft) a.s.l.
Source: Washington Volcanic Ash Advisory Center (VAAC)
Based on analysis of satellite imagery, the Washington VAAC reported that on 2 December a plume possibly containing some ash drifted less than 20 km SW.
Source: Washington Volcanic Ash Advisory Center (VAAC)
Based on analysis of satellite imagery, the Washington VAAC reported that on 4 and 5 November possible diffuse ash and steam plumes from Masaya drifted SW and S.
Source: Washington Volcanic Ash Advisory Center (VAAC)
Based on pilot observations, the Washington VAAC reported that on 9 October an ash plume from Masaya rose to an altitude of 4.6 km (15,000 ft) and drifted NNE.
Source: Washington Volcanic Ash Advisory Center (VAAC)
Based on analysis of satellite imagery, the Washington VAAC reported that plumes emitted from Masaya on 10 and 12 September possibly contained ash. Plumes drifted ENE on 10 September.
Source: Washington Volcanic Ash Advisory Center (VAAC)
Based on analysis of satellite imagery, the Washington VAAC reported that a diffuse steam plume from Masaya drifted WSW on 12 August and a gas plume was detected on 18 August. Both plumes possibly contained ash.
Source: Washington Volcanic Ash Advisory Center (VAAC)
INETER reported that on 18 June, an explosion from Masaya produced an ash-and-gas plume. Local people felt the explosion and reported that the plume was dark in color.
Source: Instituto Nicaragüense de Estudios Territoriales (INETER)
Based on observations of satellite imagery and pilot observations, the Washington VAAC reported that an ash plume from Masaya rose to an altitude of 2.1 km (7,000 ft) a.s.l. and drifted SW on 29 April.
Source: Washington Volcanic Ash Advisory Center (VAAC)
Based on observations of satellite imagery, the Washington VAAC reported that a small and diffuse plume from Masaya drifted SW on 24 December. Changes in seismic signals correlated with the emission. The plume possibly contained ash.
Source: Washington Volcanic Ash Advisory Center (VAAC)
The Washington VAAC reported that a plume from Masaya composed of little to no ash was visible on satellite imagery on 12 June.
Source: Washington Volcanic Ash Advisory Center (VAAC)
The Washington VAAC reported a plume from Masaya composed of little to no ash was visible on satellite imagery on 9 June drifting W.
Source: Washington Volcanic Ash Advisory Center (VAAC)
The Washington VAAC reported a steam plume from Masaya, visible on satellite imagery and a web camera, drifted WSW on 26 April.
Source: Washington Volcanic Ash Advisory Center (VAAC)
On 4 July at 0615, a narrow plume of steam and/or ash from Masaya was visible on satellite imagery extending to the SW. By 0715 the plume extended ~12 km from the summit.
Source: Washington Volcanic Ash Advisory Center (VAAC)
A pilot reported seeing an eruption cloud from Masaya on 4 October at 0731 at a height of ~4.6 km a.s.l. Satellite imagery showed a white plume emanating from the volcano, but there were no indications of ash, suggesting that the plume was composed mainly of gas and steam.
Source: Washington Volcanic Ash Advisory Center (VAAC)
The Washington VAAC reported that Masaya may have erupted on 23 May at ~1300. Ground observations from the capital city of Managua, 20 km NW of the volcano, indicated that there was a reduction in visibility to the SE of the city due to volcanic "smoke" and steam. The presence of the ash cloud could not be confirmed on satellite imagery due to thunderstorms in the area.
Source: Washington Volcanic Ash Advisory Center (VAAC)
INETER personnel reported that volcanic activity at Masaya decreased following the 23 April explosion. Small explosions were observed on 24 and 25 April, but by 27 April only the continuous emission of gas at normal levels was observed with few episodes of strong degassing. Likewise, after the 23 April explosion the level of SO2 emission decreased and normal levels of seismic activity were recorded. INETER warned that further explosions may occur that could affect areas near the crater (within ~500 m).
A tourist at the scene during the 23 April explosion stated that injuries were more serious than was reported either here or in news accounts. Over 100 tourists were near the crater when the explosion occurred, including infants and elderly persons. At least 15 people sustained injuries (bruises and cuts) and one person suffered a broken arm.
Source: Instituto Nicaragüense de Estudios Territoriales (INETER)
At 1426 on 23 April a small explosion at Masaya's Santiago crater lasted for ~2 minutes and occurred in three phases. During the first phase volcanic gas under high pressure was explosively released and created a new vent in the bottom of Santiago crater. The eruption sent rock fragments up to 60 cm in diameter as far as 500 m from the crater. Several vehicles parked at a visitors platform near the crater were damaged by the ejecta and one person suffered minor injuries. During the second and third phases a mixture of hot volcanic gas, pieces of lava, and ash ignited dry vegetation near the crater. INETER personnel who monitored the seismic activity before the eruption and scientists from Cambridge University who were working in the crater one hour before the eruption did not notice any unusual activity at the volcano. INETER personnel monitored the volcano after the eruption and found that several small explosions, gas outbreaks, and minor collapses of the crater wall occurred. They warned that further explosions may occur that could affect areas near the crater (within ~500 m).
Sources: Instituto Nicaragüense de Estudios Territoriales (INETER); Associated Press
Reports are organized chronologically and indexed below by Month/Year (Publication Volume:Number), and include a one-line summary. Click on the index link or scroll down to read the reports.
Minor explosions and lava emission from central vent on old lava lake
Card 0924 (30 April 1970)
Jose Viramonte forwarded the following concerning activity at Santiago Crater. "On 4 and 5 April 1970, a little eruption from the central vent on the old lava lake could be observed. The eruption consisted of two of fluidic lava flows. There were many cracks in the surface of the old lava lake through which fumaroles and sublimates showed. Two major explosions were heard on 4 and 5 April. During our visit to the volcano, minor explosions took place, and strong fumarolic activity from the central vent was present as well."
Information Contacts: Jose Viramonte, Central American University, Managua.
Increasing lava lake activity at pit crater
The past four months have produced a gradual increase in the intensity of activity at Masaya. Fissures have appeared in the floor of Santiago Crater (figure 1) a collapse feature that formed, along with neighboring San Pedro crater, in 1858. The vent opening about 100 m below the rim of Santiago's pit crater has widened to about three times its size of a few months ago. The persistent lava lake inside the pit crater is usually not visible from Santiago's rim, but splashes of lava can occasionally be seen and minor amounts of lava clots are sometimes thrown from the vent. When the volcano was visited in late March, rare bursts of scoria reached the rim of the pit crater. Gas emission was strong, but has not seriously damaged nearby coffee trees.
Information Contacts: D. de Jerez, Parque Nacional Volcán Masaya; D. Shackelford, CA.
Active lava lake several times larger than in 1977
In early February, the plume appeared larger than any observed between 1968 and 1977. The diameter of the active lava lake in the pit crater was several times larger than in 1977 and the level of lava has dropped since then.
Information Contacts: R. Stoiber, S. Williams, and M. Bruzga, Dartmouth College.
Large plume; high SO2 output
Emission of a very large plume continued in June. Remote sensing of SO2 gas revealed high output rates. The gas plume allowed only brief glimpses of the small pit crater in which an active lava lake had been observed on many occasions since 1970. The lake was not seen during the brief clear moments, nor did a glow appear in photographs of the pit. The lake's characteristic roaring noise, if present, was masked by the sounds created by gas emission. There were no night observations at Masaya.
Information Contacts: R. Stoiber and S. Williams, Dartmouth College; M. Carr and J. Walker, Rutgers Univ.; A. Creusot, INETER.
Continued emission of a large gas plume
Emission of a very large gas plume has continued without interruption since fall, 1979. Remote sensing of SO2 revealed continued high level flux, with a 1,500-2,000 t/d average for the entire year. The hole through the surface of the lava lake was larger than in previous years and a great deal of sublimation was occurring around its edge. No lava or red glow was visible during daylight. Acid gas and rain continued to cause considerable damage downwind.
Information Contacts: R. Stoiber, S. Williams, H. R. Naslund, L. Malinconico, and M. Conrad, Dartmouth College; A. Aburto Q., D. Fajardo B., Instituto de Investigaciones Sísmicas.
Gas emission event continues
The gas emission event that began in fall 1979 continued with a steady release of very large amounts of SO2 in early 1981. Strong winds carried the gas plume onto populated areas at high elevations. A day of notable rockfall activity in the crater was followed for 1 day by a significantly larger rate of gas release.
Information Contacts: R. Stoiber and S. Williams, Dartmouth College; D. de Jerez, IRENA, Managua; D. Fajardo B., Instituto de Investigaciones Sísmicas.
Gas emission continues unabated; pit crater enlarges
"Scientists from Dartmouth College, IRENA, and the Instituto de Investigaciones Sísmicas report the following based on their continuing cooperative observation of Nicaraguan volcanoes.
"The fourth gas emission crisis of this century continued unabated. Extensive remote measurement of SO2 output (by COSPEC) has revealed a greater variability in emission rates than had previously been recognized (several hundred to several thousand t/d). The pit crater from which the gas is emitted continued to increase slowly in diameter and was strongly elongate in the NW-SE direction. Night observation of the activity was possible and confirmed the complete absence of any incandescence in the pit where lava was visible as recently as November 1978."
Information Contacts: S. Williams, R. Stoiber, Dartmouth College; D. de Jerez, IRENA; D. Fajardo B., Instituto de Investigaciones Sísmicas.
Large white vapor plume and high SO2 emission rates continue
"Emission of a very large white vapor plume continued in late November. SO2 emission rates, measured using COSPEC, were at the same high levels reported since February 1980. Acid rain and gas fumigation continued to cause problems downwind. Incandescence was seen in the bottom of the inner crater through the crust on the surface of Santiago Crater lava lake on 29 November. Park rangers reported that this incandescence has been visible since September 1981, but it was not noted by several observers who specifically looked for it while working around the crater 25-29 November. The roaring sound of gas emission (or possibly lava splashing) may have been louder than in March 1981."
Information Contacts: R. Stoiber, S. Williams, H.R. Naslund, J.B. Gemmell, D. Sussman, Dartmouth College; D. Fajardo B., Instituto de Investigaciones Sísmicas.
Small explosion heard followed by ashfall several kilometers south
"A small eruption occurred from the hole in Santiago Crater lava lake in the early evening of 16 December. No one witnessed the event, but people living S of the caldera reported hearing an explosion that was followed by ashfall several kilometers to the S. Highly vesiculated scoria fragments up to 20 cm in diameter fell as much as 200 m S of Santiago pit crater. As of late January, no subsequent explosive activity had been observed. A very large plume was still being continuously emitted. Incandescence was not readily visible during the day but was evident at night."
Information Contacts: R. Stoiber, S. Williams, Dartmouth College; D. Fajardo B., Instituto de Investigaciones Sísmicas.
Bright yellow incandescence seen at night
"Bright yellow incandescence was plainly visible at night in Santiago Crater in early March. No change had occurred except for a small collapse of the inner crater walls. The huge gas plume still poured out continuously."
Information Contacts: S. Williams and R. Stoiber, Dartmouth College; I. Menyailov and V. Shapar, IVP, Kamchatka; D. Fajardo B., INETER.
Strong, continuous gas emission; lava lake glow
Emission of acid gas from Santiago Crater was strong and continuous in early August. Incandescence from the small pit in Santiago Crater's lava lake was visible at night. The gas and associated acid rain affected vegetation downwind. An explosive gas emission event occurred 6 June at 1622. As of early August, seismographs recorded constant tremor.
Information Contacts: D. Fajardo B., INETER; R. Parnell, Jr., Dartmouth College.
Small explosion; strong vapor emission; seismicity
A small, brief, explosive eruption from the bottom of the lava lake in Santiago Crater occurred at dawn on 7 October. Tephra, including blocks with volumes to 55 cm3, fell 300 m SE and covered an area of 150,000 m2. The eruption killed a few trees and animals near the summit. Heat from the ejecta melted asphalt on a road, which was also slightly damaged by impact from larger tephra. Rumbling and explosion sounds were heard through the day. After the initial explosion, no additional tephra was ejected, but gas emission increased considerably, forming wide vapor columns that reached high altitudes.
The eruption was preceded by a change in the pattern of seismicity and accompanied by a magnitude 2.3 event lasting 3.7 seconds. After the eruption, small earthquakes occurred about every 6 minutes until 1100 on 8 October.
The 7 October eruption was larger than Masaya's previous explosion on 26 December 1981 (7:1). Strong vapor emission has made observations of the bottom of the crater difficult, obscuring any changes that may have occurred to the lava lake.
Information Contacts: G. Hodgson V., INETER.
Gas emission continues; incandescence within the inner crater
"The approximately 3-year gas emission crisis from Santiago Crater continued in late 1982. Total SO2 flux was apparently reduced from the very large levels reported before. Incandescence within the inner crater was dull red-orange, as compared to the brilliant orange observed in February, 1982. The 7 October, 1982 explosion threw out abundant, juvenile, highly vesiculated scoria, which was often flattened and oxidized against the ground surface. Numerous fragments of sublimate minerals torn from the lip of the inner crater were ejected with the juvenile scoria. No new explosions have thrown debris out of Santiago Crater but several gas bursts have been reported by Park guards."
Information Contacts: S. Williams, R. Stoiber, Dartmouth College; G. Hodgson V., D. Fajardo B., INETER.
Gas column and incandescence from lava lake
A strong gas column was observed. Through 9 March, incandescence was noted.
Information Contacts: D. Fajardo B., INETER.
Small ash eruptions
In December 1983, 4,993 microearthquakes were recorded at Masaya. Early that month, a very large gas column was continuing to emerge from Santiago Crater. A series of small ash eruptions occurred in April 1984. There was a small gas explosion on 23 January 1985, and another ash eruption occurred in April 1985.
Information Contacts: D. Fajardo B., INETER.
400 km plume sighted
An apparent volcanic plume roughly 400 km long was sighted in the Masaya area, extending W over the Pacific Ocean. Its exact source could not be clearly ascertained as Masaya was obscured by clouds. It was broader and appeared to be more dense then the San Cristóbal plume but was still relatively diffuse.
Information Contacts: C. Wood, NASA, Houston.
Gas column heights in 1985
Heights of the gas column above the rim of Santiago Crater (485 m above sea level) were measured on three occasions in 1985: 22 January (48 m), 17 June (78 m), and 21 October (78 m).
On 3 December, during re-entry from mission 61-B, Space Shuttle pilot Brian O'Connor took three 35-mm photographs (nos. 61B-12-020, 021, and 022) of Masaya. These showed a large white plume extending at least 25 km due W toward the Pacific Ocean.
Further Reference. Stoiber, R.E., Williams, S.N., and Huebert, B.J., 1986, Sulfur and Halogen Gases at Masaya Caldera Complex, Nicaragua: Total Flux and Variations with Time; JGR, v. 91, no. B12, p. 12215-12232.
Information Contacts: D. Fajardo B., INETER; C. Wood, M. Helfert, NASA, Houston.
Rock landslides and wall collapse in Santiago Crater
Intensive rock landslides began at midday on 12 November on the S and W sides of Santiago Crater. Part of the SW wall collapsed, extending Santiago into a section of Nindirí crater (figure 2). A floor collapse accompanied the slides. Two seismographs near the crater have recorded only seismicity produced by rockfalls down the 350-m crater wall.
Reactivation of two faults or fissure systems facilitated continued wall collapse. One prominent fault cuts NE/SW through the crater and the other extends NW around the edge of the crater. A substantial decrease in fumarolic activity followed the collapse with only several small fumaroles remaining along the NE/SW fault in the crater bottom.
Guatemalan newspapers reported that the Civil Defense staff closed access to Masaya Volcano National Park on 20 November. A government communique stated that the rock slides closed a fissure (possibly the pit crater) that formerly emitted large plumes and lava.
References. Stoiber, R.E., and Williams, S.N., 1986, Sulfur and halogen gases at Masaya Caldera Complex, Nicaragua: total flux and variations with time: JGR v. 91, no. B12, p. 12, 215-12, 231.
Mooser, F., Meyer-Abich, H., and McBirney, A., 1958, Catalogue of the active volcanoes of the world, Part VI, Central America, 146 p.
Information Contacts: Douglas Fajardo and Petr Hradecky, INETER; Prensa Libre newspaper, Guatemala City, Guatemala.
Collapse and small eruptions from inner crater
Santiago Crater has been in a very active degassing phase, the 4th in this century, since 1979. Such episodes have previously occurred at intervals of 20-25 years and lasted 4-10 years. Volcanic gases, primarily H2O, SO2, HCl, and CO2, have been emitted. The plain of Pacaya (Crucero), in the direction of predominant gas movement, has been most affected by the quantity of SO2, making raising of crops impossible in the area. Degassing phases and the presence of a lava lake are characteristic of Santiago Crater. It is evident that gases emerge along a fissure system, from faults that strike NW-SE.
The landslides from the walls and interior of Santiago Crater that began 12 November 1986 were facilitated by the descent of the magma column or a pressure change of part of the magma chamber below the volcano. The existence of a fracture zone in the crater also facilitated the breakup of its walls. These events were not preceded or accompanied by tremors. The landslide debris partly plugged the gas conduits, although during the next few days a successive resumption of degassing was observed. Thus, sudden transport of gases was expected to lead to a small eruption.
On 18 December 1986 there was a small collapse within the inner crater floor (figures 3 and 4), forming a circular hole and permitting a major flow of gases. No significant changes were observed in January and the beginning of February. On 15 February at 0020 a small eruption occurred in the circular hole. The pressure of lava erupted ash and blocks, the blocks falling back into the bottom of the vent.
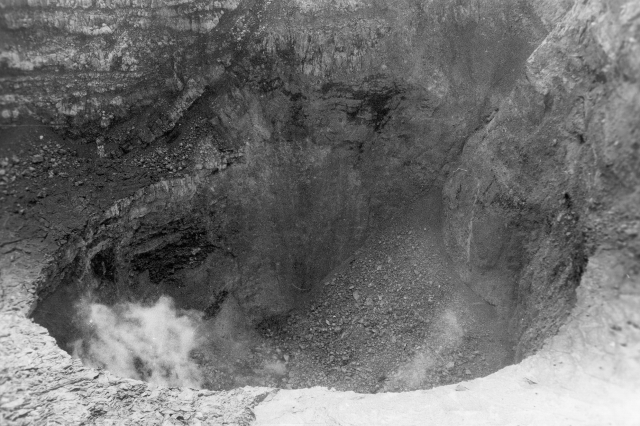 |
Figure 3. Photograph of Santiago's inner crater at Masaya, taken after the collapse events of late 1986 and early 1987. Courtesy of Douglas Fajardo. |
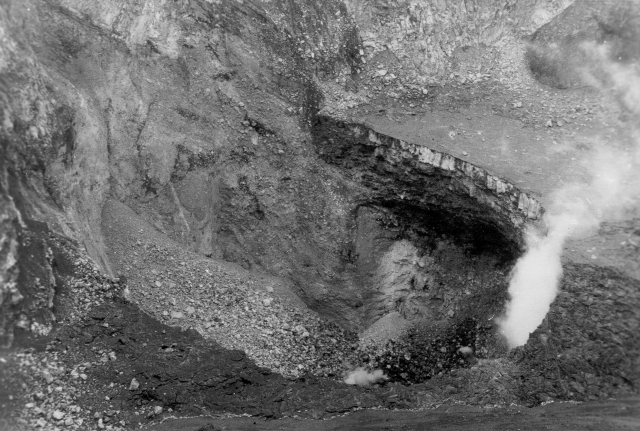 |
Figure 4. Another photograph of Santiago's inner crater at Masaya, taken after the collapse events of late 1986 and early 1987. Courtesy of Douglas Fajardo. |
On 20 February, a new hole, also in the bottom of the inner crater, formed by collapse, expelling a larger quantity of gases than from the circular vent. The gas column was persistent, rising above the rim of Santiago Crater. The gas that emerged from the new vent was darker because of its higher content of magmatic gases.
A larger increase in gases has been reported since 22 February. The circular vent continued to produce small eruptions. After each eruption, the vent was completely clear, without gases. At the beginning of April, incandescence began to be noted at night.
The inner crater is 180 m in diameter and 72 m deep.
Information Contacts: Douglas Fajardo B. and Petr Hradecky, INETER.
Vigorous degassing continues; small tephra eruptions and glow
When geologists visited the volcano on 25 December 1987 and 6 and 18 January 1988, two new, growing vents were visible (figure 5). The N vent was the hottest (table 1) and most active, emitting the majority of gases. By 18 January, the inner crater occupied half of Santiago's floor, while Santiago expanded westwards by collapse of the floor of neighboring Nindirí Crater. The NW side of Nindirí also seemed to be sagging along boundary faults. Gas output varied from vigorous (similar to 1985-86) to very little, perhaps because of periodic blockage of the two vents by landslides and rockfalls. One large gas burst was preceded by a loud roar and slightly raised temperatures.
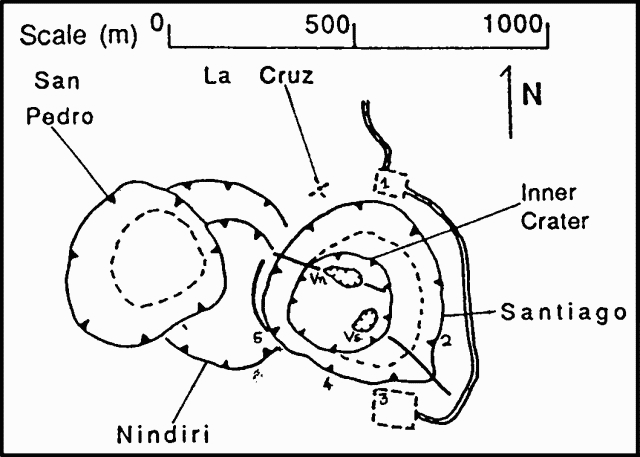 |
Figure 5. Sketch map of the craters of the Masaya complex as of 18 January 1988, showing the locations of temperature measurements in table 1. |
Table 1. Temperatures in Santiago Crater measured by infrared radiometer in late 1987 and early 1988. Surface brightness temperature was measured in the 8-14 µm range with emissivity set at 1. Locations of observation points are shown on figure 5.
| Date | 1 | 2 | 3(Vn) | 4(Vn) | 5 |
| 25 Dec 1987 | 35-40° | 54.6° | 66-125° | 100.5° | 80° |
| 06 Jan 1988 | 40° | -- | 110° | 121° | -- |
| 18 Jan 1988 | 36° | -- | 161° | 160° | -- |
Information Contacts: B. van Wyk de Vries, H. Rymer, and G. Brown, Open Univ; P. Hradecky and H. Taleno, INETER.
Lava lake develops in new collapse crater
Geologists observed increased steam emissions within Santiago's inner crater and incandescent fissures on its SE vent walls 12 February. Fracturing progressed gradually until 19 February at 1900, when collapse occurred beneath the SE vent floor. A lava lake, first observed late 20 February inside the SE vent, was about 5 m in diameter at 2200 and had increased to about 30 m by 0600 the next day (figure 6).
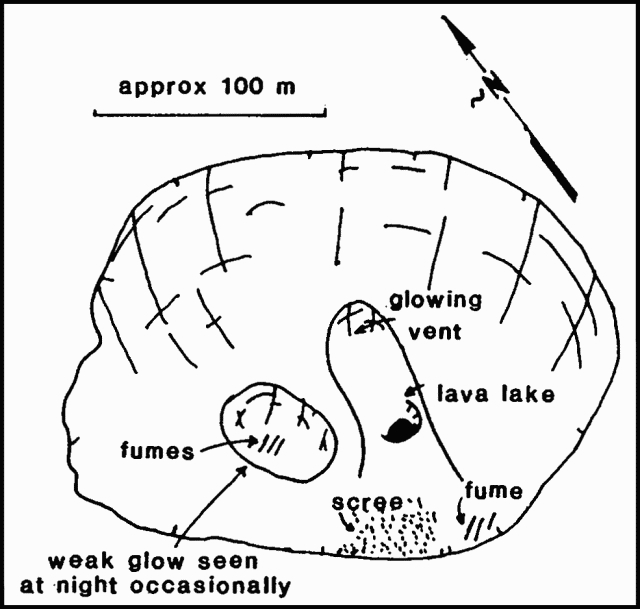 |
Figure 6. Sketch of the inside of Santiago Crater at Masaya based on a photograph taken on the SW crater rim looking NE, February 1989. Courtesy of D.A. Rothery. |
There was some evidence of strong explosive activity, possibly at 2000 on 20 February. Large amounts of Pelé's hair fell on Santiago crater's floor and on the volcano's SW slope. A large hole formed early 21 February in the N wall of the vent. Geologists observed continuous intense lava fountaining (40 m high) in the center of the lava lake that day and the lake level fluctuated by 5-8 m over periods of about 10 minutes. Fluctuations increased to 10-12 m over periods of about 6-8 minutes on 22 February between 2000 and 2400. The lava lake was crescent-shaped and had reached a maximum size of about 40 x 18 m on 22 February. Measurements on 26 February showed the new lava lake to be 175 m below Santiago's crater floor. The lake area varied from hour to hour because of crusting, remelting, and collapse, averaging about 40 m2 28 February-7 March and never exceeding about 100 m2 during that period. Small Strombolian eruptions from the lake surface were frequent. The maximum recorded brightness temperature of the lake was 1,148°C (measured with a Minolta Cyclops 52 infrared thermometer, bandpass 0.8-1.1 µm, 0.33° field of view) during a sustained fountaining event that ejected spatter to ~20 m height. Maximum brightness temperatures for other fountains generally ranged from 1,048° to 1,094°C.
A new vent appeared 23 February in the N corner of the lava lake and exhibited intermittent Strombolian activity. A vent in that vicinity ("glowing vent" in figure 6) had a brightness temperature of 940°C on 28 February, although lava was not visible within it. On 25 and 26 February, small lava flows were slowly extruded from the area between the new vent and the lava lake. Minor amounts of tephra were discharged from the same area on 28 February. Above and west of the lava lake, a third vent that widened by collapse and glowed weakly was the site of considerable degassing but ejected no tephra. Since 20 February, continuous glow and intermittent Strombolian activity inside the 30-m-wide SW vent have suggested the presence of another small lava lake.
Pelé's hair found near the S and SW rims on 1 and 4 March was probably erupted the previous week. Sounds similar to pistol shots were frequently heard from the direction of the active region. A continuously recording seismic station near the summit had registered normal levels of volcanic tremor before the eruptive episodes 19 and 20 February. Beginning 21 February, continuous, high-amplitude, low-frequency tremor was detected.
The last surface lava lake at Masaya was reported in June 1974 and remained continuously visible until January 1978 (3:04). Intermittent glow and deep roaring sounds have been noted since November 1986, when collapse enlarged the crater to 150 m in diameter and 85 m depth (11:11). A small eruption occurred from the inner crater in February 1987 (12:05) and collapse formed 3 small vents in March, June, and December 1987. By January 1988, the inner crater occupied half of Santiago's crater floor (13:01).
Information Contacts: Alain Creusot, Dept of Volcanology, Instituto Nicaraguense de Energía, Managua, Nicaragua; C. Oppenheimer and D. Rothery, Open Univ; B. van Vyk de Vries, O. Castellon, and L. Urbina, INETER.
Lava lake drains; rockslides; gas emission
A local newspaper (the Barricada, citing Alain Creusot) reported that on 7 March, the level of the active lava lake in Santiago's crater had dropped considerably (since late February). Spatter was occasionally ejected outside the vent. The lake apparently drained on 9 March. Geologists visited the crater on 14 March and measured a temperature of 76.6°C on the surface of the frozen lake (all reported temperatures were measured by an 8-14 micrometer bandpass infrared thermometer from a distance of about 300 m unless otherwise stated). The two incandescent vents that first appeared on 23 February (14:02) were still present in the lake's N corner. The temperature of the hottest glowing vent was 667°C. On 16 and 18 March, fumes collected in the crater and limited observations. By 28 March, debris from rockslides on the SW inner wall of the crater had covered the site of the former lake, at least 175 m below the floor of Santiago Crater. Gas emission was strong. The two incandescent vents (maximum surface temperature 607°C) remained visible at night. On 12 April, the frequency of rockslides (audible about every 5 minutes) had increased significantly. Most occurred on the SW inner wall of the crater and many lasted for minutes. When geologists drove past Masaya on 18 April the amount of fuming appeared to have dramatically decreased.
Information Contacts: C. Oppenheimer, Open Univ.
Lava lake freezes; small explosions
The February-March lava lake in Santiago Crater (14:02) probably froze over in early March, and degassing from the lake vent had apparently ceased by 12 March. Other vents remained open through April, with occasional strong degassing episodes. Beginning around 11 May, collapses from the W, S, and N sides of the main crater blocked all vents. Little, if any, gas emission was evident until 22 May when park rangers reported more collapses and a plume visible from the Masaya road (6 km from the crater).
On 25 May, geologists found fresh scoria and lithic fragments scattered from Plaza Sapper to the San Pedro crater (figure 7, top). Ten-cm fragments were found to 20 m from the edge of Santiago, 5-cm fragments to 50 m, and fragments <2 cm were found farther away (90% <1 cm). All tephra was highly vesicular, often with smooth surfaces indicating solidification in flight. Many Pelé's tears were found. The fragments were concentrated in small areas, suggesting a number of discrete explosions. Tephra from the explosions rose an estimated 100-300 m above the crater. Most fragments were glassy basalt with occasional small (1-3 mm) fresh plagioclase. Lithic fragments were porphyritic basalts with 10% plagioclase and some were slightly altered hydrothermally.
 |
Figure 7. Sketch of the summit complex at Masaya, May-June 1989 (top) and Santiago Crater, 3 June 1989 (bottom). Courtesy of B. van Wyk de Vries and O. Castellón. |
A 3 June visit revealed small amounts of fresh scoria up to 5 cm in diameter as far as 50 m SW of the crater. The tephra was probably erupted on 2 June when inhabitants reported a "brown cloud". Crater geometry was similar to that in February. The lava lake vent and the "cannon" (3rd vent in 14:02) were blocked by collapse debris, but vent No. 2 (glowing vent in 14:02) had enlarged and was thought to be the source of the eruptions. On 25 May the vent was oval and about 4 m across, oriented vertically, rather than horizontally as in February. On the 26th it had enlarged by 1 m, and by 3 June it was 7 x 3 m and rectangular. There appeared to be a considerably larger chamber beneath the vent. The cannon (3rd) deepened slightly between 25 May and 3 June.
Periodic fumarolic activity on the W wall and from a fault on the N side (figure 7, bottom) was also observed. Weak fumaroles along the trend of the fault (on the Nindirí crater floor below La Cruz) had temperatures <45°C. Fumarolic activity decreased from May to June.
Information Contacts: B. van Wyk de Vries and O. Castellón, INETER.
Fumarolic activity
During fieldwork on 17 and 25 April, gas emission in Santiago Crater was limited to a few patches of weakly fuming ground within the inner crater, below the level of the frozen 1965 lava lake. The highest temperature measured on the fuming ground (using an 8-14 µm infrared thermometer from the crater rim) was 50.7°C. Small rockfalls from the inner crater walls were frequently audible. Much of the floor of the innermost crater was covered by debris and the "cannon" vent (first reported in February 1989; 14:02) was no longer visible. However, an opening had formed at the site of a former incandescent vent N of the February-March 1989 lava lake. No incandescence was evident in the crater after dusk on 25 April. Tangential fissures crossing the S rim parking area and nearby had widened in recent weeks.
Information Contacts: C. Oppenheimer, Open Univ; B. van Wyk de Vries, INETER.
Rockfall activity declines after November 1989 collapse
"Growth of Santiago crater has slowed since the November 1989 collapse when 50,000 m3 of rock fell from the S (Plaza Sapper) side (figure 8). The overlook with protective wall and part of the parking lot were lost in this event. Cracks continue to open and widen on Plaza Sapper, but rockfalls decreased to negligible levels by April 1990. Seismic activity has been recorded at a station in the Masaya Volcano Museum, 5 km from the crater, and occasionally at a station in Nindirí crater, but overall, very little activity was detected. The tremor associated with the February 1989 lava lake and subsequent Strombolian activity (May-June 1989) was absent. Three samples of the 1989 ejecta were analysed at the Open Univ (UK); all are typical Masaya tholeiitic basalt, similar to that of 1965 and 1772. Fumarolic activity in Santiago is restricted to a few points surrounded by damp ground. Small areas of yellow sulfur deposits have built up locally. Vegetation has started to colonize the Nindirí and San Pedro craters, and some small grass patches have been established on the 1965 lava lake in Santiago.
"A water well that was drilled 3 years ago, about 5 km N of the caldera (near the village of Veracruz) on the volcanic alignment extending from the volcano, was reported to have started to produce hot (almost boiling) water. Geologists from INETER are investigating the cause of this phenomenon. Two maar craters lie 1 km NE of the well."
Information Contacts: B. van Wyk de Vries, O. Castellón, A. Murales, and V. Tenorio, INETER.
Weak gas emission; acid gas and rain effects diminish
During a 26 April visit to Santiago Crater, extremely weak emissions were observed from two or 3 small, quiet fumaroles at the base of the talus in the inner crater and up the W wall (toward Nindirí Crater). COSPEC measurements indicated an SO2 flux of <10 metric tons/day (t/d), compared to 1500-2000 t/d during lava lake activity in 1980 (SEAN 05:12). Simultaneous use of SO2 and HCl INTERSCAN instruments at the crater indicated HCl concentrations several times greater than SO2. A drive on the WSW (downwind) ridge, the site of extensive acid gas deposition and acid rain during the early 1980's (SEAN 05:12, 06:12, and 07:08), showed that vegetation had recovered somewhat; the same stark deforested appearance was still evident, but low shrubs were healthier and larger.
Information Contacts: S. Williams, Arizona State Univ; Martha Navarro C. and Silvia Arguello G., INETER.
Crater walls stabilizing
"Masaya's Santiago crater, visited on 7 and 13-14 January, contains a few weak fumaroles on the rim of the 1989 vents and on the wall adjoining the Nindirí crater. The crater walls have stabilized since the 1989/90 collapses, and there is now little rockfall activity. Vegetation is beginning to colonize the crater walls."
Information Contacts: Andrea Borgia, Instituto Nazionale di Geofisica, via di Vigna Murata 605, 00143 Roma, Italy; B. van Wyk de Vries, Open Univ; Peter J. Baxter, Dept of Community Medicine, Fenner's, Gresham Road, Cambridge, England.
New lava lake appears
A lava lake reappeared in the bottom of Santiago crater in late June for the first time in 3 years, but seismicity has not increased. The temporary network of seismic stations intermittently installed around the summit area has documented a progressive decline in seismicity since late 1989. Epicenters have mainly been located below the N and NE flanks of the volcano. Since 1989 the number of locatable events decreased to about 1-2/week, with focal depths of 400-800 m. In late 1991 and 1992, maximum fumarole temperatures of 380-400°C were measured during expeditions into the 200-m-deep inner crater. Fumaroles were located just above the previous lava lake, active February-March 1989 (SEAN 14:02, 14:04, and 14:06) and covered by landslides in 1990 (SEAN 15:04). A part of the S crater wall collapsed in November 1989 (SEAN 16:02), dropping 50,000 m3 of rock into the crater. Activity in January 1993 consisted of a few weak fumaroles on the rim of the 1989 vents and on the wall adjoining the Nindirí crater.
An increase in SO2 emission was detected in late May 1993, and 3 seismometers were deployed around the crater in early June. An expedition 8 June installed one seismic station on the crater floor 100 m from the N rim. That same day, a significant increase in the rate of gas release was observed, with temperatures estimated at 400-500°C. Park rangers reported new incandescence in the bottom of the crater the evening of 16 June. Another descent to the crater floor on 20 June revealed a 7-8 m diameter vent with liquid lava splashing at a depth of about 30-40 m; small lava fragments were occasionally ejected. The vent slowly increased in diameter through the end of June, and was elongated NW-SE.
Information Contacts: Alain Creusot, Instituto Nicaraguense de Energía, Managua, Nicaragua.
Small ash eruption precedes formation of lava lake; fumarole temperatures rise
In the last week of March 1993 a fissure was observed to open in the bottom of Santiago crater, with no associated seismic activity. Enlargement of the fissure to 10 m in diameter was accompanied by high-pressure gas emissions. In the first week of April, an earthquake swarm occurred approximately 3 km E of Masaya City; the largest event was M 2.7. At the same time, minor microearthquake activity was registered beneath Santiago crater (1-2 events/day). On 16 June a small ash eruption in the late afternoon lasted for about 13 minutes. That same night incandescence was observed in the bottom of the Santiago crater (BGVN 18:06).
A 7-8 m diameter vent with liquid lava splashing at a depth of about 30-40 m was present on 20 June according to a report by Alain Creusot (BGVN 18:06). An additional report from Creusot indicates that an incandescent hole that had opened above the lava lake was 1-2 m larger in late July. A significant increase in gas emission has maintained a plume rising from the crater. As of 28 June, the temperature of gas emissions from the crater had increased. INETER reported that fumarole temperatures have generally been around 50°C since the beginning of the year, but have now increased to almost 250°C. Seismicity has generally remained low, with a slight increase on 4 July.
Information Contacts: Oscar Leonel Urbina, Departamento de Volcanes, INETER; Alain Creusot, Instituto Nicaraguense de Energía, Managua, Nicaragua.
Incandescence in lava lake
Bright yellow incandescence was observed on the evening of 31 August through a window in the cooling lava lake at the base of Santiago Crater. Jetting sounds made by escaping gases could be heard from the crater rim. New incandescence in the bottom of the crater, reported on 16 June (BGVN 18:06 and 18:07), was the first since February-March 1989 (14:2, 4, and 6). Fumaroles located on the narrow plateau between Santiago and Masaya craters were passively degassing, and their temperatures ranged from 45-65°C.
Information Contacts: M. Conway and A. Macfarlane, FIU; Charles Connor, CNWA Bldg. 168, Southwest Research Institute, 6220 Culebra Road, San Antonio, TX 78228-0510; Oscar Leonel Urbina and C. Lugo, INETER.
Incandescent hole in lava lake remains active
Scientists approached the incandescent window of the lava lake in Santiago's inner crater on 19 October to sample lava ejected during an episode of increased explosive activity at the beginning of October. The window was 15 m in diameter and 50 m deep with lava splashing every 10-15 seconds. Bright yellow incandescence was reported on 31 August and was first observed on 16 June of this year (BGVN 18:06, 18:07, and 18:09).
Information Contacts: Alain Creusot, Instituto Nicaraguense de Energía, Managua, Nicaragua.
Incandescence visible in daylight; small eruptions
When visited by a team of scientists from INETER and FIU during 1000-1100 on 1 March 1994, Masaya exhibited two adjacent incandescent openings in the cooling lava lake. The 4- to 7-m-diameter openings appeared at the base of the N wall of a smaller crater within Santiago crater. In September 1993 incandescence was only visible at a single opening, and only at night. According to Canadian Missionaries living in Leon, the second incandescent opening was exposed in mid-February 1994. Several tourists reported seeing ash ejected from the incandescent openings on several occasions, an event documented by a second research team later in the month (see below).
INETER-FIU researchers saw a "diffuse, white, sulfur-rich plume . . . punctuated every several minutes by stronger, short-lived (tens of seconds) pulses of gas. The pulses were accompanied by jetting sounds that were easily heard on the S rim." They also noted a mantle of fresh black ash on the crater floor immediately adjacent to the incandescent openings.
During the period 7-11 March 1994, a research team from Open Univ (OU) revisited a 21 km leveling network established in February 1993. They resurveyed the network using precise leveling to find the vertical deformation. Errors in this portion of their survey were several millimeters. The OU team found that relative to stations 5 km E on the shore of Laguna de Masaya, the summit had shifted 2-3 cm upwards. A zone of uplift trended NE across the summit; the greatest uplift occurred near the caldera wall 2 km SW of the summit.
On 7 March at 1100 the OU team noted that the two incandescent openings remained separate, but by 1800 they had merged as the division between them collapsed. On 11 March the team tied this incandescent opening into their survey net. They used electronic distance measuring (EDM) instrumentation, shooting with double bearings, to determined the elevation of the opening as 233 m (error of 0.2 m). This elevation is equivalent to 294 m below the level of the car parking area on the S rim (150-200 m above sea level). The vent that contained the incandescent openings was elongate N-S, about 12-m long, and at least several meters deep.
Since their previous visit in February 1993, the OU team reported increased summit activity, including "strong smell of SO2" and a "fainter whiff of HCl at times." One team member felt that there were more fumaroles in Santiago crater and also along the uppermost arcuate fracture on the N side of Nindirí crater than in recent years. On 31 August 1993 fumaroles were found between Santiago and Masaya craters (BGVN 18:09), but during March 1994 they were absent. From observations of activity, OU researchers suggested that the top of the magma body is perhaps 30-80 m below the level of the vent.
During the interval 7-22 March the OU team reported that incandescence remained visible, ". . . glowing bright red even in broad daylight." Audible gas exhalations were monitored 16 times during this interval: they averaged 30-40 puffs/minute. Bombs were typically ejected slightly less than once per minute, but each explosion produced 1-10 bombs. They landed at most about 30 m from the vent, to the WSW, W, or NW. Maximum bomb diameter was 50 cm. The blanket of tephra in this quadrant grew noticeably during the observation period.
Even though in September 1993 only one incandescent opening was visible, a short time later, in early October 1993, Masaya underwent an episode of increased explosive activity that included lava splashing every 10-15 seconds (BGVN 18:10). Some previous Masaya reports described fluctuations in the color of incandescent openings (for example in 1982, SEAN 07:11).
In addition to their geological observations, the OU team also remarked that "Hundreds of parrots, which had deserted the crater last year, have returned to nest in holes and crevices in the S walls of Santiago crater now that it is active again." In 1979 Masaya became Nicaragua's first National Park.
Information Contacts: Cristian Lugo, INETER; Michael Conway, Andrew Macfarlane, and Peter LaFemina, Florida International Univ (FIU); J. Murray, B. van Wyk de Vries, and A. Maciejewski, Open Univ.
Sulfur-rich plume and incandescent ejections from opening in lava lake
Scientists from FIU and INETER visited Masaya for about an hour on the afternoon of 26 May 1994 and noted that the two incandescent openings (5-7 m in diameter) in the cooling lava lake observed on 1 March near the N wall of Santiago crater (BGVN 19:03) had coalesced into a single opening 10-12 m long. A sulfur-rich plume was being emitted from the opening at a rate of several pulses/minute; the pulses were accompanied by jetting sounds easily heard from the S rim. Fresh, black ash covered the crater floor immediately SW of the opening. INETER scientists reported that small Strombolian explosions ejected incandescent material from the opening several times during May and June 1994.
Information Contacts: Peter C. La Femina, Michael Conway, and Andrew MacFarlane, FIU; Christian Lugo, INETER.
Temperatures and SO2 flux from incandescent opening continue rising
A red incandescent area that opened in the inner crater during mid-June 1993 remained active at least through June 1994. An unbroken gas plume has often been observed extending several kilometers from the volcano. Average fumarole temperatures, measured with an infrared pyrometer, began increasing in May 1993 from around 50°C to almost 250°C by July 1993 (figure 9 and 18:07). Fumarole temperatures slowly increased to almost 400°C by May 1994, when they suddenly increased again, reaching almost 600°C by the end of July 1994. Measurement of SO2 emissions at the summit were carried out using colorimetric and chemical techniques. An increase from background to ~5 mg/m3 was detected in June 1993 after the incandescent opening first appeared. SO2 increased to ~15 mg/m3 between July and August, and again increased sharply during September-November 1993 to ~30 mg/m3. Steady increases in the SO2 emission rate since then resulted in measurements of ~35 mg/m3 in May-July 1994.
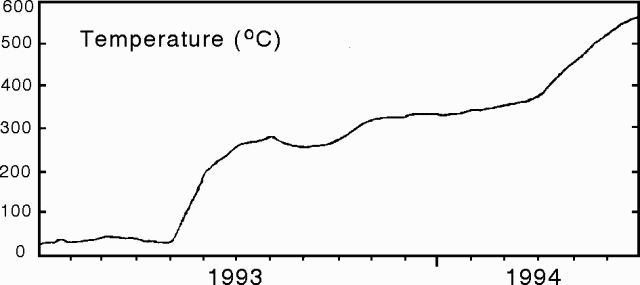 |
Figure 9. Average fumarole temperatures in the summit crater of Masaya, January 1993-July 1994. Courtesy of INETER. |
Information Contacts: H. Taleno, L. Urbina, C. Lugo, and O. Canales, INETER.
Red glow from vent on crater floor; gas emission
When observed during November, the vent in Santiago crater was the same shape as in April 1994. It was possible to see ~20 m down into the hole, which was 10-20 m wide. During daylight a red glow could be seen from the lip of the vent inwards, but no lava or ejecta were observed. Pulses of gas emission occurred every 3-5 seconds.
Information Contacts: B. van Wyk de Vries, Open Univ; Pedro Hernandez, INETER.
Incandescent vent in Santiago crater emitting large amounts of gas
Masaya was visited on 15-16 March by a joint team from the Open University, the Universite de Montreal, Reading University, and INETER. Large amounts of gas exiting a 5-m-wide vent at the bottom of Santiago crater formed a distinct plume clearly visible from the Managua airport. The vent was intensely incandescent, even during mid-day. Eight correlation spectrometer (COSPEC) traverses beneath the gas column on 16 March measured an SO2 flux of 600 ± 290 metric tons/day (t/d). These fluxes are similar to those measured during the degassing crisis of the early to mid-1980's (Stoiber and others, 1986). Microgravity measurements revealed a continued decline of the gravity field in the summit region since re-activation of the volcano in 1993 (BGVN 18:06). Systematic decreases of up to 160 microgals have been recorded during this time near the active crater.
Reference. Stoiber, R.E., Williams, S.N., and Huebert, B.J., 1986, Sulfur and halogen gases at Masaya caldera complex, Nicaragua: Total flux and variations with time: Journal of Geophysical Research, v. 91, p. 12,215-12,231.
Information Contacts: Hazel Rymer and Mark Davies, Department of Earth Sciences, The Open University, Milton Keynes MK7 6AA, United Kingdom; John Stix, Dora Knez, Glyn Williams-Jones, and Alexandre Beaulieu, Departement de Geologie, Universite de Montreal, Montreal, Quebec H3C 3J7, Canada; Nicki Stevens, Department of Geography, University of Reading, Reading RG2 2AB, United Kingdom; Martha Navarro and Pedro Perez, INETER, Apartado Postal 2110, Managua, Nicaragua.
Strombolian explosion; incandescent vent in Santiago crater; seismicity increases
A small Strombolian explosion on 5 December 1996 ejected blocks (<10 cm in diameter), ash, and some Pelee's hair. Some of the inner crater walls collapsed, partly closing the incandescent vent. Prior to this eruption the vent's gas temperature was 1,084°C; afterwards, it dropped to 360°C.
During three consecutive days in 1997, COSPEC SO2 fluxes varied as follows: on 12 February, 159 ± 73 metric tons/day (t/d) (1 sigma, n = 5); on 13 February, 363 ± 182 t/d (1 sigma, n = 6); on 14 February, 290 ± 65 t/d (1 sigma, n = 4). The 363 t/d figure is a minimum estimate since on the first 3 traverses the instrument went off the chosen recording scale indicating still larger values than reported.
A visit in March 1997 yielded COSPEC values of 300-400 t/d; these values were lower than those obtained during March 1996 (BGVN 21:04). Nightime observations of the active Santiago crater revealed that large amounts of incandescent gas were being released frequently through a conduit that had partially collapsed on 5 December 1996. As a result of the collapse, it was not possible to see incandescent magma during the night.
Seismicity increased since September 1996; in January 1997, 41 events (4 high- and 47 low-frequency) were recorded along with constant tremor. During 22 February-20 March, 18 events occurred, 15 of which were low-frequency and three high-frequency. Since November 1994 background levels of RSAM have varied between 12 and 16 RSAM units. Since mid-January, however, RSAM increased, fluctuating between 22 and 32 units.
In the crater area, gravity decreased steadily during 1993-95; it remained stable in 1996 and possibly increased a little in 1997.
A NE-trending fracture at the base of Comalito cone emitted gases reaching 68°C. In this same vicinity soil gas concentrations contained up to 25% CO2.
Information Contacts: Hazel Rymer and Mark Davies, Department of Earth Sciences, The Open University, Milton Keynes MK7 6AA, United Kingdom; John Stix, Dora Knez, Glyn Williams-Jones, and Alexandre Beaulieu, Departement de Geologie, Universite de Montreal, Montreal, Quebec H3C 3J7, Canada; Nicki Stevens, Department of Geography, University of Reading, Reading RG2 2AB, United Kingdom; Martha Navarro and Pedro Perez, INETER, Apartado Postal 2110, Managua, Nicaragua.
Stable and non-eruptive during May-June
Besides the strong degassing and high tremor, which are normal for this volcano, Masaya lacked signs of abnormal activity during May and June 1997.
Information Contacts: Wilfried Strauch, Department of Geophysics, and Marta Navarro C., Department of Volcanoes, Instituto Nicaragüense de Estudios Territoriales (INETER), P.O. Box 1761, Managua, Nicaragua.
Minor morphologic changes and fluctuating incandescence in May
"On 25 May, observers saw that the small active vent had grown by 30 m and had ceased to be incandescent. Large volumes of gas were still escaping and forming plumes that blew to the W. Masaya park guards reported a resumption of incandescence on 3 June. During the previous day, there was little wind and high humidity, conditions which allowed the gas to produce a sustained vertical column above the crater."
Information Contacts: Benjamin van Wyk de Vries, Department of Earth Sciences, The Open University, Milton Keynes MK7 6AA, United Kingdom (URL: http://www.open.ac.uk/science/environment-earth-ecosystems/).
Integrated scientific studies of the caldera area
Four teams of Canadian, British, and Nicaraguan volcanologists carried out studies of Masaya caldera during January-April and September 1998. The volcano was examined using correlation spectroscopy (COSPEC), microgravity, Open Path Fourier Transform Infrared spectroscopy (OP-FTIR), and soil-gas studies.
Vent degassing appeared to have increased significantly. COSPEC measurements during February-April 1998 showed SO2 flux varying from 680 t/d to a maximum of 5,580 t/d. Measurements made during the previous year (January-March 1997) showed more stable fluxes of approximately 380 t/d. Measurements in September 1998 showed flux levels varying from 320 to 1,420 t/d.
OP-FTIR measured from the Plaza Oviedo overlooking the "Santiago" pit crater showed consistent SO2/HCl and HCl/HF volume ratios of 2 and 7, respectively. Using the COSPEC-derived SO2 flux, scientists inferred HCl fluxes of 340 to 2,790 t/d and HF fluxes of 97 to 797 t/d.
CO2 soil-gas measurements at the foot of the Comalito cinder cone increased from 23 to 31.3% between March 1997 and February 1998. Fumarole temperatures also increased from 70 to 84°C during February 1998.
Microgravity surveys during March 1997-February 1998 showed a slight increase in gravity immediately beneath the Santiago pit crater. They also showed evidence (increased noise recorded on the meter) of significant seismic activity around the Santiago crater. Similar measurements acquired in September 1998 indicated increased seismic activity throughout the caldera.
Temperatures at the active vent, measured using a Cyclops infrared camera, ranged between 170 and 400°C. The higher measurements occurred when incandescence of the vent walls was visible. In March, a small fumarole emitting low levels of gas appeared, ~15 m from the active vent.
Information Contacts: Glyn Williams-Jones, Dave Rothery, Hazel Rymer, Peter Francis, and Lisa Boardman, Department of Earth Sciences, The Open University, Milton Keynes MK7 6AA, United Kingdom; Alexandre Beaulieu, Dany Harvey, Pierre Delmelle, Katie St-Amand, and John Stix, Département de Géologie, Université de Montréal, Montréal, Québec H3C 3J7, Canada; Mike Burton, Clive Oppenheimer, and Matthew Watson, Department of Geography, University of Cambridge, Downing Place, Cambridge, CB2 3EN, United Kingdom (URL: http://www.geog.cam.ac.uk/); Hélène Gaonac'h, Département des sciences de la Terre, Université du Québec - Montréal, Montréal, Québec H3C 3P8, Canada; Martha Navarro and Wilfried Strauch, INETER, Apartado Postal 2110, Managua, Nicaragua; Benjamin van Wyk de Vries, Departement des Sciences de la Terre, Universite Blaise Pascal, 63038 Clermont-Ferrand, France.
Continued degassing and marked gravity decreases; previously unreported small explosions
The present activity began in mid-1993 with the brief formation of a lava pond and gradual increase in degassing (BGVN 18:04 and 18:07). Small explosions in Santiago Crater on 17 November 1997 and 14 September 1998 ejected lava bombs up to 50 cm in diameter onto the western rim. Canadian, British and Nicaraguan scientists returned between February and March 1999 to continue the study of the degassing crisis (BGVN 23:09).
A gas plume was continuously emitted from a vent with a diameter of 15-20 m at the bottom of Santiago Crater. A characteristic sound, like the breaking of waves, was created by gas emission. Incandescence of the vent walls was visible only at night. Temperatures recorded at the vent with an infrared thermometer, 200-380°C, were highly dependent upon the opacity of the gas plume.
COSPEC measurements of SO2 revealed continued high flux, varying from 1,300 to 4,060 metric tons/day. Remote sensing of the gas plume composition using an open-path Fourier transform infrared spectrometer (OP-FTIR) in a variety of modes reveals a SO2/HCl volume ratio of about 2, comparable to that obtained in February-April 1998.
The OP-FTIR was also run simultaneously with direct plume sampling using a filter pack-collection technique at the summit and on the Llano Pacaya ridge, 15 km from Santiago Crater. Acid gases (CO2, SO2, H2S, HCl and HF) were passively collected from the crater rim using concentrated KOH solutions exposed to the atmosphere. These experiments should allow for a comparison between remote and direct sampling techniques and provide information on variations in plume composition as it disperses.
Fumigation of the land downwind from Santiago Crater continues to affect the local communities. SO2 plume dispersion and deposition was monitored with a large network of diffusion tubes and sulfation plates. Preliminary results indicate that dispersion of the plume is strongly influenced by local topography. Near-ground SO2 concentrations above 100 ppb were measured on the Llano Pacaya ridge in February-April 1999. These high values may indicate a serious local health hazard. Acid rain collected at the summit and about 7 km downwind on 15 March 1999 had pH values between 3.5 and 4.
Microgravity surveys between March 1997 and February 1999 appear to show a consistent decrease in gravity (up to 90 microgals) immediately beneath the Santiago pit crater. This decrease is of the same order as that measured between 1993 and 1994 at the start of the degassing crisis.
Information Contacts: Pierre Delmelle and John Stix, Département de Géologie, Université de Montréal, Montréal, Québec H3C 3J7, Canada; Glyn Williams-Jones, Dave Rothery, Hazel Rymer, Lisa Horrocks and Mike Burton, Department of Earth Sciences, The Open University, Milton Keynes MK7 6AA, United Kingdom; Peter Baxter, Department of Community Medicine, University of Cambridge, Cambridge CH1 2H8, United Kingdom; José Garcia Alavarez, Martha Navarro, and Wilfried Strauch, INETER, Apartado Postal 2110, Managua, Nicaragua.
Summary of activity; nearby M 5.4 earthquake at 1 km focal depth on 6 July
Since the last report on Masaya, of continued degassing and marked gravity decreases (BGVN 24:04), there have been sporadic reports about its activity, which are summarized below prior to discussion of a nearby M 5.4 earthquake on 6 July 2000.
Reports of ash-and-steam emissions. Between November 1999 and January 2000 there were several reports from the Washington VAAC of ash-and-steam emissions from Masaya. On 22 November 1999 the VAAC reported that GOES-8 imagery suggested that Masaya may have awakened. Satellite imagery showed activity at or very near Masaya, including a plume of ash or "smoke" moving to the WSW, and a hotspot that was visible for over two hours. At about 1600 the imagery suggested that an explosion may have occurred and by 1615 the resultant plume was at ~800 m (near Masaya's summit), and had been blown WSW.
On 22 December 1999 the Washington VAAC issued an ash advisory stating that a continuous low-level plume was being emitted from Masaya. Volcanic activity was confirmed by INETER who noted that seismic activity was consistent with ash emissions. The cloud was ~2 km in altitude and was blown to the WSW.
On 18 January 2000 the VAAC reported that GOES-8 imagery through 0845 detected a low-level thin ash plume from Masaya's summit. The plume reached an altitude of ~900 m, was blown to the SW, and rapidly dissipated.
Seismic activity during April 1999-March 2000. Seismic activity at the volcano remained low with eight microearthquakes registered for the month. The RSAM (seismic tremor) stayed at ~30 units. During the first two weeks of April the RSAM signal was not obtained due to technical problems in the seismic power station. On 23 April two explosions were detected by RSAM, which were confirmed by observers at the Masaya Volcano National Park. In that case, RSAM began to show a small increase until 0800, and an hour later the two explosions occurred.
May 1999: The number of microearthquakes was 21 for the month. The RSAM stayed at ~24 units. June: The number of microearthquakes was 18 for the month. The RSAM stayed at ~24 units. August: The number of microearthquakes was 47 for the month. The RSAM remained at ~40 units. Constant gas emissions occurred. September: The number of microearthquakes was 87 for the month. The RSAM stayed constant at ~40 units. Constant gas emissions occurred. October: The number of microearthquakes was 22 for the month. The RSAM stayed constant at ~20 units. Constant gas emissions occurred. November: There were 49 microearthquakes for the month. The RSAM stayed constant. Constant gas emissions occurred. December: Twenty one earthquakes were registered for the month. The RSAM stayed constant.
January 2000: Eleven earthquakes were registered for the month. The RSAM stayed constant. At 1145 on 6 January an explosion occurred in Santiago crater. February: Six microearthquakes and the RSAM remained constant. March: There were three microearthquakes for the month. The RSAM was at a similar level as the previous month.
July 2000 seismicity near Masaya and Laguna de Apoyo. During July 2000 there were over 300 earthquakes near Laguna de Apoyo (Apoyo volcano) and Masaya. The earthquakes, determined to be of tectonic rather than volcanic origin, caused surficial damage at both volcanoes.
At 1329 on 6 July a small M 2 earthquake occurred near the N rim of Laguna de Apoyo that was followed at 1330 by a M 5.4 earthquake (figure 10). It was located ~32 km SE of Managua, at 11.96°N, 86.02°E, with a focal depth less than 1 km (figure 11). The earthquake was felt in most of Nicaragua and was most strongly felt in the cities of Managua (Modified Mercalli V-VI) and Masaya (VI), and in the region near Laguna de Apoyo (maximum intensity of VII or VIII). The earthquake caused numerous landslides down the volcano's crater walls and surface faulting was observed. In towns located in the epicentral zone, trees and electric lines fell and many houses were partially or totally destroyed. About 70 people were injured and four children were killed by collapsing walls or roofs of homes. At Masaya volcano, ~8 km from the epicenter, there were minor collapses of Santiago crater's walls. No change in degassing was observed at the volcano.
 |
Figure 10. Seismogram showing the M 2 and M 5.4 earthquakes near the Masaya volcano station on 6 July 2000. Courtesy of INETER. |
Immediately after the earthquake there were many smaller, shallow earthquakes in a zone that includes the area between Masaya, Laguna de Apoyo, and W of Granada (figure 11). In the epicentral zone property was destroyed, cracks opened in the ground, landslides occurred, and trees fell. Several landslides occurred at the edges and steep walls of Laguna de Apoyo. A large number of earthquakes continued until 10 July (figure 12 and table 2). The number of earthquakes then diminished until 1554 on 25 July when a M 4.8 earthquake took place, initiating a series of smaller earthquakes that lasted until about 27 July.
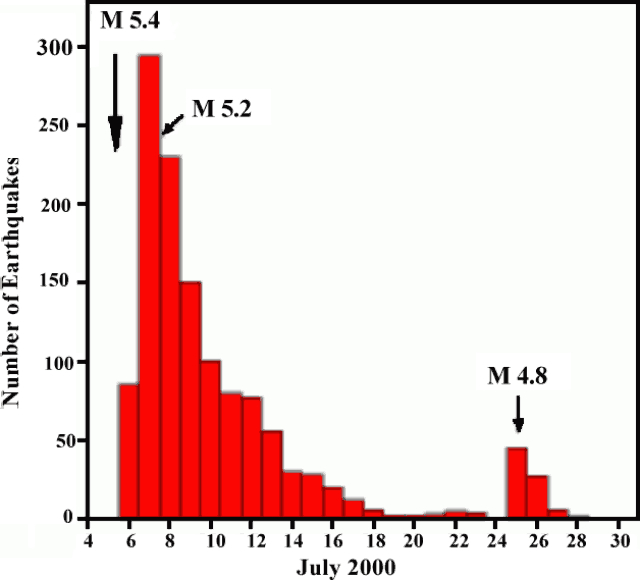 |
Figure 12. Graph showing the number of earthquakes in the Masaya region between 4 and 30 July 2000. Courtesy of INETER. |
Table 2. A summary of earthquakes in vicinity of Masaya and Laguna de Apoyo in early July 2000. Courtesy of INETER.
| Date | Time | Number of daily earthquakes | Maximum magnitude |
| 07 Jul 2000 | 1330 | 180 | 5.2 |
| 08 Jul 2000 | 1100 | 70 | 3.8 |
| 09 Jul 2000 | 1200 | 81 | 3.6 |
| 10 Jul 2000 | 1800 | 27 | 3.1 |
| 11 Jul 2000 | 1800 | 6 | 3.3 |
| 13 Jul 2000 | 1800 | 16 | 2.8 |
The July earthquakes were the most destructive seismic events since the 1972 Managua earthquake. The epicentral zone of the July 2000 earthquakes correlates with the same active zones of past earthquakes, which are caused by fault movement between the Cocos and Caribbean plates.
Information Contacts: Wilfried Strauch and Virginia Tenorio, Dirección General de Geofísica, Instituto Nicaragüense de Estudios Territoriales (INETER), Apartado 1761, Managua, Nicaragua (URL: http://www.ineter.gob.ni/); Washington VAAC, Satellite Analysis Branch (SAB), NOAA/NESDIS E/SP23, NOAA Science Center Room 401, 5200 Auth Road, Camp Springs, MD 20746, USA (URL: http://www.ssd.noaa.gov/).
Small ash eruptions in March; decreasing levels of degassing
A previous report (BGVN 25:07) reviewed evidence for steam-and-ash emissions between November 1999 and January 2000, seismicity during April 1999-March 2000, and increased seismicity in the vicinity of both Masaya and Laguna de Apoyo in July 2000. Previously unreported observations and information from March-April 2000 regarding an ongoing international degassing study, and fumarole temperature measurements from INETER, are included below.
Degassing studies during March-April 2000. The current degassing crisis at Masaya began in mid-1993 with the brief formation of a lava pond and gradual increase in degassing (BGVN 18:04 and 18:07). Canadian, Belgian, British, and Nicaraguan scientists returned to Masaya caldera between March and April 2000 to continue the study of the ongoing degassing crisis (BGVN 23:09 and 24:04). Significant amounts of Pele's hair around the W and S rims of Santiago crater (first noted by Alvaro Aleman, Masaya Park guard) were likely the result of a gas-rich explosion one night either at the end of February or during the first week of March 2000. Two minor explosions, which produced small ash plumes, were witnessed at Santiago crater on 2 March at about 1545 and 1645.
A large gas plume was still being emitted from a vent (15-20 m in diameter) at the bottom of Santiago crater. Incandescence of the vent walls was visible only at night. Temperatures recorded at the vent with an infrared thermometer ranged between 200 and 380°C, and were highly dependent upon the opacity of the gas plume. COSPEC measurements of SO2 revealed decreasing but nevertheless high emission rates, ranging from 740 ± 200 t/d to 1,850 ± 300 t/d. Remote sensing of the gas plume composition using an open-path Fourier transform infrared spectrometer (OP-FTIR) in a variety of modes revealed an average SO2/HCl molar ratio of 1.7, comparable to that obtained in February-April 1998 and February-March 1999. The acid emissions continued to affect a vast area downwind of the volcano, and the rural population subsisting on soil cultivation has been severely impacted.
Microgravity measurements between March and April 2000 appeared to show a leveling off of the previous (1993-94 and 1997-99) decreasing gravity change immediately beneath the Santiago pit crater. These values are essentially the same (within error, ± 20 microgals) as those measured at Masaya in June 1999. This leveling off of gravity change and apparent decrease in gas flux is similar to a cycle of activity between 1994 and 1997 and may suggest that Masaya is entering the waning period of the current degassing crisis.
Fumarole temperatures during December 1999-April 2000. Fumaroles from the Cerro El Comalito area (table 3) showed uniform variations in their monthly average temperatures between December 1999 and April 2000. The fumaroles are close to one another, so this outcome was expected. Fumaroles in the Filete San Fernando area exhibited more variation, with some increasing in temperature and others decreasing.
Table 3. Average fumarole temperatures from the Cerro El Comalito (CEC) and Filete San Fernando (FSF) areas of Masaya during December 1999-April 2000. All the measurements were carried out with a thermocouple. Courtesy of INETER.
| Fumarole | Dec 1999 | Jan 2000 | Feb 2000 | Mar 2000 | Apr 2000 |
| CEC 1 | 72.8°C | 67.3°C | 74.6°C | 73.2°C | 74.7°C |
| CEC 2 | 74.0°C | 68.2°C | 72.9°C | 74.8°C | 73.1°C |
| CEC 3 | 77.6°C | 69.0°C | 77.0°C | 76.3°C | 75.3°C |
| CEC 4 | 76.2°C | 69.5°C | 76.5°C | 76.5°C | 76.5°C |
| CEC 5 | 68.6°C | 63.3°C | 69.8°C | 68.2°C | 69.8°C |
| CEC 6 | 61.3°C | 56.5°C | 60.2°C | 59.0°C | 60.8°C |
| FSF 1 | 61.4°C | 60.7°C | 60.0°C | 59.7°C | 59.1°C |
| FSF 2 | 61.2°C | 57.2°C | 59.2°C | 58.9°C | 58.7°C |
| FSF 3 | 60.2°C | 69.2°C | 59.2°C | 59.3°C | 59.4°C |
| FSF 4 | 58.6°C | 64.7°C | 55.8°C | 55.3°C | 55.4°C |
INETER also noted that there were no reports of landslides or incandescence from the lava lake in Santiago crater during March-April 2000. Seismic tremor was low throughout that period, and there were only six microearthquakes registered in March, followed by 12 in April.
Information Contacts: Glyn Williams-Jones, Dave Rothery, Hazel Rymer, Department of Earth Sciences, The Open University, Milton Keynes, United Kingdom; Pierre Delmelle, Unité des Sciences du Sol, Université Catholique de Louvain, Louvain-la-Neuve, Belgium; Clive Oppenheimer and Hayley Duffell, Dept. of Geography, University of Cambridge, Cambridge, United Kingdom; José Garcia Alavarez and Wilfried Strauch, INETER, Apartado Postal 2110, Managua, Nicaragua.
Tourists experience a brief, bomb-charged 23 April 2001 explosion: no fatalities
INETER report. The Nicaraguan group INETER (Instituto Nicaragüense de Estudios Territoriales) stated that Masaya's active summit crater, Santiago, produced an explosion at 1426 on 23 April. The explosion continued for ~2 minutes and a new 10-m-diameter vent opened on the crater floor ~30 m S of the previous vent. Fragments up to 60 cm in diameter flew through the air, falling up to 500 m from the crater. Episodic ashfall was reported near the settlement of Tecuantepe, 6 km NW of Masaya volcano, and people there contended with abnormal concentrations of volcanic gases. Scientists from Cambridge University (UK) who carried out gas measurements at Santiago crater left just one hour before the explosion and had not noticed any unusual precursory behavior. Preliminary, post-event scrutiny of the seismicity failed to reveal precursory signs.
After the explosion, the volcano returned to its typical stable state and monitored parameters remained at normal levels. INETER volcanologists who continuously monitored Santiago in the afternoon and during the night reported several smaller explosions, gas outbreaks and minor collapses of the crater wall. Following the explosion, Masaya National Park closed public access to the crater-rim areas (including the Plaza Sapper visitor platform and parking lot) for the next several days.
The 24 April report noted minor ash-bearing explosions (specifically mentioning one at 1526), but these events did not exceed those typically seen nor did they accompany abnormally large seismic signals. On this day, the previously active vent no longer gave off gases. The report noted that in the current circumstances, the area of primary hazard lay within 500 m of the vent. It also said that areas farther out, particularly as far away as local habitations or along the Managua-Masaya highway, should not be affected.
SO2 monitoring at the visitor's plaza was conducted at 1020 on 24 April. It indicated that, with respect to 23 April at 1800, the ambient gas concentration there had decreased more than 72%. Since these were not flux measurements but were only ambient SO2 concentrations, fresh winds may have contributed to the decreased concentrations. The 25 April report on Masaya noted slightly larger output than the day before, including ash deposition, but noted 29% lower SO2 concentration than the day before. In harmony with the SO2 concentration decrease on 25 April, sulfurous gases then measured ~2.0 ppm in local settlements (Comarcas La Borgoña and San José de los Ríos), half the value measured the previous day.
The 27 April report noted few episodes of strong degassing during the previous two days, but normal tremor and little seismicity. A second seismic station was installed on the volcano at a spot near the visitor's platform.
23 April eyewitness account and photos. What started out as a routine sightseeing stop escalated into a local crisis as over 120 tourists found themselves on the crater rim during what was one of the more energetic Masaya explosions reported in the Bulletin in the past 30 years. Few, if any, of those earlier events had been witnessed at close range, and in retrospect it seems fortuitous that in this event no one was killed.
The event highlights the difficulty of assessing, preparing for, and conveying the possibility of infrequent, sudden events. The accompanying photos document the ambiguity of assessing the event's magnitude during the explosion's critical early stages. After the event, the majority of eye witnesses with photographs and videos quickly departed from Nicaragua, having shared almost no information with authorities.
Figures 13-19 show selected scenes the tourists captured on film during and just after the explosion. The photos were taken from the 500-m-diameter Santiago crater's N side (for maps of the crater area see SEAN 14:06 and BGVN 16:02). Figures 13-17 are in chronological order; figures 17-19 show selected scenes in the aftermath of the explosion, after the parking area had been largely vacated of vehicles.
The buses were parked in the crater rim area's N parking area. Progressing upslope and along the crater rim, a foot trail leads to the elevated overlook (~200 m W of the parking lot's center). During the explosion this trail became very exposed to ash and ballistics. Although not shown on any of the included photos, a large cross stands at the elevated overlook in the vicinity of where many of the photographers were standing at the time of the eruption (not shown in figures here but labled "La Cruz" on maps in earlier Bulletins).
The photos were furnished to the Bulletin by Joanne Gordon; Mark Headrick also helped explain the significance of some features in the photos. Photos shot by Headrick used an auto-focusing camera with a fixed-focus lens.
Figures 13-15 show the early progression of the ash- and bomb-charged plume. Although in these photos the rising plume can be seen blown towards the W, during the explosion significant numbers of bombs also fell well beyond the plume's margins. For example, some bombs began pelting the N parking lot, forcing people there to take shelter in buses and cars. Fortunately, comparatively few bombs were launched over the local high adjacent the NNW rim where photographers shot figures 13-16. The tens of tourists who had stood at the elevated overlook later retreated in haste cross-country down the hill's more sheltered but trackless back-side (figure 16).
Figures 17 and 18 show portions of the bomb-strewn parking lot. Many bombs of roughly half-liter to several-liters in volume can be easily seen. Parking stalls in the lot can be assumed to be roughly 2 x 3 m in size (~6 m2) and typically contain about 1 to 3 such bombs. This implies that on average, roughly 1 such bomb landed in each 2 to 3 m2 area.
Some bombs landing in the parking lot broke into bits on impact and sprayed local areas of the lot with their light-colored fragments (figure 18). Both figures 17 and 18 document local, sometimes circular grass fires, suggesting that some of the bombs were hotter than the several hundred degree kindling temperature of the dry, brown vegetation. Several bombs significantly damaged vehicles in the lot, causing fires, breaking windows, and puncturing and deforming bus roofs. One bomb landed in a then-unoccupied bus seat, and another plowed deep into the hood and engine compartment of a car (figure 19).
Joanne Gordon recounted the events of 23 April as follows: "While traveling by cruise ship from Costa Rica through the Panama Canal towards our final destination of Aruba, we made a one-day stop in Nicaragua for a city bus tour. The Nicaragua stop was the second day of our seven-day cruise. Approximately 150 cruisers [in] five buses were scheduled for the city tour and a short visit to Masaya volcano. The first two buses visited the volcano and were scheduled to have ~ 30 minutes to view the crater. Many of the tourists reported that the odor of sulfur greatly increased during their visit . . . . Those two buses left before the following three buses arrived.
"I was on the last bus to arrive at the crater. After getting off the bus my brother and I excitedly ascended to the top lookout point next to the cross overlooking the lip of the crater. The climb to the top of the crater was about 200 steps up a very unstable staircase . . . . Once we arrived at the top I took a few pictures of the crater and of us. Then I heard a deep rumble and the ground began to shake. It sounded as if it was a huge landslide at the opposite side of the crater. Within seconds I could see a massive black mushroom-shaped cloud of smoke filling the inside of the crater. At that point I ran–thinking, 'Is this normal?' but not wanting to stand at the edge of the crater to find out.
" . . . I ran down the [steep] back side of the hill not realizing it was like running down a slope of marbles . . . . Then I heard a second boom followed by more black smoke, and I heard rocks being thrown from the crater—people screaming—children crying . . . . "I heard a little girl's voice . . . [then] I lost my footing and rolled down the hill. After falling for the second time, I stopped to look for her. She had fallen and was caught on some brush. I could see the sky was black but the smoke was moving away from us and the explosion had stopped. I waited with her, trying to calm her . . . . I could see her dad and my brother rushing down the hill trying to keep from falling. When they caught up to us we traversed our way down the hill to the buses, which had been parked about 10-15 feet [3-5 m] from the crater and had now moved out of sight. They had driven away, moving out from under the shower of rocks.
"At this point I had thought it was just the 30-50 people crowded at the top lookout point that were in danger. Little did I know that while I was running to get away from the blast of smoke from the top, the people at the bottom were dodging rocks. It looked like a war zone. Bus windows [had] broken . . . [and (according to Mark Headrick) one bus with its backside facing the crater suffered extensive damage from ejecta, including the loss of its rear window and severe damage to the fiberglass engine cowling. The damage went deeper, and although it drove a short distance away, this bus soon ceased functioning and had to be abandoned]. One lava rock had landed on the top of a bus, and . . . [wedged into the roof where it caught fire to combustible material]. People [were] bleeding, limping, crying, and desperate to get as far away as possible. The hillside next to the parking lot was filled with burned circles. As the lava rocks hit the ground they caught fire to the surrounding brush.
"We all piled on buses and drove a little ways to the park entrance to make sure all were accounted for. I got out of the bus for first aid. I suffered abrasions down both of my arms and legs . . . . We all wanted to get in the buses and get the heck away from the mountain as quickly as possible. We left just before the news cameras and fire department arrived. We drove for about an hour and a half back to the port to board the ship and . . . [departed] Nicaragua.
"At least 15 of the 90 people on the last buses were treated by the ship's infirmary for wounds ranging from a broken arm [wrist], broken foot, abrasions, and cuts and bruises from falling or being struck by rocks. Most of the people that were struck with rocks were injured after the rocks bounced and hit the legs, shoulders, and backs.
" . . . [the cruise line] was very accommodating—they flew a crisis counselor to the ship to comfort the passengers and the 28 crew members that were also at the volcano."
Report from the ship's doctor. Medical doctor Sydney Schneidman practices emergency medicine and was the acting physician on board the cruise ship, which was moored at San Juan del Sur when the accident occurred. As injured people returned to the ship, Schneidman quickly learned that the people suffered from both physical and psychological trauma, and many of the injuries within each of these groups were quite similar.
He recalled that the most serious physical injury was a broken wrist due to a fall. This and many other injuries to 10-15 people occurred when people fleeing the fallout took the steep, off-trail escape route described above. The visitors were forced to move quickly in this direction because flying debris blocked the trail leading back to the parking lot and the buses. Many of the abrasions obtained on this forced evacuation route were leg wounds from sharp-edged volcanic rocks. In addition, Schneidman noted two or three missile injuries, one a head puncture, two others to the flank (side of the stomach), and one to a hip. (Joanne Gordon noted that a broken foot bone sustained by one of the passengers was diagnosed sometime after the trip was over.)
Regarding the psychological aspect of the injuries, Schneidman described these as mental trauma from people who thought they were going to die. He advised the visitors be treated without delay by a psychologist skilled in dealing with "critical-instance stress" (CIS) debriefing, and when in Panama one day later, the cruise ship had arranged to pick up a psychologist flown in from the USA specializing in trauma counseling. Over the next several days the psychologist held group therapy sessions. Studies have shown that rapid treatment for trauma can circumvent or decrease several years of difficulties, including sleeplessness, anxiety, and depression (Goenjian and others, 2000; Schmookler, 1996).
Media coverage. The explosion and its effect on tourists were discussed in news articles in the Los Angeles Times and at least one other Southern-California paper (Reich, 2001; Lee, 2001). The television show Inside Edition aired videos and photos taken of the explosion by visitors returning from the cruise ship (Inside Edition, 2001). At the time, Nicaraguan papers covering the story included few if any details about the experiences of the tourists from the cruise ship because they lacked contact with them.
References. Goenjian, A.K., Steinberg, A.M., Najarian, L.M., Fairbanks, L.A., Tashjian, M., and Pynoos, R.S. , 2000, Prospective study of posttraumatic stress, anxiety, and depressive reactions after earthquake and political violence: American Journal of Psychiatry, v. 157, no. 6, p. 911-916.
Inside Edition, 2001, Volcano survivors: King World Productions, 8 May 2001 telecast (video ordering information at the phone number 212-817-5656 ext. 5583); 515 W 57th St., New York, NY 10019 USA.
Lee, Jasmine, 2001, Tested by fire—Area residents recount terror of volcano blast in Nicaragua: Daily Breeze (A Copley Newspaper, Torrance, CA), 3 May 2001, p. A1 and A9.
Reich, Kenneth, 2001, Volcano's eruption shook up vacation of southland sisters—Nicaragua: The two dodged rocks and ash on a sightseeing stop at a crater during a Latin American cruise; one broke her arm: Los Angeles Times, Metro News, 3 May 2001, p. B2.
Schmookler, Edward L., 1996, Trauma treatment manual (URL: http://amsterdam.park.org/Guests/Stream/ trauma_manual.htm).
Information Contacts: INETER, Apartado Postal 2110, Managua, Nicaragua; Joanne Gordon, 222 East Carrillo, Ste. 106, c/o PaineWebber, Santa Barbara, CA 93101 USA; Sydney Schneidman, M.D., 1757 Holicong Rd., New Hope, PA 18938 USA.
Fumarolic emissions and low-level seismicity from April 2002 through May 2003
During April 2002-May 2003, monthly visits were made to Masaya for observations and temperature measurements. This report summarizes the recorded activity.
Between April and October the volcano continued to emit large amounts of gas. Tremors stayed consistently above 40 RSAM units. Seismicity was low, with fewer than 50 total earthquakes during the observation period; temperatures generally remained constant.
Fumarole temperature measurements in the Santiago crater on 22 April 2002 showed only a slight variation from October 2001. On 9 May, however, temperatures showed an increase of 20°C since April; again on 4 June a 20°C increase from May was observed. Measurements by Jaime Cardenas of the National Park at El Comalito and San Fernando on 10 and 30 April also showed little change from previous measurements. Similarly, on 5 and 21 May and in June measurements at El Comalito and San Fernando showed no significant changes. The temperatures at El Comalito and San Fernando fumaroles remained constant through the rest of the year.
In July 2002 tremor stayed above 40 RSAM units, and the volcano continued to emit great amounts of gas. Seismic stations registered 20 earthquakes. On 7 July several rumblings were reported. During a visit to the volcano emissions of dark-colored gases were seen. Landslides were observed to have extended to the inner crater, which had a diameter of 20 m; the diameter was 10 m when the crater opened on 23 April 2001. Gas emanations were abundant; a plume rising more than 1,000 m was observed. Fumarole temperatures varied between 106 and 89.3°C.
In August 2002 gas emissions continued. Martha Navarro and Virginia Tenorio visited on 15 August and observed and clearly heard gases emanating from two locations in the inner crater. Gas columns mixed with vapor reached heights of up to 700 m. The emission of gases was lower than during the previous month, possibly due to decreased rainfall. The tremor continued to stay above 40 RSAM units, and 11 earthquakes were registered.
Navarro visited the volcano twice in September. Gas columns were low and there was little vapor on 13 September; on 30 September she observed greater gas emissions and within the inner crater she could hear with greater force the sound of gas emissions. Weeds within an area of 600 m had been affected by acid rain. A small collapse along the N and E walls was observed within the crater.
On 3 October park guards reported a small collapse from the W wall. Observations on 7 and 28 October showed more water vapor than in September, as well as greater gas emissions and louder sounds associated with them. Through September and October tremor remained above 40 RSAM units; no earthquakes were registered. On 6, 16, and 18 December fumarole temperature measurements were taken with an infrared camera at Santiago crater; measurements on those dates were 216°C, 230°C, and 205°C respectively.
Through December 2002 and January and February 2003 fumarole temperatures at El Comalito and San Fernando remained constant. The low level of gas and vapor exhalation continued; columns reached as high as 100 m at the mouth of the crater. RSAM stayed constant at 30 units, with frequency between 1.5 and 2 Hz. In both January and February two earthquakes were registered. During 25 and 26 February there was a small earthquake swarm in Masaya caldera, with earthquakes located under the lake. Six earthquakes registered in March, with 3 Hz frequency, and five registered in April, with 2.8 Hz. RSAM stayed at 20 units, with frequencies between 1.5 and 2 Hz, in March and April.
Gustavo Chigna (INSIVUMEH-Guatemala) reported that the sulfur-dioxide measurements obtained using COSPEC on 28 March yielded a flux of 840 t/d. Measurements by Glyn Williams-Jones (University of Hawaii) with a 2FlySPEC (gas measurement spectrometer) on 28 March showed a value of 849 t/d. On 8 and 22 May measurements at El Comalito and San Fernando showed little variation. The temperatures at the six fumaroles at El Comalito ranged between 59.5°C at fumarole 6 and 76.4°C at fumarole 3. At San Fernando temperatures ranged from 56.4°C at fumarole 4 to 63.6°C at fumarole 2. The seismic tremor stayed constant with 20 units RSAM, with frequencies of 1.5-2 Hz. Only one earthquake registered, with 3 Hz frequency. Pedro Pérez measured the fumarole temperatures in the Santiago crater at 175°C on 15 May.
Gas monitoring. A scientific and technical team from ITER, INETER, and WESTSYSTEMS (Italy) installed a geochemical station, developed by WESTSYSTEMS, for continuous monitoring of diffuse CO2 and H2S degassing at El Comalito. The observation site was selected after a 1999 diffuse degassing survey at Masaya. The station has been in operation since 15 March 2002.
Information Contacts: Virginia Tenorio, Wilfried Strauch, and Martha Navarro, Instituto Nicaragüense de Estudios Territoriales (INETER), Apartado Postal 2110, Managua, Nicaragua (URL: http://www.ineter.gob.ni/); Nemesio M. Pérez, Instituto Tecnológico y de Energías Renovables (ITER), 38611 Granadilla, Tenerife, Canary Islands, Spain; Giorgio Virgili, WESTSYSTEMS, Via Molise, 3 56025 Pontedera, PI (Italy) (URL: http://www.westsystems.com/).
Fumarole temperatures unchanged; landslides, incandescence in Santiago crater
This report summarizes the activity at Masaya during June-September 2003. Activity was generally constant, with fumarole temperature measurements similar to those from previous months (BGVN 28:08). In June, July, and August, during visits made every two weeks, Jaime Cárdenas of Masaya Volcano National Park measured the fumarole temperatures at the Comalito and San Fernando craters (table 4). No changes were observed from previous months. During these months, seismic tremor remained constant with 20 units RSAM. No earthquakes were registered, but on both 21 June and 21 July landslides were reported in the Santiago crater. In September, temperatures obtained from the Santiago crater with a Pyrometer were 187°C and 123°C. It was noted during this visit that the lava sounded like ocean waves, and incandescence was observed at night. Temperatures at El Comalito remained moderate.
Table 4. Temperatures recorded at the El Comalito (EC) and San Fernando (SF) fumaroles of Masaya, 10 June-22 September 2003. All temperatures are in degrees Celsius. Courtesy INETER.
| Date | EC 1 | EC 2 | EC 3 | EC 4 | EC 5 | EC 6 | SF 1 | SF 2 | SF 3 | SF 4 |
| 10 Jun 2003 | 65.4 | 74.5 | 76.8 | 72.5 | 73.4 | 60.2 | 59.2 | 54.8 | 57.2 | 55.8 |
| 28 Jun 2003 | 66.4 | 75.4 | 78.4 | 73.6 | 73.8 | 60.4 | 60.2 | 55.6 | 58.8 | 56.7 |
| 12 Jul 2003 | 55 | 76 | 78.2 | 74 | 73.6 | 60 | 60 | 60.2 | 59.5 | 57 |
| 26 Jul 2003 | 66.8 | 78.4 | 79.4 | 75.6 | 74.2 | 61 | 61.2 | 61.4 | 60.2 | 58.2 |
| 15 Aug 2003 | 66.6 | 78.2 | 79.5 | 76 | 74.5 | 61.5 | 59.7 | 59.7 | 57.2 | 56.2 |
| 29 Aug 2003 | 67.8 | 75.6 | 76.6 | 74.8 | 76.4 | 64.2 | 59.3 | 57.4 | 56.9 | 57 |
| 22 Sep 2003 | 68.6 | 72.3 | 68.3 | 65.2 | -- | -- | -- | -- | -- | -- |
Information Contacts: Virginia Tenorio, Instituto Nicaragüense de Estudios Territoriales (INETER), Apartado Postal 2110, Managua, Nicaragua (URL: http://www.ineter.gob.ni/).
Intermittent ash eruptions November 2003-March 2005; continuing incandescence
Previously reported behavior at Masaya through 22 September 2003 consisted primarily of incandescence from Santiago crater (BGVN 28:10). Monthly reports prepared by the Instituto Nicarag?ense de Estudios Territoriales (INETER) since that time noted continuing seismicity and incandescence through March 2005. A small explosions was reported on 29 November 2003. Masaya Volcano National Park workers also reported two ash-and-gas explosions at 0121 on 12 December 2003. A collapse event within the crater was noted on 22 June 2004. A report from the Washington Volcanic Ash Advisory Center (VAAC) noted that on 4 July 2004 at 0015 local time, a narrow plume of steam and/or ash from Masaya was visible on satellite imagery extending to the SW. An hour later the plume had extended ~ 12 km from the summit. The report below notes changes induced in Santiago crater after a landslide in early March 2005. A magnitude 1.9 earthquake at a depth of 2.2 km below Masaya on 30 March 2005 was followed by rumbling noises and gas-and-ash emissions.
Field work during February-March 2005. Patricia Nadeau and Glyn Williams-Jones sent us a report of an intensive, multi-component field campaign conducted at Masaya from 16 February 2005 to 12 March 2005. Two FLYSPEC ultraviolet spectrometers were used in tandem with two Microtops sun photometers to constrain passive SO2 and aerosol fluxes and also to evaluate potential downwind loss of SO2 by conversion to aerosols. Additionally, self-potential geophysical measurements were performed at Masaya's summit in a preliminary attempt to delineate the hydrothermal system of the volcano.
On the morning of 3 March, Park workers reported that a landslide had occurred within Santiago crater the previous night. A visibly diminished plume from the crater's active vent suggested that the landslide may have caused a blockage that reduced the escape of SO2 (figures 20 and 21).
The visual observations were supported by subsequent SO2-flux measurements, which confirmed a significant drop in SO2 emissions from an average of ~ 300 tons/day prior to the landslide to an average of ~ 80 tons/day following the landslide (figure 22). This decrease in emissions led to concerns over the possibility of a small vent-clearing explosion such as the one that occurred on 23 April 2001 (BGVN 26:04). That explosion was preceded by a similar drop in SO2 emissions for several weeks due to a blockage of the vent that was active at the time. The 2001 explosion resulted in the opening of a new vent, which has since been the site of Masaya's degassing. After the 2001 explosion, the previously active vent no longer degassed and was assumed to be completely inactive.
In the days following the 2 March 2005 landslide, gas output was monitored closely, both visually and with the FLYSPEC, for any further decreases, which could have been indicative of further blockage and possible pressurization. Visual observations of the crater on the nights of 4 March and 11 March revealed that while the currently degassing vent was not incandescent, the older vent (believed to be inactive after the April 2001 explosion) was indeed incandescent, though not degassing (figure 23).
As of 10 March, the visible gas emissions were the lowest seen, despite the apparent open conduit, as indicated by incandescence in the old vent. Rumbling and sloshing sounds from within the crater had increased from sporadic to nearly constant. However, the days following were marked by a decrease in acoustical noise, as well as the apparent beginning of a climb back to higher SO2 emission rates (~ 120 tons/day on 16 March). These observations were consistent with devlopments in the upper conduit.
References. Williams-Jones, G., Horton, K. A., Elias, T., Garbeil, H., Mouginis-Mark, P. J., Sutton, A. J., and Harris, A. J. L., Accurately measuring volcanic plume velocity with multiple UV spectrometers: Bulletin of Volcanology, in press.
Williams-Jones, G., Delmelle, P., Baxter, P., Beaulieu, A., Burton, M., Garcia-Alvarez, J., Gaonac'h, H., Horrocks, L., Oppenheimer, C., Rymer, H., Rothery, D., St-Amand, K., Stix, J., Strauch, W., and van Wyk de Vries, B., (2001?), Projecto Laboratorio Geofisico-Geoquimico Volcán Masaya, Geochemical, geophysical, and petrological studies at Masaya volcano (1997-2000), on INETER website at.
Information Contacts: Patricia Nadeau and Glyn Williams-Jones, Department of Earth Sciences, Simon Fraser University, Burnaby, Canada; Kirstie Simpson, Geological Survey of Canada, Vancouver, Canada; Washington Volcanic Ash Advisory Center (VAAC), Satellite Analysis Branch (SAB), NOAA/NESDIS E/SP23, NOAA Science Center Room 401, 5200 Auth Rd, Camp Springs, MD 20746, USA (URL: http://www.ospo.noaa.gov/Products/atmosphere/vaac/); Wilfried Strauch and Martha Navarro, Instituto Nicaraguense de Estudios Territoriales (INETER), Apartado Postal 2110, Managua, Nicaragua.
Phreatomagmatic explosions in August 2006; intermittent plumes through 2008
Our previous report on Masaya, in April 2006 (BGVN 31:04), summarized intermittent ash eruptions and continuing incandescence through March 2005. At that time, the visible SO2 gas emissions were the lowest seen, a condition attributed to the landslide of 2-3 March 2005 blocking the degassing vent. MODIS/MODVOLC data revealed only one pixel on 24 April 2006.
Activity during 2005-2006. The level of tremor slowly decreased from 20 RSAM units in April 2005 to 10 RSAM units a few months later. A short INETER report noted that there were no micro-earthquakes registered in October 2005. Tremor then stood at 15 RSAM (Real-time Seismic Amplitude Measurement) units, occurring with frequencies of 1.5 Hz. Gas fumes remained steady and strong. No activity was reported from April 2005 until 25-30 April 2006 when there was a small increase in emissions, with columns of gases rising ~ 100 m from the crater; there was also a strong odor of sulfur. During May, increased precipitation resulted in acid rains that burned the vegetation. In June, an observer reported a wall collapse in Santiago crater.
On the evening of 3 August 2006 seismic tremor began to increase, reaching approximately 130 RSAM units. This level was maintained throughout the next day; typically RSAM levels are at about 5 units. INETER volcanologists traveled to the volcano on 4 August and around 1030 observed two small phreatomagmatic explosions from the crater with dark gray ash. From the crater rim incandescence was seen at the bottom of the crater, and jet engine sounds could be heard. Civil Defense also reported that residents of Leon saw ash and gas emissions in the morning. Small amounts of ash fell in Cristo Rey, W of the volcano and in Las Marías to the N. Gas emissions remained strong on 4 August. Small explosions on the morning of 6 August again ejected ash. Activity decreased afterwards, with no further ash emissions and a drop in seismicity to 20 RSAM units. Minor gas emissions continued.
Overall during August 2006 the frequency of tremor shifted slightly from 1.5 to 2.0 Hz, which remained constant through August. Gas emissions increased in August 2006 at a point ~ 800 m from the cone. Gas emissions were released from the old crater as well. Temperatures at the San Fernando and Comalito cones remained unchanged. On 20 August, Martha Navarro (INETER) and Gustavo Chigna (INSIVUMEH, Guatemala), measured SO2 emissions with a COSPEC near El Crucero, (16 km W of the summit) and noted a level of ~ 900 tons of SO2 per day.
On 4 September 2006 tremor remained at 15 RSAM units, with frequencies of 1.5 Hz, a level that continued through October. Gas emissions remained constant, steady and strong. INETER reporting on 25 October 2006 discussed a new vent that opened on the floor of Santiago crater with a small lava lake. It displayed intense degassing. Following heavy rains, landslides spilled down the crater walls. Instability was noted at an overlook parking area.
Activity during 2007-2008. The Washington Volcanic Ash Advisory Center (VAAC) provided occasional reports of plumes from 26 April 2007 to 17 December 2008, predominately from GOES-12 satellite observations. Pilots and local residents also contributed observations through the VAAC and INETER.
A steam plume that drifted WSW on 26 April 2007 was visible on satellite imagery and a web camera. Additional plumes on 9 and 12 June, with little or no ash, were noted. No further plumes were reported until 24 December 2007, when a small diffuse plume, possibly containing ash, moved SW; a change in seismicity corresponded to the emission.
Pilots reported an ash plume on 29 April 2008 that was also seen in satellite imagery moving SW at 2.1 km altitude. An explosion on 18 June 2008 registered on the seismometer E of the volcano. The event discharged moderate quantities of gas and volcanic ash, and the resulting cloud was dark in color. Nearby inhabitants felt the explosion.
Satellite imagery during August 2008 revealed plumes described as steam on 12 August and gas on 18 August, both possibly containing ash. Similar plumes on 10 and 12 September drifted ENE. Pilots reported that on 9 October an ash plume rose to an altitude of 4.6 km and drifted NNE. Analysis of satellite imagery through the rest of 2008 showed possible diffuse ash and steam plumes to the SW and S on 4-5 November, a plume with possible ash on 2 December that moved SW, and a gas plume with possible ash to an altitude of 5.3-6.1 km on 17 December.
Information Contacts: Wilfried Strauch, Virginia Tenorio, and Martha Navarro, Instituto Nicaraguense de Estudios Territoriales (INETER), Apartado Postal 2110, Managua, Nicaragua; Jaime Cardenas Masaya Volcano National Park, Gustavo Chigna (INSIVUMEH, Guatemala); Washington Volcanic Ash Advisory Center (VAAC), Satellite Analysis Branch (SAB), NOAA/NESDIS E/SP23, NOAA Science Center Room 401, 5200 Auth Rd, Camp Springs, MD 20746, USA (URL: http://www.ospo.noaa.gov/Products/atmosphere/vaac/).
Degassing through at least mid-2011; episodic crater wall collapse
This report on Masaya presents a summary of activity through mid-2011. Our last report was issued in March 2009 (BGVN 34:03) and highlighted the intermittent plumes and explosions of 2006 and 2008.
From 2008-2010 activity generally consisted of degassing with sulfur dioxide (SO2) fluxes typically under 1,200 tons per day. Instability of the S andW crater walls was a concern for the National Park and monitored by the agency INETER (Instituto Nicaragüense de Estudios Territoriales). Mass wasting, frequently triggered by heavy rain, occurred within the crater with debris occasionally blocking the active vents.
Throughout this 3-year period, fumarole temperatures ranged from 58 to 84°C and regular monitoring of the El Comalito cinder cone showed that degassing continued. Tremor sources shallowed during 2008-2010, rising from a 2008 depth of 26 km to a 2010 depth of ~ 1 km.
On 12 October 2010 incandescence occurred in the intra-crater area's largest opening (figure 24). Temperature at the points of incandescence reached 207°C. Differential optical-absorption spectroscopy (DOAS) measurements from vents registered SO2 fluxes of 465 tons per day. SO2 emissions increased throughout October 2010, reaching 586 tons per day. INETER reports contain plots with more detailed SO2 data.
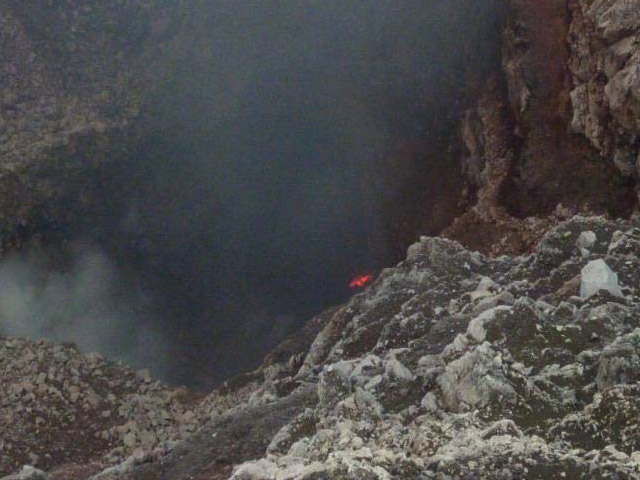 |
Figure 24. Incandescence seen in Masaya's Santiago crater on 12 October 2010. Note the crater's vertical walls and depth. Courtesy of INETER. |
SO2 fluxes in 2011. In January 2011, INETER's team measured SO2 fluxes while in transit along the easternmost route on figure 25 (between the town of Ticuantepe and the community of San Juan). Those SO2 measurements averaged 642 tons per day, an increase over 2010 that was attributed to increased gas and magma output.
During 7-30 March 2011 collaborators from the University of East Anglia, Heidelberg University, and Oxford University measured Santiago crater's SO2 and other gas emissions. A Mini-DOAS mobile was one of the many instruments used to monitor the atmosphere and SO2 fluxes (figures 26-28).
 |
Figure 27. Instruments used during the 7-30 March 2011 campaign to measure SO2 on a continuous basis from a viewing platform overlooking Masaya. Courtesy of INETER. |
In addition to mobile DOAS and fixed gas monitoring systems, a small dirigible (Zeppelin) represented a novel monitoring approach. One potential use for the dirigible was as a platform from which to measure gas concentrations inside the volcanic plume at altitude. Unfortunately, when deployed on its trial launch, heavy winds quickly blew it out of control (figure 29).
Crater-wall collapse leads to 6 August 2011 Park closure. More than a dozen crater-wall collapses occurred at Santiago crater during June and July 2011. INETER geologist Marisol Echaverry López noted that the SW and W sides of the crater wall had severely eroded. Echaverry recommended that, should the situation worsen, nearby residents be evacuated since debris-covered vents could pressurize the system and lead to explosions. On 14 July, geologist Martha Ibarra found that debris shed from the steep walls was accumulating and the recent collapses had blocked two gas vents. The deep, steep wall of Santiago crater frequently collapsed along fracture zones.
On 6 August 2011, Masaya National Park officials alerted INETER that significant portions of the SW crater rim had collapsed and completely covered the active vent. The park closed for the day during inspections by INETER. The SW rim was the site of frequent failures and field investigators noted that gas emissions were blocked for ~ 10 minutes. No additional failures were observed and activity did not escalate.
During field investigations in September and October 2011, INETER described and measured temperatures from three new fumaroles within Santiago crater. These sites were located at the edges of debris fill within the crater, along the S and E walls and were degassing with temperatures from 48 to 74°C. SO2 measurements from Mini-DOAS indicated decreasing emissions during this time period, from 518 tons per day in September to 153 tons per day in October 2011.
Information Contacts: Instituto Nicaragüense de Estudios Territoriales (INETER), Apartado Postal 2110, Managua, Nicaragua (URL: http://www.ineter.gob.ni/).
Continuous monitoring of emissions and new investigations from collaborators
In our last report on Masaya volcano, we reviewed field investigations and gas measurements from 2008-2011 including the attempt to launch a small Zeppelin as an experiment to measure gas emissions in March 2011 (BGVN 36:11). Here we present results from monitoring efforts focused on the elevated activity that has continued from Masaya's Santiago crater, one of the nested summit craters in Nindirí cone (figure 30). New gas measurements and field observations have become available from the Instituto Nicaragüense de Estudios Territoriales (INETER) from November 2011 through March 2012. Reports were also available for Masaya's Comalito cinder cone, a site of continuous gas emissions and elevated temperatures. In February 2012, INETER met with collaborators from both Simon Fraser University (Canada) and The Open University (UK). We highlight some of the results from these collaborators including mapping and modeling of Masaya's hydrothermal complex, results from long-term SO2 flux monitoring, and a conceptual model that links magma chamber dynamics with intermittent explosive activity.
The false-color image of Masaya (figure 30) and the surrounding area is a standard composite image (bands 4,3,2) captured by Landsat on 25 March 2001, during Nicaragua's dry season (November through April). Here, vegetation appears in shades of red (darker in areas with denser vegetation), urban areas are cyan blue, and soils vary from dark to light browns. Located just 500 m E of Santiago crater, Masaya crater is distinguished by older deposits, last active around 150 AD, and contains a ring of vegetation (which appears as a pale pink circle). Masaya's recent lava flows have been contained within the larger caldera except for those dating from 1670 when lava ponded along the northern caldera rim and spilled over to cover more than 1 km2 outside the caldera.
In November 2011, INETER recorded little activity from Masaya. No field visits were made and no earthquakes were large enough to locate hypocenters. Seismicity that month was low, at 50 RSAM units.
On 12 December 2011, INETER conducted site visits to Masaya's active crater (Santiago) and Comalito cinder cone. With an infrared thermometer, temperatures were measured from vents within Santiago crater; the highest temperatures measured were 42 and 45°C. The field investigators learned from National Park personnel that, recently during a 2-hour period, booming noises were heard from Santiago crater. INETER suggested that the noise resulted from strong gas release from deep within the crater - no visible material was ejected during the episodes. Areas of gas release could be visually identified within the crater; these were also locations where debris had been shed from the S and SW walls. Rockfalls from these locations were likely affecting gas emissions.
Additional visits to Comalito cone (figure 30), a satellite cone located less than 2 km NE of Santiago crater, allowed in situ measurements of fumarole temperatures. Four sites were measured; the highest temperature was 79°C, the lowest was 75°C (fumaroles 4 and 1 respectively). These temperatures were considered typical compared to others during 2011 (as compiled by INETER; figure 31). The lowest temperatures of the year 2011 were recorded in May and July with some values as low as 60-65°C.
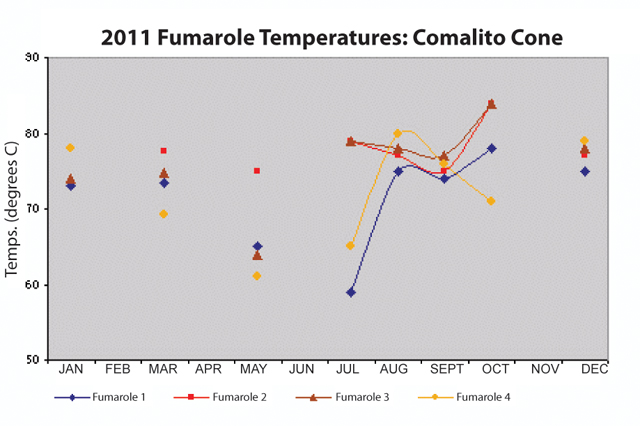 |
Figure 31. Temperature measurements made by INETER during 2011 at Masaya's Comalito cone. Four fumaroles were measured consistently throughout the year. Courtesy of INETER. |
To quantify SO2 gas emissions, INETER used a mobile Mini DOAS throughout the year transported on two different routes. The road between Ticuantepe and San Juan de la Concepción was the closest route available when the plume trended SW. An additional route, at a greater distance (figure 25 from BGVN 36:11) was available between Las Quatro Esquinas and El Crucero. On 13 December, cloud cover limited the number of successful traverses; however, an average SO2 flux of 648 metric tons per day (t/d) was calculated from three of the six traverses. This was a significant increase compared to values obtained in October 2011 when 13 successful traverses that month yielded an average of 153 t/d. These values (and others in this report) have not been corrected for meteorological conditions and error calculations were not available during this reporting period.
On 23 January 2012 INETER conducted traverses below Masaya's plume with a Mini DOAS. Measurements along both routes, proximal (Ticuantepe and San Juan de la Concepción) and distal (Las Quatro Esquinas and El Crucero) were attempted. From 10 calculations, SO2 flux from the proximal route yielded 801 t/d. From the distal route, the average flux rate was 543 t/d.
INETER conducted fieldwork during 30-31 January 2012, visiting Santiago crater and Comalito cone. Temperatures from fumarole sites on Comalito had maximum temperatures of 70°C (fumarole 4) and 78°C (fumarole 2) on 30 January. The maximum temperature measured from Santiago crater had increased to 95°C.
On 1 February 2012, INETER visited Comalito cone and reported fumarole temperatures. The highest temperature was 97°C (fumarole 1); on 23 February the highest temperature was 86°C (fumarole 2). Fieldwork also included visits to Santiago crater; temperatures within the crater were relatively low, 75 and 70°C (from 1 February and 23 February, respectively). SO2 flux from Mini DOAS from the closest route (Ticuantepe and San Juan de la Concepción) yielded an average of 943 t/d based on 12 traverses, continuing the trend of increased SO2 emissions since December 2011.
In March 2012, National Park personnel reported that acoustic noise from the crater was less frequent compared to the previous month. Also, visible gas emissions appeared concentrated at the SW and innermost portions of Santiago crater. On 12 March 2012, INETER visited Masaya and measured temperatures from Santiago crater. A wide range of values was recorded: 100°C to 43°C. Relatively stable temperatures were measured from Comalito cone: 73°C to 76°C. The highest temperatures were measured at fumaroles 3 and 4.
On 20 March INETER conducted Mini DOAS traverses beneath Masaya's SW-trending gas plume. On the proximal route, 12 traverses were successful and determined an average SO2 flux of 1002 t/d suggesting the increasing trend that began in early December 2011 was continuing. Without error calculations and assessing meteorological conditions, however, this trend could not be directly interpreted.
Geohydrology. Long-term interest in diffuse CO2 gas emissions spurred recent investigations into Masaya's hydrothermal system. Mauri and others (2012) found active hydrothermal anomalies under many of the cinder cones and investigated these conditions with field measurements of soil CO2 concentration, self-potential (SP), soil temperatures, and flow-path modeling (figure 32). Self potential methods make observations "of the static natural voltage existing between sets of points on the ground (Sheriff, 1982)". From Comalito cone, Nindirí cone, and the lower slopes of Masaya, CO2 gas concentrations ranged from 26 to 43 ppm (mean values). During a 5-year investigation, the authors collected SP geophysical data over extensive transects within the caldera. The datasets yielded significant correlations between high CO2 soil concentrations and SP anomalies. Water depths were determined by processing the SP data with mathematical techniques (wavelets from the Poisson kernel family). They concluded that interconnected structures (ring faults, fissures, and dikes) serve as flow paths for gas, fluids, and heat. These structures also have the potential to block groundwater flow, a conclusion suggested by their models of groundwater contributions to Masaya Lake (Laguna de Masaya) (figure 32).
In Figure 32a, we see the spatial localization of uprising fluids associated with hydrothermal activity (green diamonds) and gravitational water flow (blue squares) within Masaya caldera for which depths have been determined. The names of volcanic cones are in blue; crater names and ground structures are in dark red; dark green dashed lines are the fissure vent structures; solid red lines represent the inferred structures (faults, fissures) based on previous work by Crenshaw and others (1982) and Harris (2009). The red dashed lines are the hypothetical structures (faults, fissures) (Crenshaw and others, 1982). The black dashed line is the inferred limit of the caldera.
The three segments traced in Figure 32a correspond to cross-sections along A-D-B (figure 32b) and C-D-B (figure 32c). Cross-section A-D-B represents the water flow direction across the caldera while the cross-section along profile C-D-B represents the water flow direction through the active Santiago crater and across the caldera. The dashed red lines represent underground structures in cases where the dip orientation is unknown and are based on the work of Williams (1983) and Crenshaw and others (1982). Blue lines with a single dot above the center represent water flow having a flow direction different than the cross-section view. Solid arrows represent the flow direction inferred from the self potential/elevation gradient. Elevations of the shallow flow direction (blue and solid green arrows) were estimated from multi-scale wavelet tomography (MWT). MWT is a signal processing method based on waves that allow for location of dipole and monopole sources which correspond to the electrical anomalies generated by water flow through bedrock. The dashed grey line and dashed blue arrows are deep hypothetical flows from the transient electromagnetic method (TEM) results (MacNeil and others, 2007). TEM results were considered in this study because they offered a different level of sensitivity to SP method and, at the time of the study, direct well data was not available to correlate results, making it difficult to determine which model (MWT or TEM) best represented the true water depth.
Long-term SO2 fluxes and windspeed-induced errors. Nadeau and Williams-Jones (2009) consolidated data spanning three decades (figure 33) and assessed current methods for constraining uncertainties in SO2 data collected on traverses with UV correlation spectrometers (COSPEC/DOAS/FLYSPEC). The authors agreed with previous investigators that the following factors contribute to uncertainties: variable local windspeed, emission rate, dry deposition of sulfur from the plume, and conversion of SO2 to sulfate aerosols within the plume. Of these factors, the authors stressed that for low-lying volcanoes such as Masaya, the local wind patterns cause the largest errors. "One must be wary of using one blanket plume speed value for all data collected at different locations, as it can result in misleading variations within the SO2 flux dataset (Nadeau and Williams-Jones, 2009)." At Masaya, this led to as much a 50% apparent decrease in measured SO2 flux between the proximal and distal routes.
Modeling Masaya's magma system. Glyn Williams-Jones from Simon Fraser University visited Masaya with student researchers on 21 February 2012. At the National Park facilities, this group presented recent research and results from the 8-year-long collaborative effort between Simon Fraser University, The Open University, and INETER. Williams-Jones reviewed the primary monitoring techniques applied to Masaya and preliminary results regarding the environmental impact of the persistent degassing. In particular, gravity measurements, GPS, and DOAS/FLYSPEC have been used to characterize activity. SO2 flux and air quality measurements have been part of an additional effort to characterize environmental impacts related to resident's health. The varying trend in the SO2 flux observed since 1976 has been interpreted as being related to varying rates of magma convection in the volcanic plumbing system, as opposed to models invoking intermittent magma supply (Williams-Jones and others, 2003; Stix, 2007).
The model invoking convection within the system links Masaya's periodic explosive activity with intense, long-term degassing (Williams-Jones and others, 2003; Stix, 2007). The accumulation of a gas-rich magma within a shallow reservoir could develop a buoyant, pressurized foam. This setting would be susceptible to disruptions (by convection cells or structural adjustments, for example) and could be destabilized, leading to explosive activity.
References. Crenshaw, W.B., Williams, S.N., and Stoiber, R.E., 1982, Fault location by radon and mercury detection at an active volcano in Nicaragua, Nature, 300: 345?346.
Harris, A.J.L., 2009, The pit-craters and pit-crater-filling lavas of Masaya volcano, Bulletin of Volcanology, 71(5): 541?558.
MacNeil, R.E., Sanford, W.E., Connor, C.B., Sandberg, S.K., and Diez, M., 2007, Investigation of the groundwater system at Masaya Caldera, Nicaragua, using transient electromagnetics and numerical simulation, Journal of Volcanology and Geothermal Research, 166(3?4): 216?232.
Mauri, G., Williams-Jones, G., Saracco, G., and Zurek, J.M., 2012, A geochemical and geophysical investigation of the hydrothermal complex of Masaya volcano, Nicaragua, Journal of Volcanology and Geothermal Research, 227?228: 15?31.
Nadeau, P.A. and Williams-Jones, G., 2009, Apparent downwind depletion of volcanic SO2 flux-lessons from Masaya Volcano, Nicaragua, Bulletin of Volcanology, 71: 389?400.
NASA Landsat Program, 2007, Landsat ETM+ scene 7dx20010325, Orthorectified, USGS, Sioux Falls, Mar. 25, 2001.
Sheriff, R.E., 1982, Encyclopedic Dictionary of Exploration Geophysics, Eighth Edition, Society of Exploration Geophysicists, Tulsa, OK, 266 pp.
Stix, J., 2007, Stability and instability of quiescently active volcanoes: the case of Masaya, Nicaragua. Geology, 35(6):535?538.
Williams, S.N., 1983, Geology and eruptive mechanisms of Masaya Caldera complex, Nicaragua [PhD Thesis]: Hanover, New Hampshire, Dartmouth College, 169 p.
Williams-Jones, G., Rymer, H., and Rothery, D.A., 2003, Gravity changes and passive SO2 degassing at the Masaya caldera complex, Nicaragua, Journal of Volcanology and Geothermal Research, 123: 137?160.
Information Contacts: Instituto Nicaragüense de Estudios Territoriales (INETER), Apartado Postal 2110, Managua, Nicaragua (URL: http://www.ineter.gob.ni/); Glyn Williams-Jones, Department of Earth Sciences, Simon Fraser University, Burnaby, Canada (URL: http://www.sfu.ca/earth-sciences.html); Hazel Rymer, Department of Environment, Earth and Ecosystems, The Open University, Milton Keynes, UK (URL: http://www8.open.ac.uk/science/environment-earth-ecosystems/).
Explosions from Santiago crater began on 30 April 2012
Since our last report covering Masaya's seismic activity and emissions from November 2011 through March 2012, the Instituto Nicaragüense de Estudios Territoriales (INETER) has maintained monitoring efforts including site visits in April and May 2012. Here we discuss regular gas emissions (SO2 and CO2) and seismic monitoring efforts and highlight events preceding the 30 April 2012 explosion from Santiago crater that ejected ash and incandescent blocks within the bounds of the National Park. That event began a series of explosions; more than 68 explosions occurred between 30 April and 17 May 2012.
On 21 April 2012 INETER conducted routine site visits and made field measurements at Masaya. Maximum temperatures recorded with an infrared sensor found temperatures between 98.7°C and 102°C within Santiago crater. Some jetting sounds were heard from the depths of the crater, cracks were observed on the E wall that emitted abundant gases, and the W interior wall showed signs of rockfalls. INETER field teams also visited Comalito cone, located on the NE flank, and measured maximum temperatures of 72°C to 77°C.
During field investigations on 25 April 2012, INETER volcanologists measured diffuse CO2 emissions from Comalito cone. At night on 26 April, the National Park guards reported incandescence within the crater; the last report of incandescence was in October 2010 (BGVN 36:11). SO2 was measured with Mobile DOAS on 27 April on a traverse between the towns Ticuantepe and La Concha (see map for location in figure 25 from BGVN 36:11).
INETER reported that, on 27 April 2012 at approximately 0500 volcanic tremor appeared in Masaya's seismic records (figure 34). Tremor slowly increased to 70 RSAM that day, and civil defense authorities released notices to officials that significant seismic unrest was detected at Masaya.
On 28 April 2012, authorities, including the Masaya Volcano National Park, released a public announcement about the unusual seismic activity. Three hours following that announcement, the tremor signal became monochromatic near 15 Hz (figure 35). INETER suggested that this signal arose from magma moving beneath the edifice. RSAM reached 100 units with spectral analysis indicating frequencies oscillating between ~1.26 Hz and ~18.84 Hz. The strongest frequency during one particular time window (figure 35) was centered near 15.8 Hz, with a smaller peak at ~1.5 Hz.
INETER noted that before the onset of tremor on 27 April, an average of 35 seismic events per day were recorded. These were low frequency earthquakes that included signals reaching 16 Hz and interpreted as rupture events beneath Masaya. The depths of the earthquakes were determined by the P- and S-wave arrival times indicating a depth range between 3 and 4 km.
On 28 April, tremor continued at 70 RSAM and monochromatic tremor occurred again, reaching 90 RSAM. Up to 40 earthquakes were detected that day.
On 29 April, seismic tremor was slightly lower at 65 RSAM and monochromatic tremor was recorded. A total of 45 earthquakes were recorded. Signals were again monochromatic at peak frequencies of 15.8 Hz.
On 30 April at 0045, the tremor signal dramatically decreased to 30 RSAM. INETER commented that this was abnormal since tremor was often recorded between 40 and 50 RSAM during times of quiescence. Seven hours later, a strong explosion was recorded by seismic instruments and observers within the National Park witnessed a blast of gas and ash from Santiago crater (figure 36).
Due to the explosions, the Plaza de Oviedo, an overlook at the edge of Santiago crater, was covered with sand-sized pink and yellow ash and lapilli with some rocks up to 10 cm in diameter. Some of the clasts were incandescent and damaged the roofs of structures near the crater and also burned the asphalt of the plaza (figure 37). Small brush fires were ignited on the N flank of the volcano due to hot blocks falling onto the dry plants. Local firefighters worked with the National Park and Civil Defense for most of the day in order to contain and extinguish the fires. The national park was closed due to the hazardous conditions.
INETER reported the explosion ejected a column of ash, gas, and blocks reaching 1,000 m above the summit and the initial explosion was followed by 24 smaller explosions that reached 500 m. Ballistic ejecta covered an area with a 300 m radius to the SSE of the crater and ash fell as far as 3 km to the SE of the crater. Blocks measured from this area had maximum dimensions of 50 x 40 x 30 cm. Ash fell to a thickness of 2 mm in some areas and INETER calculated a total volume of 736 cubic meters of ejecta.
INETER measured temperatures from Santiago crater on 30 April with an infrared thermal camera and detected a maximum of 165°C. During the night of 30 April, 23 explosions were recorded by the seismic network.
Between 30 April and 3 May, a collaborative effort among INETER, Civil Defense, local fire fighters, and the National Park succeeded in maintaining a 24-hour watch of Santiago crater. Over four days, the teams recorded observations and determined that 68 explosions had occurred and the maximum detected crater temperature was 162°C.
On 1 May 2012 at 0223 a small explosion was recorded by the INETER seismic network. This event produced ash and volcanic bombs that fell across the NE-SE sectors including the flanks of Nindirí cone (see figure 30 in BGVN 37:04 for site names). The dimensions of the largest blocks were 60 x 50 x 40 cm.
On 3 May there were two small explosions at 0008 and 0022 with abundant gas and ash emissions. Throughout these events, tremor was constant at 1.5 Hz. On 4 May no earthquakes were recorded but tremor remained between 45 and 50 RSAM; explosions of gas and light ash were observed. On 5 May a total of 19 earthquakes were recorded and RSAM varied between 45 and 58 RSAM; ash and gas explosions were reported by National Park staff. On 6 May between 0700 and 1030 a total of 45 earthquakes were recorded and RSAM increased to 70 units.
Sporadic explosions continued until mid-May (figure 38). INETER noted that in May, RSAM averaged 60 units and a significant increase occurred on 18 May. RSAM reached 120 units and was maintained at that level until 21 May. Low tremor was recorded up to 75 RSAM units after 21 May and two days later reached 85 RSAM units with frequencies in the range 1.5-3.0 Hz. Tremor decreased and remained between 65 and 70 RSAM units until the end of the month. A total of 266 earthquakes were recorded in May.
Long-term gas monitoring. Long-term records of Masaya's gas emissions (SO2 and CO2) and fumarole temperatures have been developed by INETER. On 2 May, SO2 flux was measured during traverses between Ticuantepe and La Concha (table 5). INETER commented that they observed increasing SO2 flux since December 2011 (648 tons per day) that peaked in March 2012 (1002 tons per day). Flux was decreasing at the time of the explosion on 30 April 2012. INETER noted that overall trends in SO2 flux did not correlate with trends in seismicity, however, they emphasized that difficult-to-constrain variables such as wind speed and direction should be factored into the SO2 data interpretations.
Table 5. SO2 flux detected at Masaya from January 2011 through May 2012 during traverses with a Mobile DOAS. Courtesy of INETER.
| Month | SO2 flux (tons/day) |
| Jan 2011 | 642 |
| Sep 2011 | 518 |
| Oct 2011 | 153 |
| Dec 2011 | 648 |
| Jan 2012 | 801 |
| Feb 2012 | 943 |
| Mar 2012 | 1002 |
| Apr 2012 | 761 |
| May 2012 | 534 |
Since 7 December 2008, INETER measured CO2 emissions from Comalito cone, an active fumarolic site on the NE flank of Masaya. Diffuse CO2 was measured from a 9 hectare sector of soil as recently as 1 May 2012 (table 6). INETER reported the highest CO2 emissions were detected in 2008 and decreased between 2010 and 2011. Emissions recorded on 25 April 2012 (before the eruption) were considered low, however, there was a small peak on 1 May that may have been related to the explosive activity.
Table 6. The long-term record of diffuse CO2 analyses from Comalito cone measured from September 2008 through May 2012. Courtesy of INETER.
| Date | Area (km2) | CO2 emission (tons/day) |
| 07 Dec 2008 | 0.09 | 66.4 |
| 26 Mar 2010 | 0.09 | 27.4 |
| 02 Mar 2011 | 0.09 | 15.1 |
| 30 Jan 2012 | 0.09 | 50.8 |
| 25 Apr 2012 | 0.09 | 25.2 |
| 01 May 2012 | 0.09 | 32.2 |
On 17 May, INETER conducted fieldwork at Santiago crater and determined a maximum temperature of 162°C. While in the field, INETER staff observed two small explosions from the crater. Temperatures were also measured at Comalito cone (figure 39); the maximum recorded temperature was from Fumarole 2, 78.2°C, the highest temperature reading at Comalito cone since February 2012.
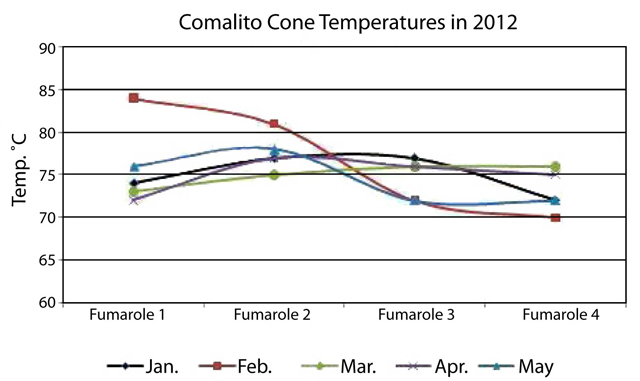 |
Figure 39. Temperatures measured at Comalito cone from January through May 2012. Courtesy of INETER. |
New monitoring efforts and installations. Two seismic stations were installed in May 2012. One station, called La Azucena, was installed by INETER on 1 May. This site was located ~4 km N of the active crater and was considered temporary. A second station, called El Comalito, was installed on 15 May; located within the National Park at Comalito cone. INETER recognized potential contributions of background noise from the fumarolic sites close to the station and planned to reevaluate the location after reviewing the results from this station. Both stations transmitted realtime data through radio repeaters.
On 4 May a web camera was installed within the town of La Azucena on a short tower; the camera was programmed to send images through a wireless network every 5 minutes. A second camera was installed in the town of Masaya at the office building of the Center of Disaster Operations (CODE); this camera also captured images every 5 minutes. The camera at CODE suffered malfunctions after installation due to overexposure from direct sunlight. Future fieldwork was planned to fix these problems.
Information Contacts: Instituto Nicaragüense de Estudios Territoriales (INETER), Apartado Postal 2110, Managua, Nicaragua (URL: http://www.ineter.gob.ni/); La Prensa (URL: http://www.laprensa.com.ni/).
Ash explosions during April-June 2012; brief crater incandescence in April 2013
Explosions from Santiago crater at Masaya volcano during 30 April-17 May ejected ash and bombs as large as 60 cm (BGVN 37:06). INETER (Instituto Nicareguense de Estudios Territoriales) noted that significant eruptive activity tapered off in mid-May, with two small explosions observed during fieldwork on 17 May. Officials from Parque Nacional Volcán Masaya (PNVM) conducted daily monitoring of the during much of June, reporting gray and white gas plumes rising generally 200-300 m above the crater, and occasionally as high as 600 m, with variable wind directions. The last possible ash emissions were reported by Park Officials on 7-8 June 2012, when gray and white plumes rose 300 m above the crater. On 15 June, INETER presented an interagency report recommending that PNVM be reopened to the public on 20 June 2012 after its closure on 30 April.
Regular monitoring of the crater temperature for the rest of 2012 showed no significant changes after the spike recorded during the April 30-May 17 activity (figure 40). INETER geologists observed in October 2012 that the diameter of the Santiago crater had increased from collapses of portions of the SE and SW walls.
 |
Figure 40. Temperatures (°C) measured at Santiago Crater during 2012. Courtesy of INETER (Monthly Report, December 2012). |
On 11 April 2013 thermal anomalies were shown in MODVOLC data (figure 41), but no reports from INETER staff were made at the time. Park rangers did report visible night-time incandescence from the crater in April; INETER staff also noted night-time incandescence on 26 April. This was the only anomalous activity reported in 2013.
Regular measurements of CO2 flux from El Comalito cone, fumarole temperatures from Santiago crater and El Comalito, and SO2 flow across the region were made by INETER staff during 2013, 2014, and 2015. An example of imaging of CO2 flux from April 2013 shows the highest values in the NE section of the Comalito cone (figure 42). Multiyear CO2 data from 2008-2015 for Comalito show a range of values from 66.4 tons per day (t/d) to 15.1 t/d. No specific trend is observed (figure 43).
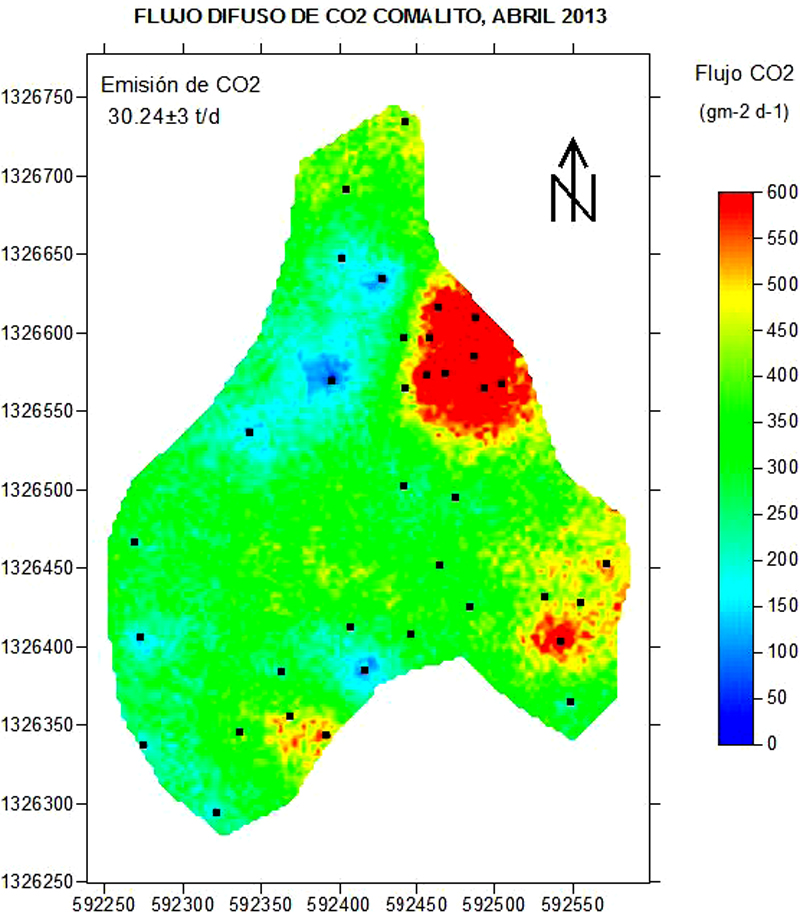 |
Figure 42. CO2 flux measured on 4 April 2013 at Masaya's Comalito Cone. Note the highest flux values are in the NE section of the cone. Courtesy of INETER (Monthly Bulletin, April 2013). |
During 24-26 June 2013, INETER volcanology staff performed SO2 measurements in the vicinity of the volcano. Significant variations of flux were observed ranging from 640 to 1721 t/d (figure 44).
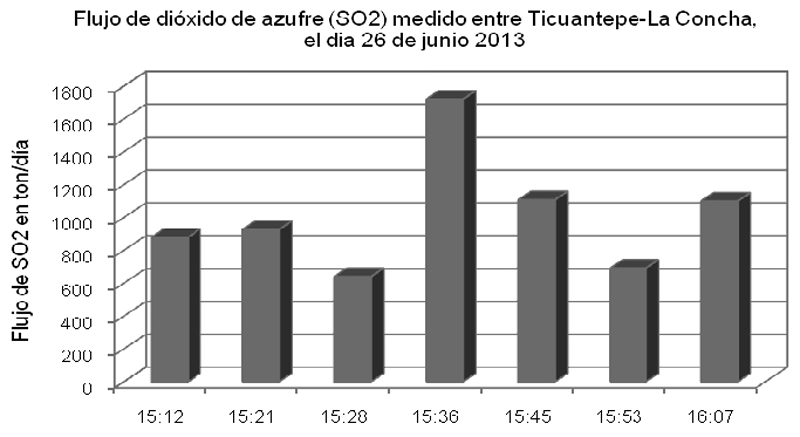 |
Figure 44. SO2 flow at Masaya measured between Ticuantepe (6 km NW) and La Concha (35 km NW), 26 June 2013. Courtesy of INETER (Monthly Bulletin, June 2013). |
During the week of 16-22 September 2013, an increase in seismic tremor signals were measured at the Masaya station. The longest event lasted for 4 hours and 20 minutes on 22 September. SO2 measurements taken during this time showed no specific correlation with the increase in tremor activity.
Seismicity during 2014 was very low with fewer than 10 earthquakes recorded in monthly seismic reports, and RSAM (real-time seismic amplitude) values consistently in the background range averaging 30 units per day. Park staff reported white gas plumes rising 100-250 m above the summit, and landslides within the crater were frequently observed.
A marked increase in seismicity was reported by INETER in April 2015. The total number of events for the month rose to 3,293, with an increase in the daily number of events from a few tens to several hundred per day starting on 15 April 2015, but the RSAM values did not increase. The total number of seismic events during May decreased back to 238. In August 2015, thermal imaging at Santiago crater showed temperatures in the normal range (not higher than 120° C), and a statistically significant correlation between SO2 and RSAM values (figure 45) was observed.
Information Contacts: Instituto Nicaragüense de Estudios Territoriales (INETER), Apartado Postal 2110, Managua, Nicaragua (URL: http://webserver2.ineter.gob.ni/vol/dep-vol.html); Hawai'i Institute of Geophysics and Planetology (HIGP), MODVOLC Thermal Alerts System, School of Ocean and Earth Science and Technology (SOEST), Univ. of Hawai'i, 2525 Correa Road, Honolulu, HI 96822, USA (URL: http://modis.higp.hawaii.edu/); Washington Volcanic Ash Advisory Center (VAAC), Satellite Analysis Branch (SAB), NOAA/NESDIS E/SP23, NOAA Science Center Room 401, 5200 Auth Rd, Camp Springs, MD 20746, USA (URL: http://www.ospo.noaa.gov/Products/atmosphere/vaac/)
Lava lake returns in Santiago Crater, large thermal anomalies recorded, minor ash emissions
Nicaragua's Volcan Masaya, has an intermittent lava lake that has attracted visitors since the time of the Spanish Conquistadores. The unusual vent-filled basaltic caldera has had historical explosive eruptions in addition to lava flows and actively circulating magma at the lava lake. An eruption in April and May 2012 ejected ash to several hundred meters above the volcano, bombs as large as 60 cm around the crater, and ash fell to a thickness of 2 mm in some areas of the park. The Instituto Nicareguense de Estudios Territoriales (INETER), Sistema Nacional para la Prevencion, Mitigacion y Atencion de Desastres (SINAPRED), and the Washington Volcanic Ash Advisory Center (VAAC) monitor the volcano's activity and provide regular reports.
The period from October 2015 through August 2016 saw the re-emergence of the lava lake, increased seismic frequency and amplitude, intermittent explosive activity, and continued strong thermal anomalies from satellite and ground based sources as a result of the newly active lava lake.
Very little volcanic activity was reported by INETER between late 2012 and for most of 2015, although regular monitoring of seismicity, temperature, and gas emissions continued (BGVN 40:10). Renewed eruptive activity after two years of quiet began on 3 October 2015. The Washington VAAC reported that a possible ash emission on 3 October 2015 at 1215 (UTC) was detected in satellite imagery, with a plume extending about 30 km ENE of the summit near one km altitude. The volcano camera and seismic data were not available, and there was no report of activity from INETER due to damaged equipment.
The last time incandescence was reported from Santiago crater was on 12 October 2010 (BGVN 36:11), except for a brief observation reported in April 2013 (BGVN 40:10). INETER reported that on 11 December 2015 rising magma brought an incandescent lava lake into view once again (figure 46); the lava lake rose to near the surface at the S part of the crater floor and was visible and audible from the crater rim.
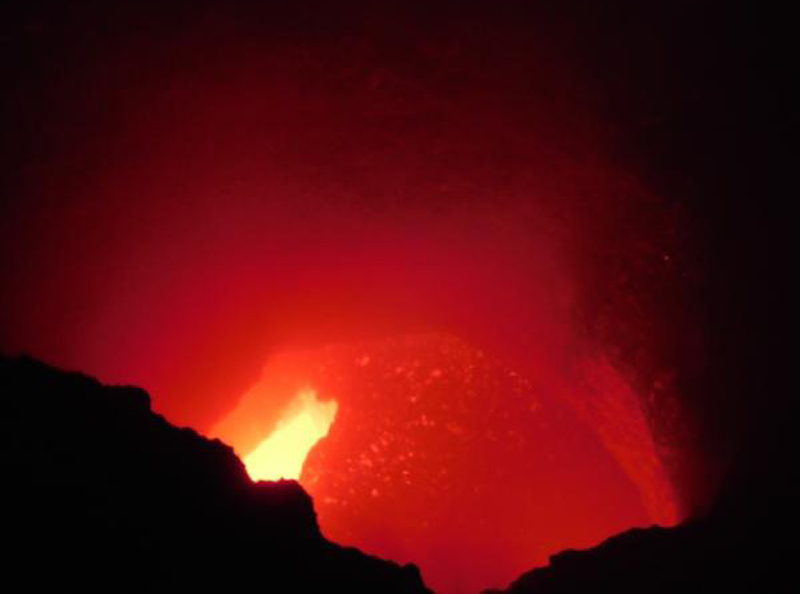 |
Figure 46. Incandescence observed at Santiago Crater at Masaya on 11 December 2015. Courtesy of INETER (Monthly Bulletin of Seismicity and Volcanoes of Nicaragua, December, 2015). |
Scientists conducting field work on 18 December 2015 observed that the vent hosting the lava lake had widened and sulfur dioxide (SO2) emissions had increased. A few days later, spatter from the lava lake was ejected from the vent and landed a few meters away on the crater floor. RSAM (Real-time Seismic Amplitude) levels were stable at low-to-moderate levels, but increased for the second half of December (figure 47).
The lava lake was first observed in satellite images beginning in January 2016. On 8 January very small explosions ejected tephra onto the crater floor. During a field visit in late January volcanologists noted that the lava lake had risen since the previous visit, and that a vent on the NE part of the floor was also incandescent. By late January RSAM values had increased to values between 400 and 800 units. A 70% increase in SO2 emissions was also recorded. On 29 January two lava lakes were prominent, and a third vent opened in the SE part of the crater floor. RSAM values remained moderate to high (80-620), and emissions were affecting vegetation downwind. During January and February the lava lake continued to be active with gas emissions (figure 48) that regularly rose 350-400 m above the crater and drifted generally W and SW, along with an increase in sounds as reported by observers. The size of the lava lakes grew in February and SO2 emissions increased, rising to 1,500 t/d during 10-11 February.
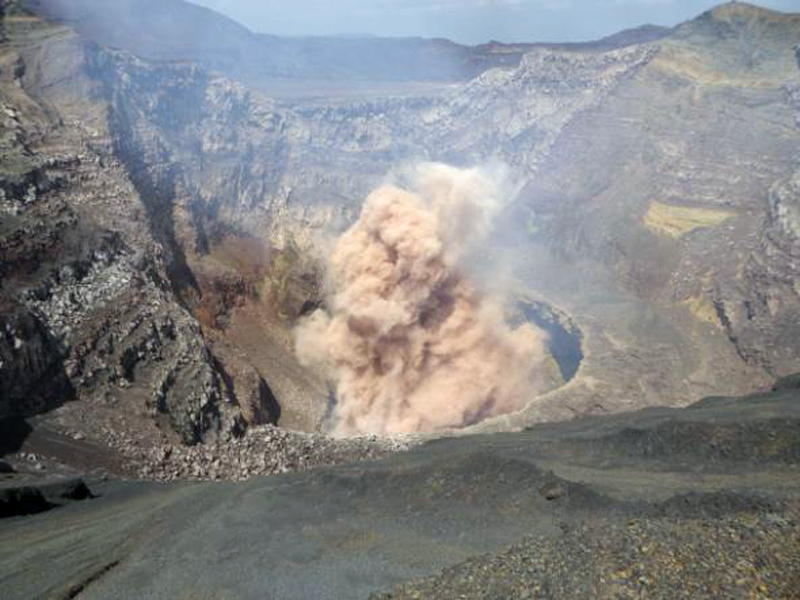 |
Figure 48. Explosion in Santiago Crater at Masaya, 17 February 2016. Photo by Guillermo Caravante; courtesy of INETER (Monthly Bulletin of Seismicity and Volcanoes of Nicaragua, February 2016) |
RSAM values were at high-to-very-high levels (up to 1,300 units) in late February and March. On 23 February small explosions again ejected spatter onto the crater floor; volcanologists observed active lava lakes in all three vents on the crater floor, and noted that the inner walls of the crater were being eroded by the lava lakes. Sporadic small streams of lava originated from the NE vent. By early March the two vents in the SW part of the crater had almost merged.
In late March activity within the lava lakes at the crater intensified and the vents continued to gradually widen as lake levels rose. INETER scientists observed several landslide deposits in the NE section of the crater. RSAM values remained at moderate-to-high levels. On 4 April SINAPRED (Sistema Nacional para la Prevencion, Mitigacion y Atencion de Desastres) noted that tremors continued and the widening of the vent in the SE part of the crater persisted. The lava lakes continued to strongly circulate and spatter during May and June, along with periodic seismic tremors and widely fluctuating RSAM values.
The Log Radiative Power data from MIROVA (Middle InfraRed Observation of Volcanic Activity) agreed well with the observations of the growing lava lakes and vigorous circulation at Santiago crater. They show the intensity of the thermal anomaly increasing from February to April 2016, and then maintaining moderate levels almost continuously through August 2016 (figure 49).
Likewise, MODVOLC anomalies for 2016 also clearly show the ongoing signature of the active lava lakes with over 100 hotspot pixels recorded between January and June 2016 (figure 50).
During 27 to 29 June, geoscience staff of INETER together with geoscientists from Lamont Doherty Earth Observatory (LDEO) made thermometric measurements of the lava lake (figure 51). The measurements demonstrated that the temperatures in the lava lake are highest in the SE corner of the vent where the magma rises into the lake from the conduit below.
On 15 August, Washington VAAC reported a possible ash emission from Masaya that rose to 1.8 km altitude (1,200 m above the summit) and drifted NW. Increased seismicity and thermal anomalies suggested continued activity at the Santiago Crater. The web camera view at the crater indicated that only minor ash was emitted, likely dissipating close to the summit. Gases and possible minor volcanic ash were again observed on satellite images at 1.8 km altitude by the Washington VAAC on 28 August, moving to the W.
Information Contacts: Instituto Nicaragüense de Estudios Territoriales (INETER), Apartado Postal 2110, Managua, Nicaragua (URL: http://webserver2.ineter.gob.ni/vol/dep-vol.html); MIROVA, a collaborative project between the Universities of Turin and Florence (Italy) supported by the Centre for Volcanic Risk of the Italian Civil Protection Department (URL: http://www.mirovaweb.it/); Hawai'i Institute of Geophysics and Planetology (HIGP), MODVOLC Thermal Alerts System, School of Ocean and Earth Science and Technology (SOEST), Univ. of Hawai'i, 2525 Correa Road, Honolulu, HI 96822, USA (URL: http://modis.higp.hawaii.edu/); Washington Volcanic Ash Advisory Center (VAAC), Satellite Analysis Branch (SAB), NOAA/NESDIS E/SP23, NOAA Science Center Room 401, 5200 Auth Rd, Camp Springs, MD 20746, USA (URL: http://www.ospo.noaa.gov/Products/atmosphere/vaac/); Sistema Nacional para la Prevencion, Mitigacion y Atencion de Desastres, (SINAPRED), Edificio SINAPRED, Rotonda Comandante Hugo Chávez 50 metros al Norte, frente a la Avenida Bolívar, Managua, Nicaragua (URL: http://www.sinapred.gob.ni/).
Persistent lava lake and gas plume activity, with intermittent ash emission, through mid-July 2017
Masaya volcano near the Pacific Ocean in Nicaragua (figure 52) is one of the most active volcanos in that country. The period from October 2015 through August 2016 saw the re-emergence of the lava lake, increased seismic frequency and amplitude, intermittent explosive activity, and continued strong thermal anomalies from satellite and ground based sources as a result of the newly active lava lake. (BGVN 41:08). Thermal satellite data analyzed by MIROVA measured moderate volcanic radiative power beginning January 2016 and continuing regularly through August 2016. The Instituto Nicareguense de Estudios Territoriales (INETER), Sistema Nacional para la Prevencion, Mitigacion y Atencion de Desastres (SINAPRED), and the Washington Volcanic Ash Advisory Center (VAAC) monitor the volcano's activity and provide regular reports.
Ash and steam emissions have been reported by the Washington VAAC from satellite data from August 2016 through mid-July 2017, the latest on 13 May 2017 when both satellite images showed and a pilot observed a W-drifting ash emission from Masaya. Plumes with possible ash content were noted on 15 August, 28 August, and 3 November 2016. Plumes identified on 5 and 21 January 2017 were stated to have minor ash content. Monthly reports from INETER consistently noted ongoing gas emissions, lava lake activity, and variable seismicity.
Since August 2016, thermal anomalies recorded by MIROVA seemed nearly constant in power level and regularity until about May 2017, at which time both seemed to decrease slightly (figure 53). Since mid-May 2017, MODIS thermal satellite data processed by MODVOLC measured thermal alerts have decreased from nearly daily in July 2016 to 4-6/month through July 2017.
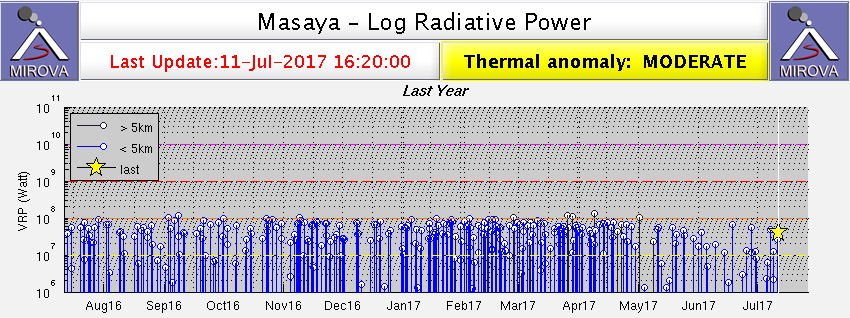 |
Figure 53. Thermal anomaly data identified by the MIROVA system at Masaya for the year ending 11 July 2017. Courtesy of MIROVA. |
INETER reported that from 1 to 5 May 2017 fieldwork was conducted with scientists from the University of McGill (Canada) and the Volcanological and Seismological Observatory of Costa Rica (OVSICORI). Measurements of sulfur dioxide (SO2) in the plume emitted by the Santiago crater were carried out using the DOAS Mobile technique, and samples of hydrogen sulfide (H2S), hydrogen bromide (HBr) and bromine chloride (BrCl) were collected to be analyzed by ion chromatography at McGill (figures 54 and 55).
During the INETER field monitoring that took place on 22 May 2017, strong convection of the lake was observed, as were landslides on almost all of the walls. Fumaroles were seen that are possibly not new, but were active due to recent rainfall. The landslides on the W wall of the crater have been occurring since the end of February (figure 56). They are believed by INETER to be caused by undercutting of the walls by lava lake convection (figure 57).
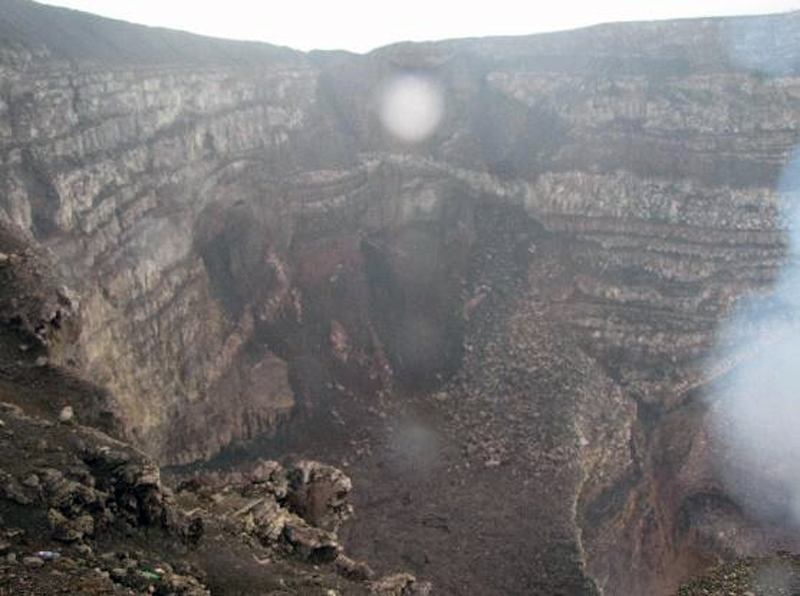 |
Figure 56. Collapse on the W wall of Santiago crater at Masaya reported by Park rangers on 15 May 2017. Courtesy of INETER (Boletín mensual Sismos y Volcanes de Nicaragua. Mayo, 2017). |
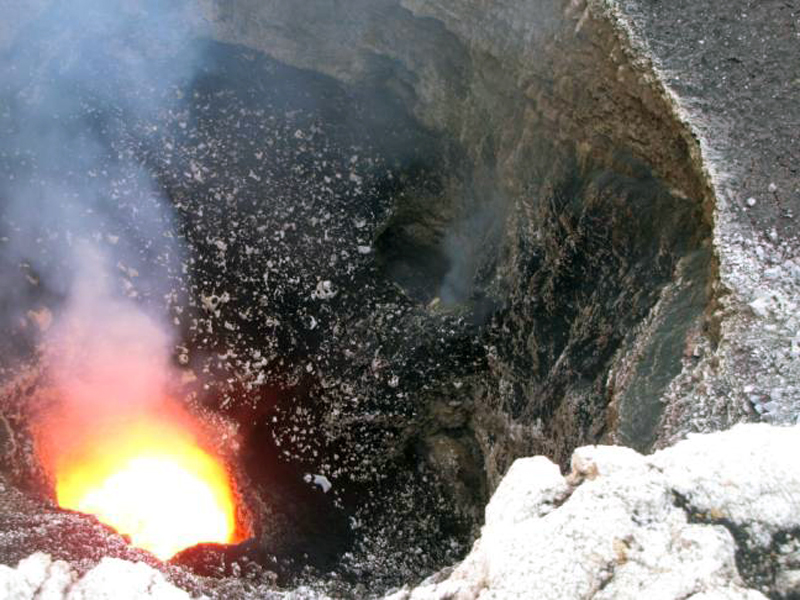 |
Figure 57. Lava lake in Santiago crater of Masaya in May 2017. Courtesy of INETER (Boletín mensual Sismos y Volcanes de Nicaragua. Mayo, 2017). |
References. Rymer, H., van Wyk de Vries, B., Stix, J., and Williams-Jones, G., 1998, Pit crater structure and processes governing persistent activity at Masaya Volcano, Nicaragua. Bull. Volcanol., v. 59, pp. 345-355.
Information Contacts: Instituto Nicaragüense de Estudios Territoriales (INETER), Apartado Postal 2110, Managua, Nicaragua (URL: http://webserver2.ineter.gob.ni/vol/dep-vol.html); MIROVA (Middle InfraRed Observation of Volcanic Activity), a collaborative project between the Universities of Turin and Florence (Italy) supported by the Centre for Volcanic Risk of the Italian Civil Protection Department (URL: http://www.mirovaweb.it/); Hawai'i Institute of Geophysics and Planetology (HIGP) - MODVOLC Thermal Alerts System, School of Ocean and Earth Science and Technology (SOEST), Univ. of Hawai'i, 2525 Correa Road, Honolulu, HI 96822, USA (URL: http://modis.higp.hawaii.edu/); Washington Volcanic Ash Advisory Center (VAAC), Satellite Analysis Branch (SAB), NOAA/NESDIS OSPO, NOAA Science Center Room 401, 5200 Auth Rd, Camp Springs, MD 20746, USA (URL: http://www.ospo.noaa.gov/Products/atmosphere/vaac/, archive at: http://www.ssd.noaa.gov/VAAC/archive.html); Sistema Nacional para la Prevencion, Mitigacion y Atencion de Desastres, (SINAPRED), Edificio SINAPRED, Rotonda Comandante Hugo Chávez 50 metros al Norte, frente a la Avenida Bolívar, Managua, Nicaragua (URL: http://www.sinapred.gob.ni/).
Lava lake persists during July 2017-April 2018
Nicaragua's Volcan Masaya has an intermittent lava lake that has attracted visitors since the time of the Spanish Conquistadores; tephrochronology has dated eruptions back several thousand years. The unusual basaltic caldera has had historical explosive eruptions in addition to lava flows and actively circulating magma at the lava lake. An explosion in 2012 ejected ash to several hundred meters above the volcano, bombs as large as 60 cm fell around the crater, and ash fell to a thickness of 2 mm in some areas of the park. Brief incandescence and thermal anomalies of uncertain origin in April 2013 were followed by very little activity until the reemergence of the lava lake inside Santiago crater was reported in December 2015. By late March 2016 the lava lake had grown and intensified enough to generate a significant thermal anomaly signature (BGVN 41:08, figure 49) which persisted at a constant power level through April 2017 (BGVN 42:09, figure 53) with an increase in the number of thermal anomalies from November 2016 through April 2017. Although the MIROVA thermal anomaly signal decreased slightly in intensity during May 2017, INETER scientists reported continued strong convection at the lava lake. Similar activity continued throughout July 2017-April 2018 and is covered in this report with information provided by the Instituto Nicareguense de Estudios Territoriales (INETER) and satellite thermal data.
A persistent thermal signature in the MIROVA data during July 2017-April 2018 supported the visual observations of the active lava lake at the summit throughout this period (figure 58). MODVOLC thermal alerts were also issued every month, with the number of alerts ranging from a high of 17 in November 2017 to a low of six in April 2018.
INETER made regular visits to the summit most months in coordination with specialists from several universities to gather SO2 data; CO2, H2S and gravity measurements were also taken during specific site visits. Thermal measurements around the lava lake inside Santiago crater taken on 24 February 2018 indicated temperatures ranging from 210-389°C. Seismicity remained very low throughout the period. The lava lake was actively convecting each time it was visited, and Pele's hair was abundant around the summit area (figures 59-64).
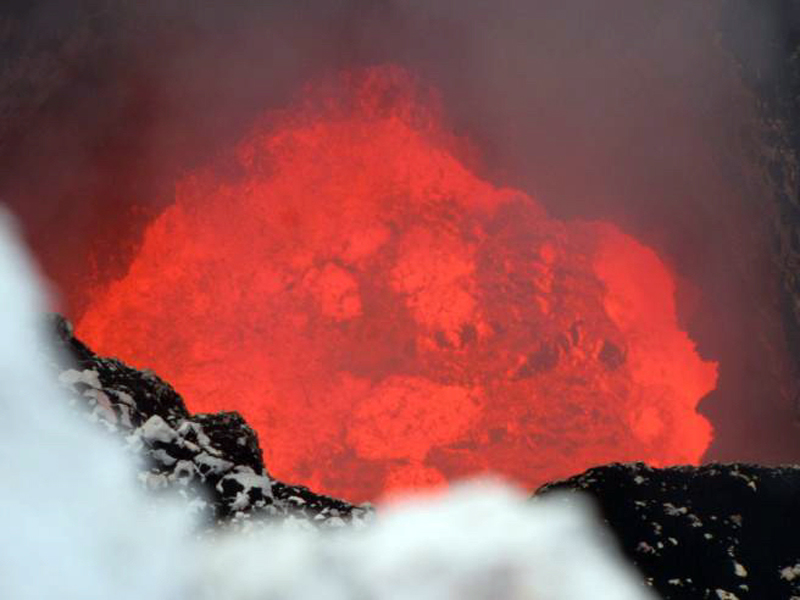 |
Figure 59. The lava lake at Masaya was actively convecting on 22 August 2017 when observed by INETER scientists. Courtesy of INETER (Boletín Sismos y Volcanes de Nicaragua. Agosto, 2017). |
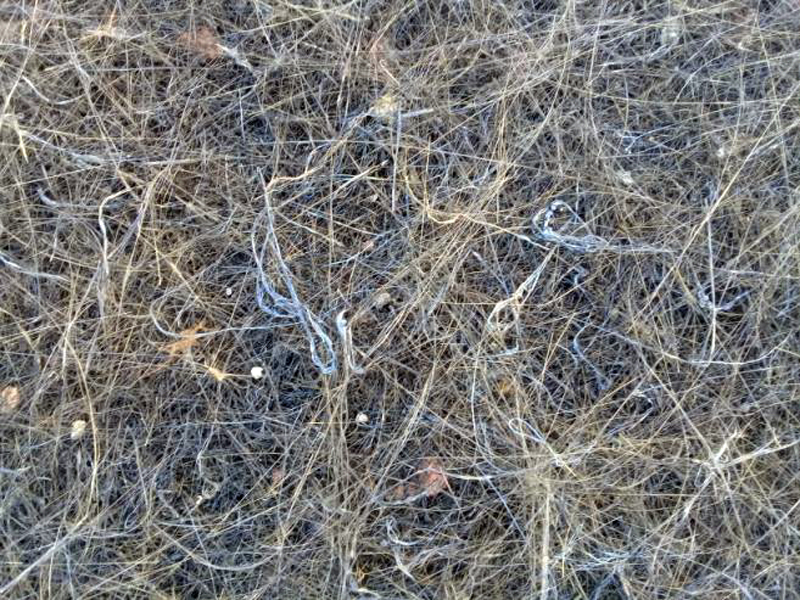 |
Figure 60. Pele's hair near the summit of Masaya on 22 August 2017. Scale is likely a few tens of centimeters. Courtesy of INETER (Boletín Sismos y Volcanes de Nicaragua. Agosto, 2017). |
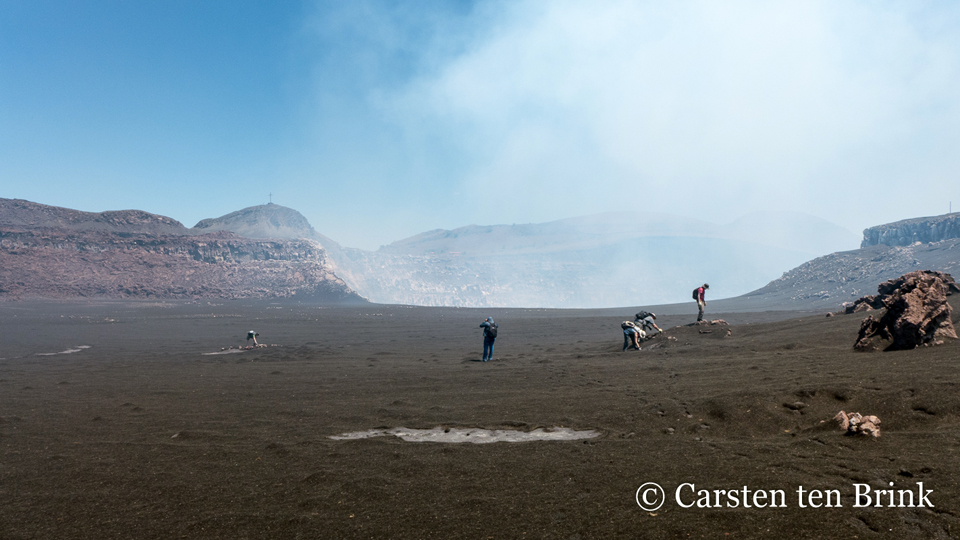 |
Figure 63. Nindiri plateau, the broad, flat area inside the summit crater of Masaya, was covered with Pele's hair and basaltic tephra on 6 March 2018. Courtesy of Carsten ten Brink. |
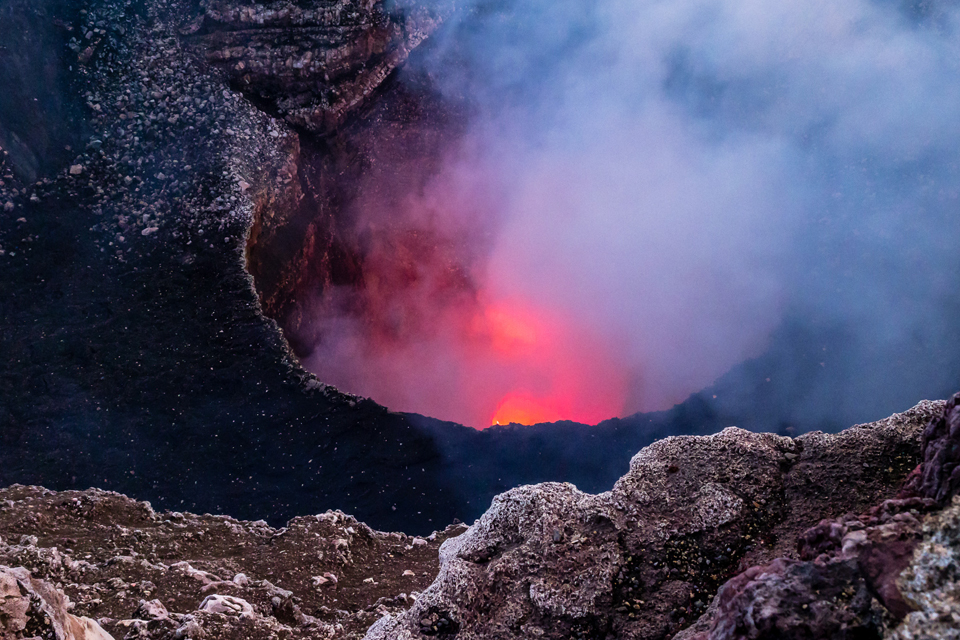 |
Figure 64. The lava lake inside Santiago crater at Masaya was actively convecting on 1 April 2018. Courtesy of Alexander Schimmeck. |
Information Contacts: Instituto Nicaragüense de Estudios Territoriales (INETER), Apartado Postal 2110, Managua, Nicaragua (URL: http://www.ineter.gob.ni/); MIROVA (Middle InfraRed Observation of Volcanic Activity), a collaborative project between the Universities of Turin and Florence (Italy) supported by the Centre for Volcanic Risk of the Italian Civil Protection Department (URL: http://www.mirovaweb.it/); Hawai'i Institute of Geophysics and Planetology (HIGP) - MODVOLC Thermal Alerts System, School of Ocean and Earth Science and Technology (SOEST), Univ. of Hawai'i, 2525 Correa Road, Honolulu, HI 96822, USA (URL: http://modis.higp.hawaii.edu/); Alexander Schimmeck, flickr (URL: https://www.flickr.com/photos/alschim/), photo used under Creative Commons license Attribution-NonCommercial-NoDerivs 2.0 Generic (CC BY-NC-ND 2.0) (URL: https://creativecommons.org/licenses/by-nc-nd/2.0/); Carsten ten Brink, flickr (URL: https://www.flickr.com/photos/carsten_tb/), photo used under Creative Commons license Attribution-NonCommercial-NoDerivs 2.0 Generic (CC BY-NC-ND 2.0) (URL: https://creativecommons.org/licenses/by-nc-nd/2.0/).
Lava lake activity continued from May through October 2018; lava lake lower than recent months
Masaya is one of the most active volcanoes in Nicaragua and one of the few volcanoes on Earth to contain an active lava lake. The edifice has a caldera that contains the Masaya (also known as San Fernando), Nindirí, San Pedro, San Juan, and Santiago (currently active) craters. In recent years, activity has largely consisted of lava lake activity along with dilute plumes of gas with little ash. In 2012 an explosive event ejected ash and blocks. This report summarizes activity during May through October 2018 and is based on Instituto Nicaragüense de Estudios Territoriales (INETER) reports and satellite data.
Reports issued from May through July 2018 noted that Masaya remained relatively calm. Sentinel-2 thermal satellite images show consistently high temperatures in the Santiago crater with the active lava lake present (figure 65).
Reports from August through October 2018 indicated relatively low levels of activity. On 28 September the lava lake within the Santiago crater was observed with a lower surface than previous months. Fumarole temperatures up to 340°C were recorded (figure 66). Sentinel-2 thermal images show the large amount of heat consistently emanating from the active lava lake (figure 67). Sulfur dioxide was measured on 28 and 30 August with an average of 1,462 tons per day, a higher value than the average of 858 tons per day detected in February. Sulfur dioxide levels ranged from 967 to 1,708 tons per day on 11 September.
Overall, activity from May through October 2018 was relatively quiet with continued lava lake activity. The thermal energy detected by the MIROVA algorithm showed fluctuations but were consistent (figure 68). The MODVOLC algorithm for near-real-time thermal monitoring of global hotspots detected 4-8 anomalies per month for this period, which is lower than previous years (figure 69).
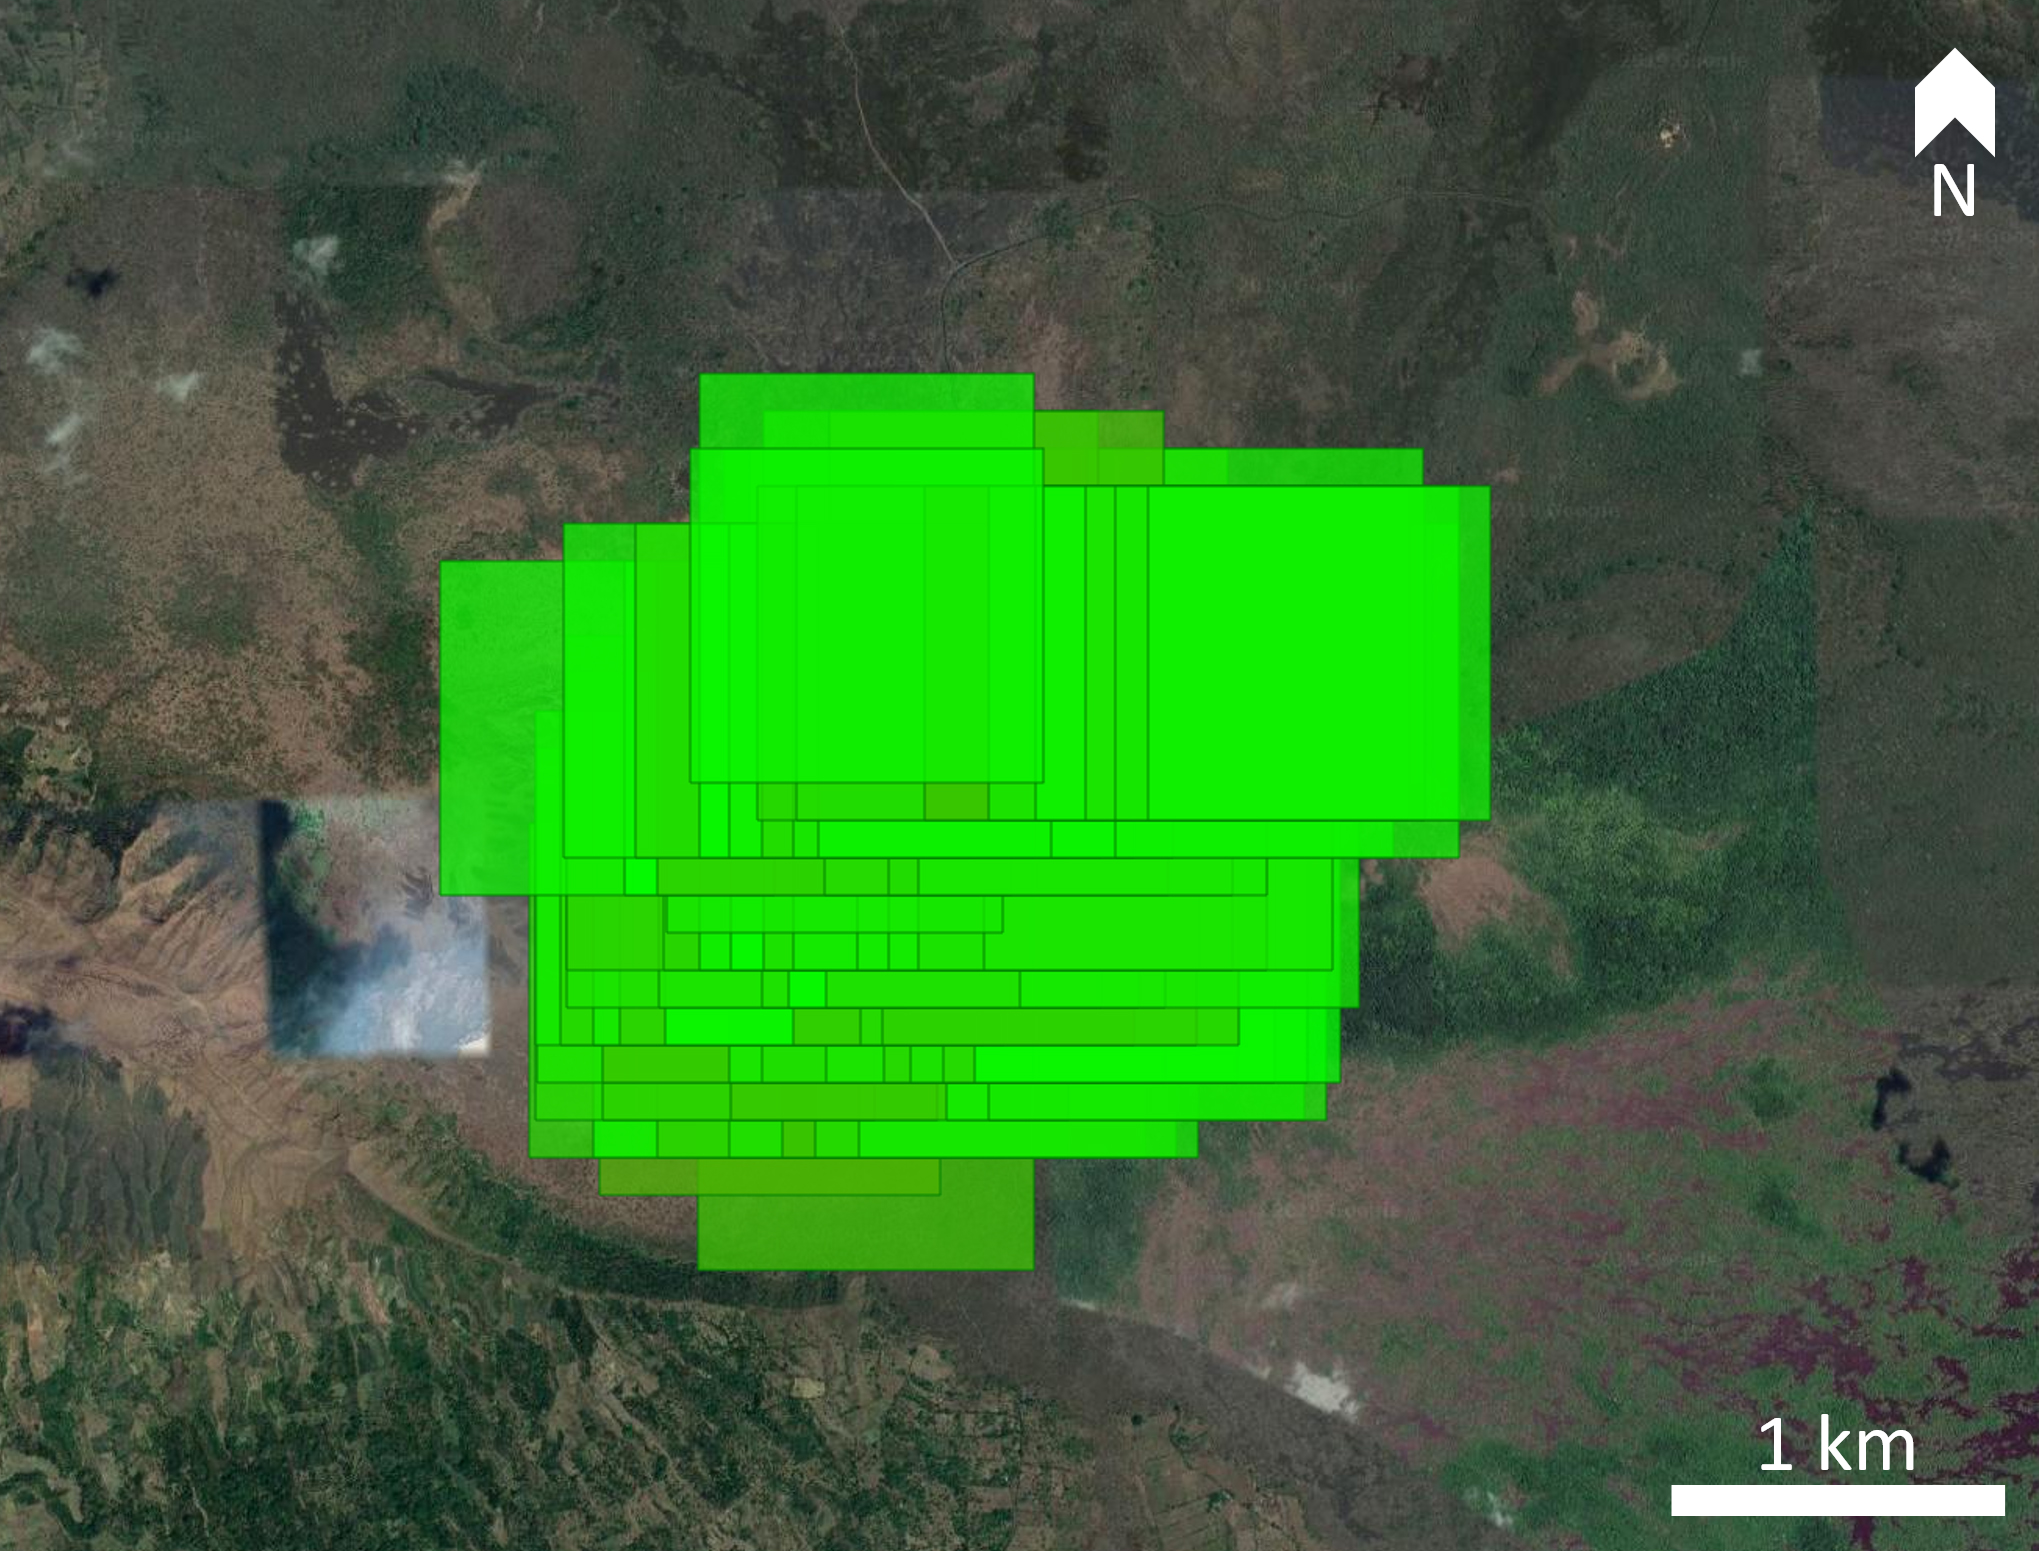 |
Figure 69. Thermal alerts for Masaya in May through October 2018. Courtesy of HIGP - MODVOLC Thermal Alerts System. |
Information Contacts: Instituto Nicaragüense de Estudios Territoriales (INETER), Apartado Postal 2110, Managua, Nicaragua (URL: http://webserver2.ineter.gob.ni/vol/dep-vol.html); Sentinel Hub Playground (URL: https://www.sentinel-hub.com/explore/sentinel-playground); Hawai'i Institute of Geophysics and Planetology (HIGP) - MODVOLC Thermal Alerts System, School of Ocean and Earth Science and Technology (SOEST), Univ. of Hawai'i, 2525 Correa Road, Honolulu, HI 96822, USA (URL: http://modis.higp.hawaii.edu/); MIROVA (Middle InfraRed Observation of Volcanic Activity), a collaborative project between the Universities of Turin and Florence (Italy) supported by the Centre for Volcanic Risk of the Italian Civil Protection Department (URL: http://www.mirovaweb.it/).
Lava lake persists with decreased thermal output, November 2018-February 2019
Nicaragua's Volcan Masaya has an intermittent lava lake that has attracted visitors since the time of the Spanish Conquistadores; tephrochronology has dated eruptions back several thousand years. The unusual basaltic caldera has had historical explosive eruptions in addition to lava flows and an actively circulating lava lake. An explosion in 2012 ejected ash to several hundred meters above the volcano, bombs as large as 60 cm fell around the crater, and ash fell to a thickness of 2 mm in some areas of the park. The reemergence of the lava lake inside Santiago crater was reported in December 2015. By late March 2016 the lava lake had grown and intensified enough to generate a significant thermal anomaly signature which has varied in strength but continued at a moderate level into early 2019. Information for this report, which covers the period from November 2018 through February 2019, is provided by the Instituto Nicareguense de Estudios Territoriales (INETER) and satellite -based imagery and thermal data.
The lava lake in Santiago Crater remained visible and active throughout November 2018 to February 2019 with little change from the previous few months (figure 70). Seismic amplitude RSAM values remained steady, oscillating between 10 and 40 RSAM units during the period.
Every few months INETER carries out SO2 measurements by making a transect using a mobile DOAS spectrometer that samples for gases downwind of the volcano. Transects were done on 9-10 October 2018, 21-24 January 2019, and 18-21 February 2019 (figure 71). Average values during the October transect were 1,454 tons per day, in January they were 1,007 tons per day, and in February they averaged 1,318 tons per day, all within a typical range of values for the last several months.
During a visit by INETER technicians in early November 2018, the lens of the Mirador 1 webcam, that had water inside it and had been damaged by gases, was cleaned and repaired. During 21-24 January 2019 INETER made a site visit with scientists from the University of Johannes Gutenberg in Mainz, Germany, to measure halogen species in gas plumes, and to test different sampling techniques for volcanic gases, including through spectroscopic observations with DOAS equipment, in-situ gas sampling (MultiGAS, denuders, alkaline traps), and using a Quadcopter UAV (drone) sampling system.
Periodic measurements of CO2 from the El Comalito crater have been taken by INETER for many years. The most recent observations on 19 February 2019 indicated an emission rate of 46 ± 3 tons per day of CO2, only slightly higher than the average value over 16 measurements between 2008 and 2019 (figure 72).
Satellite imagery (figure 73) and in-situ thermal measurements during November 2018-February 2019 indicated constant activity at the lava lake and no significant changes during the period. On 14 January 2019 temperatures were measured with the FLIR SC620 thermal camera, along with visual observations of the crater; abundant gas was noted, and no explosions from the lake were heard. The temperature at the lava lake was measured at 107°C, much cooler than the 340°C measured in September 2018 (figure 74).
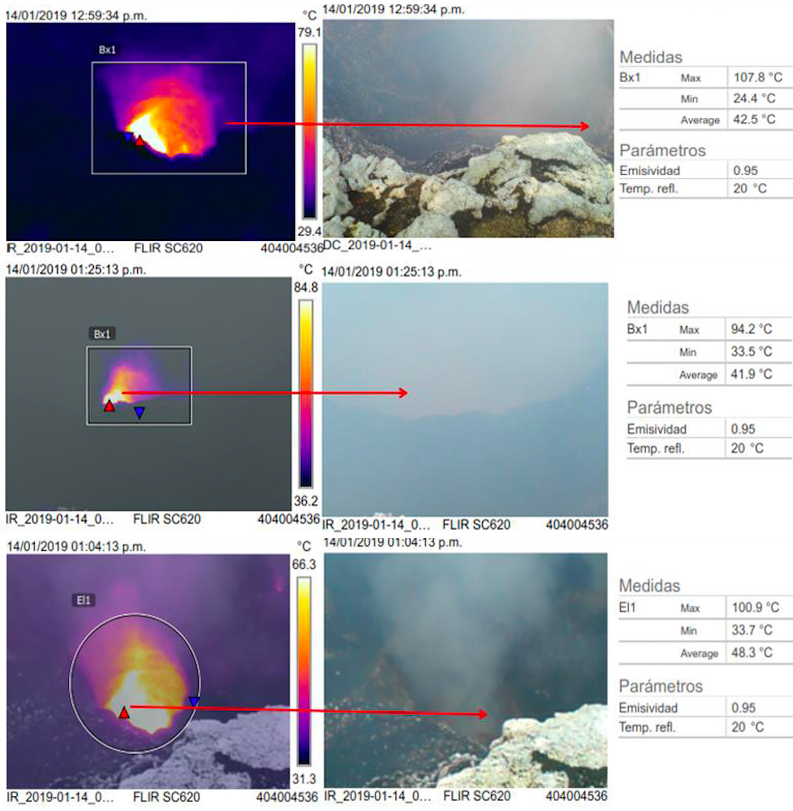 |
Figure 74. Thermal measurements were made at Masaya on 14 January 2019 with a FLIR SC620 thermal camera that indicated temperatures over 200°C cooler than similar measurements made in September 2018. |
Thermal anomaly data from satellite instruments also confirmed moderate levels of ongoing thermal activity. The MIROVA project plot indicated activity throughout the period (figure 75), and a plot of the number of MODVOLC thermal alerts by month since the lava lake first appeared in December 2015 suggests constant activity at a reduced thermal output level from the higher values in early 2017 (figure 76).
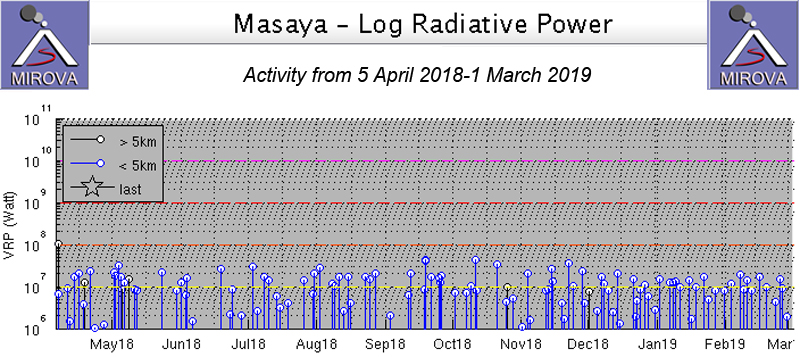 |
Figure 75. Thermal anomalies remained constant at Masaya during November 2018-February 2019 as recorded by the MIROVA project. Courtesy of MIROVA. |
Information Contacts: Instituto Nicaragüense de Estudios Territoriales (INETER), Apartado Postal 2110, Managua, Nicaragua (URL: http://www.ineter.gob.ni/); MIROVA (Middle InfraRed Observation of Volcanic Activity), a collaborative project between the Universities of Turin and Florence (Italy) supported by the Centre for Volcanic Risk of the Italian Civil Protection Department (URL: http://www.mirovaweb.it/); Hawai'i Institute of Geophysics and Planetology (HIGP) - MODVOLC Thermal Alerts System, School of Ocean and Earth Science and Technology (SOEST), Univ. of Hawai'i, 2525 Correa Road, Honolulu, HI 96822, USA (URL: http://modis.higp.hawaii.edu/); Sentinel Hub Playground (URL: https://www.sentinel-hub.com/explore/sentinel-playground); Alun Ebenezer (Twitter: @AlunEbenezer, URL: https://twitter.com/AlunEbenezer).
Lava lake activity declined during March-July 2019
Masaya, in Nicaragua, contains a lava lake found in the Santiago Crater which has remained active since its return in December 2015 (BGVN 41:08). In addition to this lava lake, previous volcanism included explosive eruptions, lava flows, and gas emissions. Activity generally decreased during March-July 2019, including the number and frequency of thermal anomalies, lava lake levels, and gas emissions. The primary source of information for this report comes from the Instituto Nicareguense de Estudios Territoriales (INETER).
On 21 July 2019 a small explosion in the Santiago Crater resulted in some gas emissions and an ash cloud drifting WNW. In addition to the active lava lake (figure 77), monthly reports from INETER noted that thermal activity and gas emissions (figure 78) were decreasing.
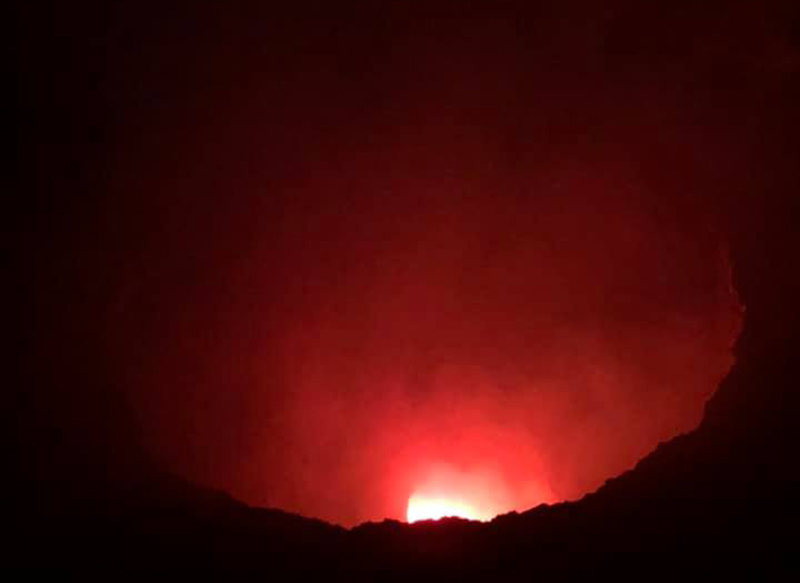 |
Figure 77. Active lava lake visible in the Santiago Crater at Masaya on 27 June 2019. Photo by Sheila DeForest (Creative Commons BY-SA license). |
 |
Figure 78. Gas emissions coming from the Santiago Crater at Masaya on 29 June 2019. Photo by Sheila DeForest (Creative Commons BY-SA license). |
On 15 May and 22 July 2019, INETER scientists used a FLIR SC620 thermal infrared camera to measure temperatures of fumaroles on the Santiago Crater. In May 2019 the temperature of fumaroles had decreased by 48°C since the previous month. Between May and July 2019 fumarole temperatures continued to decline; temperatures ranged from 90° to 136°C (figure 79). Compared to May 2019 these temperatures are 3°C lower. INETER reports that the level of the lava lake has been slowly dropping during this reporting period.
According to MIROVA (Middle InfraRed Observation of Volcanic Activity) data from MODIS satellite instruments, frequent thermal anomalies were recorded from mid-March through early May 2019, with little to no activity from mid-May to July 2019 (figure 80). Sentinel-2 thermal images show high temperatures in the active lava lake on 10 March 2019 (figure 81). Thermal energy detected by the MODVOLC algorithm showed 14 hotspot pixels with the most number of hotspots (7) occurring in March 2019.
Information Contacts: Instituto Nicaragüense de Estudios Territoriales (INETER), Apartado Postal 2110, Managua, Nicaragua (URL: http://www.ineter.gob.ni/); MIROVA (Middle InfraRed Observation of Volcanic Activity), a collaborative project between the Universities of Turin and Florence (Italy) supported by the Centre for Volcanic Risk of the Italian Civil Protection Department (URL: http://www.mirovaweb.it/); Hawai'i Institute of Geophysics and Planetology (HIGP) - MODVOLC Thermal Alerts System, School of Ocean and Earth Science and Technology (SOEST), Univ. of Hawai'i, 2525 Correa Road, Honolulu, HI 96822, USA (URL: http://modis.higp.hawaii.edu/); Sentinel Hub Playground (URL: https://www.sentinel-hub.com/explore/sentinel-playground); Sheila DeForest (URL: https://www.facebook.com/sheila.deforest).
Lava lake persists with lower temperatures during August 2019-January 2020
Masaya is a basaltic caldera located in Nicaragua and contains the Nindirí, San Pedro, San Juan, and Santiago craters. The currently active Santiago crater hosts a lava lake, which has remained active since December 2015 (BGVN 41:08). The primary source of information for this August 2019-January 2020 report comes from the Instituto Nicareguense de Estudios Territoriales (INETER) and satellite -based imagery and thermal data.
On 16 August, 13 September, and 11 November 2019, INETER took SO2 measurements by making a transect using a mobile DOAS spectrometer that sampled for gases downwind of the volcano. Average values during these months were 2,095 tons/day, 1,416 tons/day, and 1,037 tons/day, respectively. August had the highest SO2 measurements while those during September and November were more typical values.
Satellite imagery showed a constant thermal anomaly in the Santiago crater at the lava lake during August 2019 through January 2020 (figure 82). According to a news report, ash was expelled from Masaya on 15 October 2019, resulting in minor ashfall in Colonia 4 de Mayo (6 km NW). On 21 November thermal measurements were taken at the fumaroles and near the lava lake using a FLIR SC620 thermal camera (figure 83). The temperature measured 287°C, which was 53° cooler than the last time thermal temperatures were taken in May 2019.
MIROVA (Middle InfraRed Observation of Volcanic Activity) analysis of MODIS satellite data showed intermittent low-power thermal anomalies compared to the higher-power ones before May 2019 (figure 84). The thermal anomalies were detected during August 2019 through January 2020 after a brief hiatus from early may to mid-June.
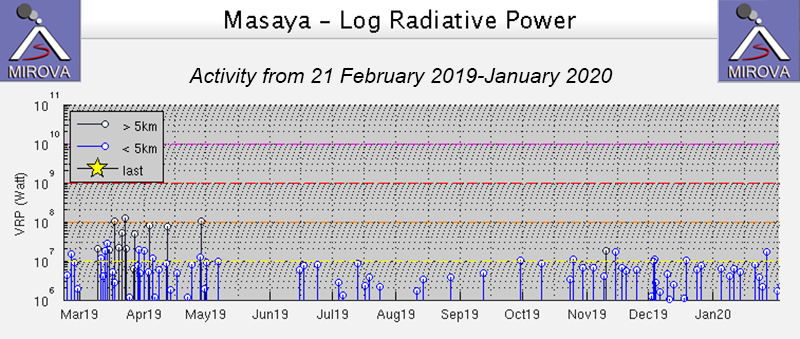 |
Figure 84. Thermal anomalies occurred intermittently at Masaya during 21 February 2019 through January 2020. Courtesy of MIROVA. |
Information Contacts: Instituto Nicaragüense de Estudios Territoriales (INETER), Apartado Postal 2110, Managua, Nicaragua (URL: http://www.ineter.gob.ni/); MIROVA (Middle InfraRed Observation of Volcanic Activity), a collaborative project between the Universities of Turin and Florence (Italy) supported by the Centre for Volcanic Risk of the Italian Civil Protection Department (URL: http://www.mirovaweb.it/); Sentinel Hub Playground (URL: https://www.sentinel-hub.com/explore/sentinel-playground); La Jornada (URL: https://www.lajornadanet.com/, article at https://www.lajornadanet.com/index.php/2019/10/16/volcan-masaya-expulsa-cenizas/#.Xl6f8ahKjct).
Lava lake level drops but remains active through May 2020; weak gas plumes
Masaya, which is about 20 km NW of the Nicaragua’s capital of Managua, is one of the most active volcanoes in that country and has a caldera that contains a number of craters (BGVN 43:11). The Santiago crater is the one most currently active and it contains a small lava lake that emits weak gas plumes (figure 85). This report summarizes activity during February through May 2020 and is based on Instituto Nicaragüense de Estudios Territoriales (INETER) monthly reports and satellite data. During the reporting period, the volcano was relatively calm, with only weak gas plumes.
According to INETER, thermal images of the lava lake and temperature data in the fumaroles were taken using an Omega infrared gun and a forward-looking infrared (FLIR) SC620 thermal camera. The temperatures above the lava lake have decreased since November 2019, when the temperature was 287°C, dropping to 96°C when measured on 14 May 2020. INETER attributed this decrease to subsidence in the level of the lava lake by 5 m which obstructed part of the lake and concentrated the gas emissions in the weak plume. Convection continued in the lava lake, which in May had decreased to a diameter of 3 m. Many landslides had occurred in the E, NE, and S walls of the crater rim due to rock fracturing caused by the high heat and acidity of the emissions.
During the reporting period, the MIROVA (Middle InfraRed Observation of Volcanic Activity) volcano hotspot detection system recorded numerous thermal anomalies from the lava lake based on MODIS data (figure 86). Infrared satellite images from Sentinel-2 regularly showed a strong signature from the lava lake through 18 May, after which the volcano was covered by clouds.
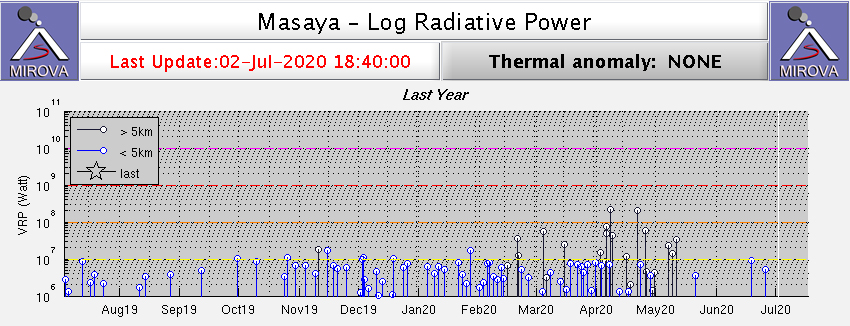 |
Figure 86. Thermal anomalies at Masaya during February through May 2020. The larger anomalies with black lines are more distant and not related to the volcano. Courtesy of MIROVA. |
Measurements of sulfur dioxide (SO2) made by INETER in the section of the Ticuantepe - La Concepción highway (just W of the volcano) with a mobile DOAS system varied between a low of just over 1,000 metric tons/day in mid-November 2019 to a high of almost 2,500 tons/day in late May. Temperatures of fumaroles in the Cerro El Comalito area, just ENE of Santiago crater, ranged from 58 to 76°C during February-May 2020, with most values in the 69-72°C range.
Information Contacts: Instituto Nicaragüense de Estudios Territoriales (INETER), Apartado Postal 2110, Managua, Nicaragua (URL: http://www.ineter.gob.ni/); MIROVA (Middle InfraRed Observation of Volcanic Activity), a collaborative project between the Universities of Turin and Florence (Italy) supported by the Centre for Volcanic Risk of the Italian Civil Protection Department (URL: http://www.mirovaweb.it/); Sentinel Hub Playground (URL: https://www.sentinel-hub.com/explore/sentinel-playground).
Lava lake continues accompanied by gas-and-steam emissions during June-November 2020
Masaya, located in Nicaragua, includes the Nindirí, San Pedro, and San Juan craters, as well as the currently active Santiago crater. The Santiago crater has contained an active lava lake since December 2015 (BGVN 41:08), and often produces gas-and-steam emissions. Similar activity is described in this report which updates information from June through November 2020 using reports from the Instituto Nicareguense de Estudios Territoriales (INETER) and various satellite data.
Volcanism at Masaya has been relatively quiet and primarily characterized by an active lava lake and gas-and-steam emissions. From January to November 2020 there were 8,551 seismic events recorded. A majority of these events were described as low-frequency earthquakes, though a few were classified as volcano-tectonic. MIROVA (Middle InfraRed Observation of Volcanic Activity) analysis of MODIS satellite data showed few low-power thermal anomalies during June through November (figure 87). A small cluster of low-power thermal activity was detected in July and consisted of seven thermal anomalies out of a total of thirteen thermal anomalies recorded during the reporting period. Thermal activity was also observed in Sentinel-2 satellite imagery, which showed a constant thermal anomaly in the Santiago crater at the lava lake during July through October, occasionally accompanied by a gas-and-steam plume (figure 88). Small and intermittent sulfur dioxide emissions appeared in satellite data during each month of the reporting period, excluding July, some of which exceeded two Dobson Units (DU) (figure 89). On 6 July, 11 and 13 August, 7 September, during October, and 9 and 13 November, INETER scientists took SO2 measurements by making several transects using a mobile DOAS spectrometer that sampled for gases downwind of the volcano. Average values during these months were 1,202 tons/day (t/d), 1,383 t/d, 2,089 t/d, 950 t/d, and 819 t/d, respectively, with the highest average reported in September.
During June and July persistent gas-and-steam emissions were reported rising above the open lava lake in the Santiago crater (figure 90). On 20 June INETER scientists measured the gases on the S side, inside the Nindirí crater (SW side), and La Cruz (NW side). A perceptible gas-and-steam plume was noted rising above the Nindirí crater and drifting W. Crater wall collapses were observed on the E wall of the Santiago crater; the lava lake remained, but the level of the lake had decreased compared to previous months. During July, thermal measurements were taken of the fumaroles and near the lava lake using a FLIR SC620 thermal camera. INETER reported that the temperature measured 576°C, which had significantly increased from 163°C noted in the previous month.
Small crater wall collapses were detected on the NW and E wall of the Santiago crater, accompanied by abundant gas-and-steam emissions during August (figure 91). On 7 August thermal measurements were taken of the fumaroles and near the lava lake, which showed another temperature increase to 771°C. Continuous collapse of the crater walls began to excavate depressions in the crater floor and along the walls. Similar activity was observed in September with abundant gas-and-steam emissions in the Santiago crater, as well as collapses of the E wall (figure 91). Temperature measurements taken during this month had decreased slightly compared to August, to 688°C.
Activity in October and November remained consistent with continued wall collapses in the Santiago crater, particularly on the S and E wall, due to fractures in the rocks and erosion, accompanied by gas-and-steam emissions. INETER reported that the level of the lava lake had decreased due to continuous internal wall collapses, which had caused some obstruction in the lava lake and allowed for material to accumulate within the crater. On 9 October thermal measurements were taken of the fumaroles and near the lava lake using a FLIR SC620 thermal camera (figure 92). The temperature had increased again compared to September, to 823°C. By 26 November, the temperature had decreased slightly to 800°C, though activity remained similar.
Information Contacts: Instituto Nicaragüense de Estudios Territoriales (INETER), Apartado Postal 2110, Managua, Nicaragua (URL: http://www.ineter.gob.ni/); MIROVA (Middle InfraRed Observation of Volcanic Activity), a collaborative project between the Universities of Turin and Florence (Italy) supported by the Centre for Volcanic Risk of the Italian Civil Protection Department (URL: http://www.mirovaweb.it/); NASA Global Sulfur Dioxide Monitoring Page, Atmospheric Chemistry and Dynamics Laboratory, NASA Goddard Space Flight Center (NASA/GSFC), 8800 Greenbelt Road, Goddard, Maryland, USA (URL: https://so2.gsfc.nasa.gov/); Sentinel Hub Playground (URL: https://www.sentinel-hub.com/explore/sentinel-playground).
Lava lake remains active accompanied by gas-and-steam emissions during December 2020-May 2021
Masaya is a 6.5 x 11.5 km caldera located about 20 km SE of Managua, the capital of Nicaragua, and includes the Nindirí, San Pedro, San Juan, and the currently active Santiago craters. Its current eruption period began in October 2015 and has been characterized primarily by an active lava lake and occasional gas-and-steam emissions (BGVN 45:12). This report updates activity during December 2020 through May 2021 using information from the Instituto Nicareguense de Estudios Territoriales (INETER) and various satellite data.
Thermal activity was consistent throughout the reporting period due to the active lava lake in the Santiago crater. MIROVA (Middle InfraRed Observation of Volcanic Activity) analysis of MODIS satellite data showed intermittent low-power thermal anomalies during December 2020 through May 2021 (figure 93). This thermal activity was also observed in Sentinel-2 infrared thermal imagery, which was represented by a bright yellow-orange thermal anomaly in the Santiago crater’s lava lake (figure 94). Small and intermittent sulfur dioxide emissions that drifted generally W were also observed during February through May based on data from the TROPOMI instrument on the Sentinel-5P satellite (figure 95). These SO2 emissions were also measured each month based on several transects using a mobile DOAS spectrometer.
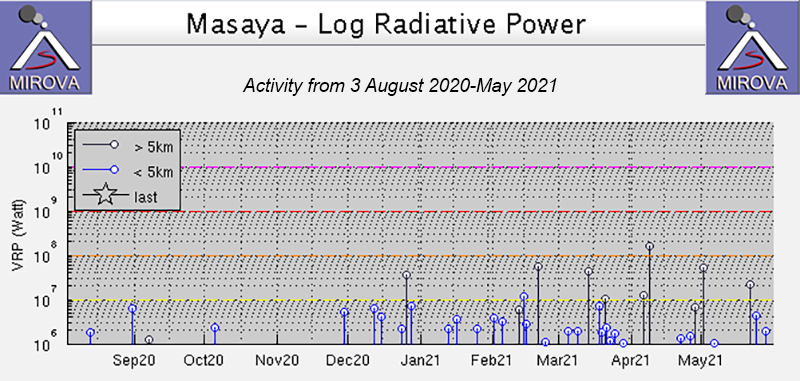 |
Figure 93. Intermittent low-power thermal anomalies were detected at Masaya between December 2020 through May 2021, as shown on this MIROVA graph (Log Radiative Power). Courtesy of MIROVA. |
Volcanism was relatively low during the reporting period, with an active lava lake, white gas-and-steam emissions, and seismic events that included low-frequency (LF) and volcano-tectonic (VT) earthquakes. In December 2020 a total of 9,113 seismic events were detected, a majority of which were described as low-frequency events.
During January 2021 seismicity continued, with 23,291 LF events recorded at a constant 150 RSAM units. INETER scientists took SO2 measurements by making several transects using a mobile DOAS spectrometer that sampled for gases downwind of the volcano. The average value taken on 18 and 22 January was 1,088 tons/day, which was higher than values of 819 tons/day in November 2020. On 22 January thermal images of the active lava lake in the Santiago crater were taken to measure the temperature with a FLIR SC620 thermal camera. The temperature was 841°C, an increase of 83°C since the previous measurements in November. Some crater wall collapses on the E side were noted due to rock fractures and erosion.
Activity in February was similar with seismic events measuring around 150 RSAM units and according to INETER, the lava lake had decreased significantly; crater walls continued to frequently collapse. Fumaroles were commonly visible in the crater (figure 96). On 8 February thermal images of the Santiago crater showed temperatures of 338.7°C. SO2 measurements from 18 February averaged 1,466 tons/day, which was slightly higher than January.
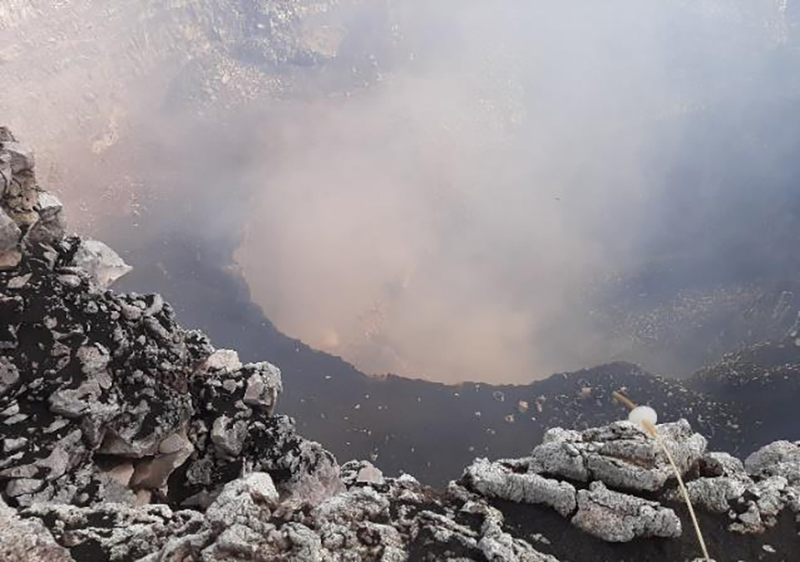 |
Figure 96. Photo of gas-and-steam emissions in the Santiago crater at Masaya during February 2021. Courtesy of INETER (Boletín Sismológico, Vulcanológico y Geológico Febrero, 2021). |
Seismicity continued in March, measuring between 200 and 250 RSAM units, as well as consistent gas-and-steam emissions. On 9 March SO2 measurements were an average of 1,423 tons/day. Temperature measurements were taken on 19 and 23 March; it had increased slightly to 903 °C, though the lava lake level remained low (figure 97). Landslides were observed on the E wall of the Santiago crater.
During April the seismicity maintained 100-150 RSAM units; 14,505 small events were detected, seven of which were volcano-tectonic (VT), and the rest were LF events. New temperature measurements were taken on 8 and 9 April using thermal images and visual observations. The temperature had decreased to 797°C, which suggested that the level of the lava lake had also dropped. Collapses continued to be reported on the E crater wall. The lava lake level had increased, as well as the volume of high temperature volatiles, generating crater wall and crater floor collapses. The average SO2 values this month were 1,732 tons/day, higher than March.
Similar activity continued in May with 14,505 seismic events ranging 300-350 RSAM units, seven of which were VT events, and the rest being LF events. Temperature measurements taken on 3 May were 1,212.4°C, a significant 415°C increase compared to April (figure 98). Some internal wall collapses were reported on the S wall, as well as some subsidence as the lava lake levels declined (figure 99). On 11 and 15 May SO2 measurements were taken and were an average of 1,483 tons/day.
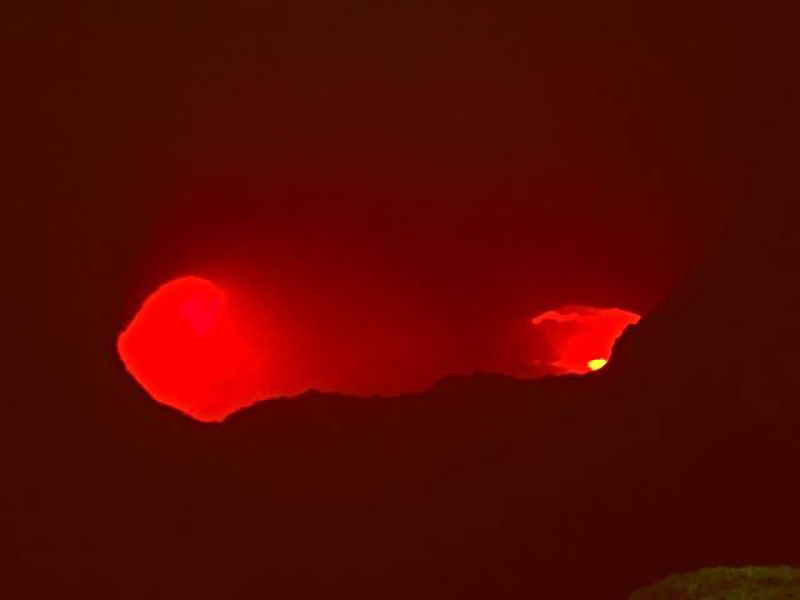 |
Figure 99. Photo of the active and incandescent lava lake at Masaya on 3 May 2021 taken from a distance of 80 m. Courtesy of INETER (Boletín Sismológico, Vulcanológico y Geológico Mayo, 2021). |
Information Contacts: Instituto Nicaragüense de Estudios Territoriales (INETER), Apartado Postal 2110, Managua, Nicaragua (URL: http://www.ineter.gob.ni/); MIROVA (Middle InfraRed Observation of Volcanic Activity), a collaborative project between the Universities of Turin and Florence (Italy) supported by the Centre for Volcanic Risk of the Italian Civil Protection Department (URL: http://www.mirovaweb.it/); NASA Global Sulfur Dioxide Monitoring Page, Atmospheric Chemistry and Dynamics Laboratory, NASA Goddard Space Flight Center (NASA/GSFC), 8800 Greenbelt Road, Goddard, Maryland, USA (URL: https://so2.gsfc.nasa.gov/); Sentinel Hub Playground (URL: https://www.sentinel-hub.com/explore/sentinel-playground).
Active lava lake and gas-and-steam emissions persist during June-December 2021
Masaya, located about 20 km SE of Managua, the capital of Nicaragua, contains a 6.5 x 11.5 km caldera with the Nindirí, San Pedro, San Juan, and the currently active Santiago craters. The current eruption period began in October 2015 and has recently consisted of an active lava lake and gas-and-steam emissions (BGVN 46:06). This report covers similar activity during June through December 2021, characterized by a declining lava lake level and gas-and-steam emissions, using information from the Instituto Nicareguense de Estudios Territoriales (INETER) and various satellite data.
MIROVA (Middle InfraRed Observation of Volcanic Activity) analysis of MODIS satellite data showed intermittent low-power thermal anomalies during June-December 2021, though a marked pause in thermal activity was noted during mid-July through late August (figure 100). This thermal activity was also visible in Sentinel-2 infrared satellite imagery, which was represented by a bright yellow-orange thermal anomaly in the Santiago crater’s lava lake (figure 101). Occasional gas-and-steam emissions were also detected drifting from the summit crater. Intermittent and small sulfur dioxide emissions that drifted generally W were observed notably during October based on data from the TROPOMI instrument on the Sentinel-5P satellite (figure 102).
Volcanism was relatively low throughout this reporting period. Seismic tremor continued to be detected, varying between 300 to 350 RSAM units; more than 8,700 low-frequency (LF) events had been recorded between January and June 2021. Sulfur dioxide measurements made on 22 June were an average of 839 tons/day, based on data on several transects using a mobile DOAS spectrometer. This measurement was lower compared to May (1,058 tons/day). During August, the rate of sulfur dioxide emissions decreased to 447 tons/day, a marked decrease from the July measurements of 1,400 tons/day. In addition to the decrease in gas-and-steam emissions, collapses along the crater walls of the lava lake were reported. On 13 August temperatures were determined based on thermal images; though the level of the lava lake had decreased, the temperature remained within the typical range of 500-800°C. Additionally, a fissure was observed on the NW wall of the Santiago crater.
During September, the rate of sulfur dioxide emissions was an average of 977 tons/day. Landslides on the walls of the Santiago crater toward the lava lake were observed, resulting in increased degassing, according to INETER. The level of the lava lake continued to decline, though incandescence was still visible (figure 103). In October, the average rate of sulfur dioxide emissions increased to 1,116 tons/day. Internal wall collapses continued during October and November, in addition to the declining lava lake level. The average rate of sulfur dioxide emissions was 1,037 tons/day in November. A single thermal alert was issued by the MODVOLC thermal algorithm on 29 November.
Information Contacts: Instituto Nicaragüense de Estudios Territoriales (INETER), Apartado Postal 2110, Managua, Nicaragua (URL: http://www.ineter.gob.ni/); MIROVA (Middle InfraRed Observation of Volcanic Activity), a collaborative project between the Universities of Turin and Florence (Italy) supported by the Centre for Volcanic Risk of the Italian Civil Protection Department (URL: http://www.mirovaweb.it/); NASA Global Sulfur Dioxide Monitoring Page, Atmospheric Chemistry and Dynamics Laboratory, NASA Goddard Space Flight Center (NASA/GSFC), 8800 Greenbelt Road, Goddard, Maryland, USA (URL: https://so2.gsfc.nasa.gov/); Hawai'i Institute of Geophysics and Planetology (HIGP) - MODVOLC Thermal Alerts System, School of Ocean and Earth Science and Technology (SOEST), Univ. of Hawai'i, 2525 Correa Road, Honolulu, HI 96822, USA (URL: http://modis.higp.hawaii.edu/); Sentinel Hub Playground (URL: https://www.sentinel-hub.com/explore/sentinel-playground).
Weak thermal anomalies and gas-and-steam emissions during January-July 2022
Masaya comprises a 6.5 x 11.5 km caldera consisting of the Nindirí, San Pedro, San Juan, and Santiago craters. The Santiago crater is currently the most active and contains a small lava lake that emits weak gas-and-steam plumes. It is located about 20 km SE of Managua, the capital of Nicaragua. The current eruption period began in October 2015 and has more recently consisted of an active lava lake and gas-and-steam emissions (BGVN 47:01). This report covers activity during January through July 2022, characterized by weak thermal activity in the lava lake, gas-and-steam emissions, and seismicity based on Instituto Nicaragüense de Estudios Territoriales (INETER) monthly reports and satellite data.
MIROVA (Middle InfraRed Observation of Volcanic Activity) analysis of MODIS satellite data showed nine low-power thermal anomalies during January 2022, which then decreased to one anomaly in late February, two in March, three in May, and one in June (figure 104). A weak hotspot was also reflected in Sentinel-2 infrared satellite images during January through July in the Santiago crater’s lava lake (figure 105). Few weak sulfur dioxide plumes drifted generally W during mid-January, late April, and May, based on data from the TROPOMI instrument on the Sentinel-5P satellite.
Activity was relatively low throughout the reporting period. Seismic tremor continued to be detected, varying between 80-100 RSAM units; roughly 21,352 seismic events, some of which were low frequency (LF), were recorded between January and July 2022, the most of which occurred in April (6,637). On 7 February, INETER measured the temperature of the Santiago crater, in addition to taking thermal images and Multigas measurements. Landslides and erosion were also recorded on the internal walls of the crater and lava lake, accompanied by white gas-and-steam emissions. The maximum temperature was 904.3°C, which INETER reported was higher than previous months, based on data from FLIR (forward-looking infrared) images. Sulfur dioxide measurements made during March were an average of 1,001 tons/day (t/d), based on data from several transects using a mobile DOAS spectrometer, which was lower than the measurements taken during February (1,844 tons/day). On 2 March INETER observed that the lava lake level had decreased, which obscured clear views. The temperature of the lava lake remained between the typical range of 500-800°C. During April the sulfur dioxide emissions measured 1,206 t/d, which had increased slightly from the previous month.
During 2-18 May a seismic swarm occurred in the Ticuantepe, which is located to the NW of the Santiago crater (figure 106). There were 43 earthquakes that were detected and on 10 May, a strong Mw 3.5 earthquake was felt by the entire population of Ticuantepe, some in Masaya, and some in Managua. The typical range of the magnitude of these earthquakes was 1.1-3.5 with a depth ranging 4-7 km. On 25 May at 1258 an Mw 5.2 earthquake was detected at a depth of 24 km, located 102 km SW of Managua. On 10 May temperature measurements made in the Santiago crater were 657°C and there was subsidence of about 2 m. The volume of sulfur dioxide emissions continued to decrease to an average of 661 t/d during June.
Information Contacts: Instituto Nicaragüense de Estudios Territoriales (INETER), Apartado Postal 2110, Managua, Nicaragua (URL: http://www.ineter.gob.ni/); MIROVA (Middle InfraRed Observation of Volcanic Activity), a collaborative project between the Universities of Turin and Florence (Italy) supported by the Centre for Volcanic Risk of the Italian Civil Protection Department (URL: http://www.mirovaweb.it/); NASA Global Sulfur Dioxide Monitoring Page, Atmospheric Chemistry and Dynamics Laboratory, NASA Goddard Space Flight Center (NASA/GSFC), 8800 Greenbelt Road, Goddard, Maryland, USA (URL: https://so2.gsfc.nasa.gov/); Sentinel Hub Playground (URL: https://www.sentinel-hub.com/explore/sentinel-playground).
Thermal activity in the summit crater persisted during August 2022-January 2023
Masaya is a broad, 6 x 11 km caldera with steep-sided walls up to 300 m high located about 20 km SE of Managua, the capital of Nicaragua. Eruptions have originated from the Nindirí and Masaya cones, which were constructed at the southern end of the fracture system and contain multiple summit craters, including the currently active Santiago crater. The Santiago crater contains a small lava lake that emits weak gas-and-steam plumes. The current eruption period began in October 2015 and more recently has consisted of weak thermal activity and gas-and-steam emissions (BGVN 47:08). This report updates activity from August 2022 through January 2023, characterized by continued thermal activity, seismicity, and sulfur dioxide emissions, based on Instituto Nicaragüense de Estudios Territoriales (INETER) monthly reports and satellite data.
Thermal activity has been relatively consistent over the past two years, according to the MIROVA (Middle InfraRed Observation of Volcanic Activity) graph (figure 107). An analysis of MODIS satellite data showed 15 low-power thermal hotspots during the reporting period: twice in mid-August 2022, twice in early November 2022, five times in December 2022, and six times in January 2023. Sentinel-2 infrared satellite images showed an occasional hotspot in the Santiago crater’s lava lake throughout the reporting period (figure 108). Intermittent small sulfur dioxide plumes drifted generally W on 16-17, 23, and 29 August, 2, 7-9, 18-19, 23, and 29 September, 4, 15, 21, 25-26, and 30 October, 1, 5-6, 10-12, and 26-27 November, and 29-30 January 2023, based on data from the TROPOMI instrument on the Sentinel-5P satellite.
Activity was relatively low throughout the reporting period. Gas measurements were made with a Mobile DOAS during August, showing average sulfur dioxide values of 746 metric tons/day (t/d) and 694 t/d on 23 and 28 August, respectively. Seismic tremor was at 80 RSAM units and 239 low-frequency (LF) seismic events were recorded during August. On 12 August temperature measurements were taken in the lava lake of the Santiago crater, recording values of 300°C. This temperature was lower compared to the previous month. During September the average value of sulfur dioxide emissions was 551 t/d on 8 September. On 9 September temperature measurements were recorded at 294 °C and INETER reported that the level of the lava lake had decreased.
During October and November, the seismic amplitude remained at 50 units. There were 175 LF events and two tectonic earthquakes detected in October and three LF events in November. On 7 October INETER recorded a lava lake temperature of 310°C and reported that the lake level had decreased since measurements were taken in September. There was an increase in sulfur dioxide emissions that had a value of 1,334 t/d on 24 October. Similar activity continued during December and January 2023. The seismic amplitude varied between 50 and 100 units, with two LF events recorded in December and two tectonic earthquakes recorded in January.
Information Contacts: Instituto Nicaragüense de Estudios Territoriales (INETER), Apartado Postal 2110, Managua, Nicaragua (URL: http://www.ineter.gob.ni/); MIROVA (Middle InfraRed Observation of Volcanic Activity), a collaborative project between the Universities of Turin and Florence (Italy) supported by the Centre for Volcanic Risk of the Italian Civil Protection Department (URL: http://www.mirovaweb.it/); NASA Global Sulfur Dioxide Monitoring Page, Atmospheric Chemistry and Dynamics Laboratory, NASA Goddard Space Flight Center (NASA/GSFC), 8800 Greenbelt Road, Goddard, Maryland, USA (URL: https://so2.gsfc.nasa.gov/); Sentinel Hub Playground (URL: https://www.sentinel-hub.com/explore/sentinel-playground).
Thermal anomalies in the summit crater during February-July 2023
Masaya, located about 20 km SE of Managua, the capital Nicaragua, is a broad, 6 x 11 km caldera with steep-sided walls up to 300 m high. The caldera is filled on its NW end by more than a dozen vents that erupted along a circular, 4-km-diameter fracture system. Eruptions have originated from the Nindirí and Masaya cones, which were constructed at the southern end of the fracture system and contain multiple summit craters, including the currently active Santiago crater. The Santiago crater contains a small lava lake that emits weak gas-and-steam plumes. The current eruption period began in October 2015 and more recently has been characterized by thermal activity in the summit crater (BGVN 48:03). This report covers similar activity from February through July 2023, consisting of continuing thermal activity and sulfur dioxide emissions, according to monthly reports from Instituto Nicaragüense de Estudios Territoriales (INETER) and satellite data.
Thermal activity has remained relatively consistent, according to a MIROVA (Middle InfraRed Observation of Volcanic Activity) analysis of MODIS satellite data, which showed occasional low-power thermal anomalies during the reporting period. There were six anomalies were detected during February, four during March, three during April, one during early June, and one during late July (figure 109). Infrared satellite imagery showed occasional hotspots in the Santiago crater’s lava lake throughout the reporting period (figure 110). The TROPOMI instrument on the Sentinel-5P satellite detected weak and small sulfur dioxide plumes that drifted generally W and SW on 8-9 February, 3-4, 13, and 18 March, 25 and 30 April, 11-12 May, 1-2 and 11 June, and 3 July.
Activity was relatively low throughout the reporting period. Seismic tremor was at 60 RSAM units during February and March. On 10 February FLIR temperature of the lava lake was measured from Santiago crater, recording values of 290°C, which was within the typical range of 200-500°C. INETER noted that the level of the lava lake had decreased compared to previous observations made during October 2022. On 15 March gas measurements were made with a Mobile DOAS technique, showing average sulfur dioxide values of 1,448 tons/day (t/d); the previous date that measurements were taken was on 14 November 2022 with a value of 1,222 t/d. On 25 April sulfur dioxide measurements decreased slightly to an average of 1,042 t/d. Temperature values of the lava lake from Santiago crater were 254°C on 26 April.
Seismic tremor was at 50 RSAM units during May and consisted of one volcano-tectonic (VT) event and 347 low-frequency (LF) events. On 5 May INETER recorded a temperature of the lava lake from Santiago crater of 270°C and reported that the level of the lava lake was lower compared to previous observations made in April. Sulfur dioxide measurements taken on 15 May were 1,438 t/d. During June and July, seismic tremor was maintained at 50 RSAM units and included one VT event and 221 LP-type events during June, and three LP-type events during July. On 28 June measurements of the lava lake had increased slightly to 315°C and the level of the lava lake continued to decrease. The average values of released sulfur dioxide emissions were 1,056 t/d on 19 June and 1,012 t/d on 14 July.
Information Contacts: Instituto Nicaragüense de Estudios Territoriales (INETER), Apartado Postal 2110, Managua, Nicaragua (URL: http://www.ineter.gob.ni/); MIROVA (Middle InfraRed Observation of Volcanic Activity), a collaborative project between the Universities of Turin and Florence (Italy) supported by the Centre for Volcanic Risk of the Italian Civil Protection Department (URL: http://www.mirovaweb.it/); NASA Global Sulfur Dioxide Monitoring Page, Atmospheric Chemistry and Dynamics Laboratory, NASA Goddard Space Flight Center (NASA/GSFC), 8800 Greenbelt Road, Goddard, Maryland, USA (URL: https://so2.gsfc.nasa.gov/); Copernicus Browser, Copernicus Data Space Ecosystem, European Space Agency (URL: https://dataspace.copernicus.eu/browser/).
This compilation of synonyms and subsidiary features may not be comprehensive. Features are organized into four major categories: Cones, Craters, Domes, and Thermal Features. Synonyms of features appear indented below the primary name. In some cases additional feature type, elevation, or location details are provided.
Cones |
||||
| Feature Name | Feature Type | Elevation | Latitude | Longitude |
| Arenal, Cerro | Pyroclastic cone | |||
| Comalito | Pyroclastic cone | 355 m | 11° 59' 50" N | 86° 9' 0" W |
| Coyotepe, Cerro el | Pyroclastic cone | 335 m | 11° 59' 45" N | 86° 5' 54" W |
| Errant Cone | Pyroclastic cone | |||
| Media Luna, La | Pyroclastic cone | |||
| Montoso, Cerro | Pyroclastic cone | |||
| Nindirí | Cone | 594 m | 11° 58' 57" N | 86° 10' 19" W |
| Pelón, El | Pyroclastic cone | |||
| Renón, El | Pyroclastic cone | |||
| Sastres, Las | Pyroclastic cone | |||
Craters |
||||
| Feature Name | Feature Type | Elevation | Latitude | Longitude |
|
Masaya
San Fernando |
Crater | 449 m | 11° 59' 7" N | 86° 9' 38" W |
| Masaya Caldera | Caldera | 126 m | 11° 59' 0" N | 86° 9' 0" W |
| San Juan | Crater | |||
| San Pedro | Crater | 488 m | 11° 59' 15" N | 86° 10' 21" W |
| Santiago | Crater | 454 m | 11° 59' 4" N | 86° 10' 4" W |
|
Sierras, Las
Nubes, Las |
Pleistocene caldera | 923 m | 11° 58' 0" N | 86° 13' 0" W |
| Ventarrón, El | Caldera | |||
|
|
||||||||||||||||||||||||||
There is data available for 36 confirmed Holocene eruptive periods.
2015 Oct 3 - 2024 Oct 17 (continuing) Confirmed Eruption VEI: 1
| Episode 1 | Eruption (Lava Lake) | Santiago crater | ||||||||||||||||||||||||||||||||||||||||||||||||||||||||||||||||||||||||||||||||||||||||||||||||||||||||||||||||||||||||||||||||||||||||||||||||||||||||||||||||||||||||||||||||||||||||||||||||||||||||||||||||||||||||||||||||||||||||||||||||||||||||||||||||||||||||||||||||||||||||||||||||||||||||||||||||||||||||||||||||||||||||||||||||||||||||||||||||||||||||||||||||||||||||||||||||||||||||||||||||||||||||||||||||||||||||||||||||||||||||||||||||||||||||||||||||||||||||||||||||||||||||||||||||||||||||||||||||||||||||||||||||||||||||||||||||||||||||||||||||||||||||||||||||||||||||||||||||||||||||||||||||||||||||||||||||||||||||||||||||||||||||||||||||||||||||||||||||||||||||||||||||||||||||||||||||||||||||||||||||||||||||||||||||||||||||||||||||||||||||||||||||||||||||||||||||||||||||||||||||||||||||||||||||||||||||
|---|---|---|---|---|---|---|---|---|---|---|---|---|---|---|---|---|---|---|---|---|---|---|---|---|---|---|---|---|---|---|---|---|---|---|---|---|---|---|---|---|---|---|---|---|---|---|---|---|---|---|---|---|---|---|---|---|---|---|---|---|---|---|---|---|---|---|---|---|---|---|---|---|---|---|---|---|---|---|---|---|---|---|---|---|---|---|---|---|---|---|---|---|---|---|---|---|---|---|---|---|---|---|---|---|---|---|---|---|---|---|---|---|---|---|---|---|---|---|---|---|---|---|---|---|---|---|---|---|---|---|---|---|---|---|---|---|---|---|---|---|---|---|---|---|---|---|---|---|---|---|---|---|---|---|---|---|---|---|---|---|---|---|---|---|---|---|---|---|---|---|---|---|---|---|---|---|---|---|---|---|---|---|---|---|---|---|---|---|---|---|---|---|---|---|---|---|---|---|---|---|---|---|---|---|---|---|---|---|---|---|---|---|---|---|---|---|---|---|---|---|---|---|---|---|---|---|---|---|---|---|---|---|---|---|---|---|---|---|---|---|---|---|---|---|---|---|---|---|---|---|---|---|---|---|---|---|---|---|---|---|---|---|---|---|---|---|---|---|---|---|---|---|---|---|---|---|---|---|---|---|---|---|---|---|---|---|---|---|---|---|---|---|---|---|---|---|---|---|---|---|---|---|---|---|---|---|---|---|---|---|---|---|---|---|---|---|---|---|---|---|---|---|---|---|---|---|---|---|---|---|---|---|---|---|---|---|---|---|---|---|---|---|---|---|---|---|---|---|---|---|---|---|---|---|---|---|---|---|---|---|---|---|---|---|---|---|---|---|---|---|---|---|---|---|---|---|---|---|---|---|---|---|---|---|---|---|---|---|---|---|---|---|---|---|---|---|---|---|---|---|---|---|---|---|---|---|---|---|---|---|---|---|---|---|---|---|---|---|---|---|---|---|---|---|---|---|---|---|---|---|---|---|---|---|---|---|---|---|---|---|---|---|---|---|---|---|---|---|---|---|---|---|---|---|---|---|---|---|---|---|---|---|---|---|---|---|---|---|---|---|---|---|---|---|---|---|---|---|---|---|---|---|---|---|---|---|---|---|---|---|---|---|---|---|---|---|---|---|---|---|---|---|---|---|---|---|---|---|---|---|---|---|---|---|---|---|---|---|---|---|---|---|---|---|---|---|---|---|---|---|---|---|---|---|---|---|---|---|---|---|---|---|---|---|---|---|---|---|---|---|---|---|---|---|---|---|---|---|---|---|---|---|---|---|---|---|---|---|---|---|---|---|---|---|---|---|---|---|---|---|---|---|---|---|---|---|---|---|---|---|---|---|---|---|---|---|---|---|---|---|---|---|---|---|---|---|---|---|---|---|---|---|---|---|---|---|---|---|---|---|---|---|---|---|---|---|---|---|---|---|---|---|---|---|---|---|---|---|---|---|---|---|---|---|---|---|---|---|---|---|---|---|---|---|---|---|---|---|---|---|---|---|---|---|---|---|---|---|---|---|---|---|---|---|---|---|---|---|---|---|---|---|---|---|---|---|---|---|---|---|---|---|---|---|---|---|---|---|---|---|---|---|---|---|---|---|---|---|---|---|---|---|---|---|---|---|---|---|---|---|---|---|---|---|---|---|---|---|---|---|---|---|---|---|---|---|---|---|---|---|---|---|---|---|---|---|---|---|---|---|---|---|---|---|---|---|---|---|---|---|---|---|---|---|---|---|---|---|---|---|---|---|---|---|---|---|---|---|---|---|---|---|---|---|---|---|---|---|---|---|---|---|---|---|---|---|---|---|---|---|---|---|---|---|---|---|---|---|---|---|---|---|---|---|---|---|---|---|---|---|---|---|---|---|---|
| 2015 Oct 3 - 2024 Oct 17 (continuing) | Evidence from Observations: Reported | ||||||||||||||||||||||||||||||||||||||||||||||||||||||||||||||||||||||||||||||||||||||||||||||||||||||||||||||||||||||||||||||||||||||||||||||||||||||||||||||||||||||||||||||||||||||||||||||||||||||||||||||||||||||||||||||||||||||||||||||||||||||||||||||||||||||||||||||||||||||||||||||||||||||||||||||||||||||||||||||||||||||||||||||||||||||||||||||||||||||||||||||||||||||||||||||||||||||||||||||||||||||||||||||||||||||||||||||||||||||||||||||||||||||||||||||||||||||||||||||||||||||||||||||||||||||||||||||||||||||||||||||||||||||||||||||||||||||||||||||||||||||||||||||||||||||||||||||||||||||||||||||||||||||||||||||||||||||||||||||||||||||||||||||||||||||||||||||||||||||||||||||||||||||||||||||||||||||||||||||||||||||||||||||||||||||||||||||||||||||||||||||||||||||||||||||||||||||||||||||||||||||||||||||||||||||||
|
List of 163 Events for Episode 1 at Santiago crater
| |||||||||||||||||||||||||||||||||||||||||||||||||||||||||||||||||||||||||||||||||||||||||||||||||||||||||||||||||||||||||||||||||||||||||||||||||||||||||||||||||||||||||||||||||||||||||||||||||||||||||||||||||||||||||||||||||||||||||||||||||||||||||||||||||||||||||||||||||||||||||||||||||||||||||||||||||||||||||||||||||||||||||||||||||||||||||||||||||||||||||||||||||||||||||||||||||||||||||||||||||||||||||||||||||||||||||||||||||||||||||||||||||||||||||||||||||||||||||||||||||||||||||||||||||||||||||||||||||||||||||||||||||||||||||||||||||||||||||||||||||||||||||||||||||||||||||||||||||||||||||||||||||||||||||||||||||||||||||||||||||||||||||||||||||||||||||||||||||||||||||||||||||||||||||||||||||||||||||||||||||||||||||||||||||||||||||||||||||||||||||||||||||||||||||||||||||||||||||||||||||||||||||||||||||||||||||
[ 2013 Apr 11 - 2013 Apr 26 ] Uncertain Eruption
| Episode 1 | Eruption | ||||||||||||||||||||
|---|---|---|---|---|---|---|---|---|---|---|---|---|---|---|---|---|---|---|---|---|
| 2013 Apr 11 - 2013 Apr 26 | Evidence from Observations: Reported | |||||||||||||||||||
|
List of 2 Events for Episode 1
| ||||||||||||||||||||
2012 Apr 30 - 2012 Jun 8 Confirmed Eruption VEI: 2
| Episode 1 | Eruption | Santiago Crater | |||||||||||||||||||||||||||||||||||||||||||||||||||||||||||||||||||||||||||||||||||||||||||||||||||
|---|---|---|---|---|---|---|---|---|---|---|---|---|---|---|---|---|---|---|---|---|---|---|---|---|---|---|---|---|---|---|---|---|---|---|---|---|---|---|---|---|---|---|---|---|---|---|---|---|---|---|---|---|---|---|---|---|---|---|---|---|---|---|---|---|---|---|---|---|---|---|---|---|---|---|---|---|---|---|---|---|---|---|---|---|---|---|---|---|---|---|---|---|---|---|---|---|---|---|---|---|
| 2012 Apr 30 - 2012 Jun 8 | Evidence from Observations: Reported | |||||||||||||||||||||||||||||||||||||||||||||||||||||||||||||||||||||||||||||||||||||||||||||||||||
|
List of 18 Events for Episode 1 at Santiago Crater
| ||||||||||||||||||||||||||||||||||||||||||||||||||||||||||||||||||||||||||||||||||||||||||||||||||||
2008 Apr 29 - 2008 Dec 17 (?) Confirmed Eruption VEI: 1
| Episode 1 | Eruption | Santiago | ||||||||||||||||||||||||
|---|---|---|---|---|---|---|---|---|---|---|---|---|---|---|---|---|---|---|---|---|---|---|---|---|---|
| 2008 Apr 29 - 2008 Dec 17 (?) | Evidence from Observations: Reported | ||||||||||||||||||||||||
|
List of 3 Events for Episode 1 at Santiago
| |||||||||||||||||||||||||
2006 Aug 4 - 2006 Oct 25 (?) Confirmed Eruption VEI: 1
| Episode 1 | Eruption | Santiago | ||||||||||||||||||||||||||||||||||||||||||||
|---|---|---|---|---|---|---|---|---|---|---|---|---|---|---|---|---|---|---|---|---|---|---|---|---|---|---|---|---|---|---|---|---|---|---|---|---|---|---|---|---|---|---|---|---|---|
| 2006 Aug 4 - 2006 Oct 25 (?) | Evidence from Observations: Reported | ||||||||||||||||||||||||||||||||||||||||||||
|
List of 7 Events for Episode 1 at Santiago
| |||||||||||||||||||||||||||||||||||||||||||||
2005 Mar 4 (?) - 2005 Mar 30 (?) Confirmed Eruption VEI: 1
| Episode 1 | Eruption | Santiago | ||||||||||||||||||||||||||||||||||||||||||||
|---|---|---|---|---|---|---|---|---|---|---|---|---|---|---|---|---|---|---|---|---|---|---|---|---|---|---|---|---|---|---|---|---|---|---|---|---|---|---|---|---|---|---|---|---|---|
| 2005 Mar 4 (?) - 2005 Mar 30 (?) | Evidence from Observations: Reported | ||||||||||||||||||||||||||||||||||||||||||||
|
List of 7 Events for Episode 1 at Santiago
| |||||||||||||||||||||||||||||||||||||||||||||
[ 2004 Jul 4 - 2004 Jul 4 ] Uncertain Eruption
| Episode 1 | Eruption | Santiago | ||||||||||||||||||||||||
|---|---|---|---|---|---|---|---|---|---|---|---|---|---|---|---|---|---|---|---|---|---|---|---|---|---|
| 2004 Jul 4 - 2004 Jul 4 | Evidence from Unknown | ||||||||||||||||||||||||
|
List of 3 Events for Episode 1 at Santiago
| |||||||||||||||||||||||||
2003 Sep 22 (in or before) - 2003 Dec 12 (?) Confirmed Eruption VEI: 1
| Episode 1 | Eruption | Santiago | ||||||||||||||||||||||||||||||||||
|---|---|---|---|---|---|---|---|---|---|---|---|---|---|---|---|---|---|---|---|---|---|---|---|---|---|---|---|---|---|---|---|---|---|---|---|
| 2003 Sep 22 (in or before) - 2003 Dec 12 (?) | Evidence from Observations: Reported | ||||||||||||||||||||||||||||||||||
|
List of 5 Events for Episode 1 at Santiago
| |||||||||||||||||||||||||||||||||||
2001 Apr 23 - 2001 Apr 25 (?) Confirmed Eruption VEI: 1
| Episode 1 | Eruption | Santiago | ||||||||||||||||||||||||||||||||||||||||||||
|---|---|---|---|---|---|---|---|---|---|---|---|---|---|---|---|---|---|---|---|---|---|---|---|---|---|---|---|---|---|---|---|---|---|---|---|---|---|---|---|---|---|---|---|---|---|
| 2001 Apr 23 - 2001 Apr 25 (?) | Evidence from Observations: Reported | ||||||||||||||||||||||||||||||||||||||||||||
|
List of 7 Events for Episode 1 at Santiago
| |||||||||||||||||||||||||||||||||||||||||||||
1999 Nov 22 - 2000 Mar 2 (?) Confirmed Eruption VEI: 1
| Episode 1 | Eruption | Santiago | |||||||||||||||||||||||||||||
|---|---|---|---|---|---|---|---|---|---|---|---|---|---|---|---|---|---|---|---|---|---|---|---|---|---|---|---|---|---|---|
| 1999 Nov 22 - 2000 Mar 2 (?) | Evidence from Observations: Reported | |||||||||||||||||||||||||||||
|
List of 4 Events for Episode 1 at Santiago
| ||||||||||||||||||||||||||||||
1998 Sep 14 - 1998 Sep 14 Confirmed Eruption VEI: 1
| Episode 1 | Eruption | Santiago | ||||||||||||||||||||||||
|---|---|---|---|---|---|---|---|---|---|---|---|---|---|---|---|---|---|---|---|---|---|---|---|---|---|
| 1998 Sep 14 - 1998 Sep 14 | Evidence from Observations: Reported | ||||||||||||||||||||||||
|
List of 3 Events for Episode 1 at Santiago
| |||||||||||||||||||||||||
1997 Jun 3 (?) - 1997 Nov 17 Confirmed Eruption VEI: 1
| Episode 1 | Eruption | Santiago | ||||||||||||||||||||||||
|---|---|---|---|---|---|---|---|---|---|---|---|---|---|---|---|---|---|---|---|---|---|---|---|---|---|
| 1997 Jun 3 (?) - 1997 Nov 17 | Evidence from Observations: Reported | ||||||||||||||||||||||||
|
List of 3 Events for Episode 1 at Santiago
| |||||||||||||||||||||||||
1996 Dec 5 - 1996 Dec 5 Confirmed Eruption VEI: 1
| Episode 1 | Eruption | Santiago | |||||||||||||||||||||||||||||||||||||||
|---|---|---|---|---|---|---|---|---|---|---|---|---|---|---|---|---|---|---|---|---|---|---|---|---|---|---|---|---|---|---|---|---|---|---|---|---|---|---|---|---|
| 1996 Dec 5 - 1996 Dec 5 | Evidence from Observations: Reported | |||||||||||||||||||||||||||||||||||||||
|
List of 6 Events for Episode 1 at Santiago
| ||||||||||||||||||||||||||||||||||||||||
1993 Jun 16 - 1994 Nov 16 (in or after) ± 15 days Confirmed Eruption VEI: 1
| Episode 1 | Eruption | Santiago | ||||||||||||||||||||||||||||||||||
|---|---|---|---|---|---|---|---|---|---|---|---|---|---|---|---|---|---|---|---|---|---|---|---|---|---|---|---|---|---|---|---|---|---|---|---|
| 1993 Jun 16 - 1994 Nov 16 (in or after) ± 15 days | Evidence from Observations: Reported | ||||||||||||||||||||||||||||||||||
|
List of 5 Events for Episode 1 at Santiago
| |||||||||||||||||||||||||||||||||||
1989 Feb 20 - 1989 Nov 16 ± 15 days Confirmed Eruption VEI: 1
| Episode 1 | Eruption | Santiago | ||||||||||||||||||||||||||||||||||||||||||||
|---|---|---|---|---|---|---|---|---|---|---|---|---|---|---|---|---|---|---|---|---|---|---|---|---|---|---|---|---|---|---|---|---|---|---|---|---|---|---|---|---|---|---|---|---|---|
| 1989 Feb 20 - 1989 Nov 16 ± 15 days | Evidence from Observations: Reported | ||||||||||||||||||||||||||||||||||||||||||||
|
List of 7 Events for Episode 1 at Santiago
| |||||||||||||||||||||||||||||||||||||||||||||
1987 Feb 15 - 1987 Feb 22 (in or after) Confirmed Eruption VEI: 1
| Episode 1 | Eruption | Santiago | |||||||||||||||||||||||||||||
|---|---|---|---|---|---|---|---|---|---|---|---|---|---|---|---|---|---|---|---|---|---|---|---|---|---|---|---|---|---|---|
| 1987 Feb 15 - 1987 Feb 22 (in or after) | Evidence from Observations: Reported | |||||||||||||||||||||||||||||
|
List of 4 Events for Episode 1 at Santiago
| ||||||||||||||||||||||||||||||
1965 Oct 10 (?) - 1985 Apr 16 (?) ± 15 days Confirmed Eruption VEI: 1
| Episode 1 | Eruption | Santiago | |||||||||||||||||||||||||||||||||||||||||||||||||||||||||||||||||||||||||||||||
|---|---|---|---|---|---|---|---|---|---|---|---|---|---|---|---|---|---|---|---|---|---|---|---|---|---|---|---|---|---|---|---|---|---|---|---|---|---|---|---|---|---|---|---|---|---|---|---|---|---|---|---|---|---|---|---|---|---|---|---|---|---|---|---|---|---|---|---|---|---|---|---|---|---|---|---|---|---|---|---|---|
| 1965 Oct 10 (?) - 1985 Apr 16 (?) ± 15 days | Evidence from Observations: Reported | |||||||||||||||||||||||||||||||||||||||||||||||||||||||||||||||||||||||||||||||
|
List of 14 Events for Episode 1 at Santiago
| ||||||||||||||||||||||||||||||||||||||||||||||||||||||||||||||||||||||||||||||||
1948 Sep - 1948 Sep Confirmed Eruption VEI: 1
| Episode 1 | Eruption | Santiago | |||||||||||||||||||||||||||||
|---|---|---|---|---|---|---|---|---|---|---|---|---|---|---|---|---|---|---|---|---|---|---|---|---|---|---|---|---|---|---|
| 1948 Sep - 1948 Sep | Evidence from Observations: Reported | |||||||||||||||||||||||||||||
|
List of 4 Events for Episode 1 at Santiago
| ||||||||||||||||||||||||||||||
1946 Jun - 1947 Dec (?) Confirmed Eruption VEI: 1
| Episode 1 | Eruption | Santiago | |||||||||||||||||||||||||||||||||||||||||||||||||
|---|---|---|---|---|---|---|---|---|---|---|---|---|---|---|---|---|---|---|---|---|---|---|---|---|---|---|---|---|---|---|---|---|---|---|---|---|---|---|---|---|---|---|---|---|---|---|---|---|---|---|
| 1946 Jun - 1947 Dec (?) | Evidence from Observations: Reported | |||||||||||||||||||||||||||||||||||||||||||||||||
|
List of 8 Events for Episode 1 at Santiago
| ||||||||||||||||||||||||||||||||||||||||||||||||||
1925 Apr Confirmed Eruption VEI: 2 (?)
| Episode 1 | Eruption | Santiago | |||||||||||||||||||||||||||||
|---|---|---|---|---|---|---|---|---|---|---|---|---|---|---|---|---|---|---|---|---|---|---|---|---|---|---|---|---|---|---|
| 1925 Apr - Unknown | Evidence from Observations: Reported | |||||||||||||||||||||||||||||
|
List of 4 Events for Episode 1 at Santiago
| ||||||||||||||||||||||||||||||
1919 - 1924 Confirmed Eruption VEI: 2
| Episode 1 | Eruption | Santiago | ||||||||||||||||||||||||
|---|---|---|---|---|---|---|---|---|---|---|---|---|---|---|---|---|---|---|---|---|---|---|---|---|---|
| 1919 - 1924 | Evidence from Observations: Reported | ||||||||||||||||||||||||
|
List of 3 Events for Episode 1 at Santiago
| |||||||||||||||||||||||||
1918 Jan Confirmed Eruption VEI: 1
| Episode 1 | Eruption | Santiago | ||||||||||||||||||||||||
|---|---|---|---|---|---|---|---|---|---|---|---|---|---|---|---|---|---|---|---|---|---|---|---|---|---|
| 1918 Jan - Unknown | Evidence from Observations: Reported | ||||||||||||||||||||||||
|
List of 3 Events for Episode 1 at Santiago
| |||||||||||||||||||||||||
1913 Jul 12 Confirmed Eruption VEI: 1 (?)
| Episode 1 | Eruption | Santiago | |||||||||||||||||||||||||||||
|---|---|---|---|---|---|---|---|---|---|---|---|---|---|---|---|---|---|---|---|---|---|---|---|---|---|---|---|---|---|---|
| 1913 Jul 12 - Unknown | Evidence from Observations: Reported | |||||||||||||||||||||||||||||
|
List of 4 Events for Episode 1 at Santiago
| ||||||||||||||||||||||||||||||
1906 Jan 2 - 1906 Jan 9 (in or after) Confirmed Eruption VEI: 2
| Episode 1 | Eruption | Santiago and upper NE flank near El Pelón | ||||||||||||||||||||||||||||||||||||||||||||
|---|---|---|---|---|---|---|---|---|---|---|---|---|---|---|---|---|---|---|---|---|---|---|---|---|---|---|---|---|---|---|---|---|---|---|---|---|---|---|---|---|---|---|---|---|---|
| 1906 Jan 2 - 1906 Jan 9 (in or after) | Evidence from Observations: Reported | ||||||||||||||||||||||||||||||||||||||||||||
|
List of 7 Events for Episode 1 at Santiago and upper NE flank near El Pelón
| |||||||||||||||||||||||||||||||||||||||||||||
1904 May - 1904 Jun Confirmed Eruption VEI: 2
| Episode 1 | Eruption | Santiago | |||||||||||||||||||
|---|---|---|---|---|---|---|---|---|---|---|---|---|---|---|---|---|---|---|---|---|
| 1904 May - 1904 Jun | Evidence from Observations: Reported | |||||||||||||||||||
|
List of 2 Events for Episode 1 at Santiago
| ||||||||||||||||||||
1902 Jul 15 - 1903 Nov Confirmed Eruption VEI: 2
| Episode 1 | Eruption | Santiago | ||||||||||||||||||||||||||||||||||||||||||||
|---|---|---|---|---|---|---|---|---|---|---|---|---|---|---|---|---|---|---|---|---|---|---|---|---|---|---|---|---|---|---|---|---|---|---|---|---|---|---|---|---|---|---|---|---|---|
| 1902 Jul 15 - 1903 Nov | Evidence from Observations: Reported | ||||||||||||||||||||||||||||||||||||||||||||
|
List of 7 Events for Episode 1 at Santiago
| |||||||||||||||||||||||||||||||||||||||||||||
1858 Nov 10 - 1859 Mar 27 Confirmed Eruption VEI: 2
| Episode 1 | Eruption | Santiago, San Pedro | |||||||||||||||||||||||||||||||||||||||
|---|---|---|---|---|---|---|---|---|---|---|---|---|---|---|---|---|---|---|---|---|---|---|---|---|---|---|---|---|---|---|---|---|---|---|---|---|---|---|---|---|
| 1858 Nov 10 - 1859 Mar 27 | Evidence from Observations: Reported | |||||||||||||||||||||||||||||||||||||||
|
List of 6 Events for Episode 1 at Santiago, San Pedro
| ||||||||||||||||||||||||||||||||||||||||
[ 1858 Apr ] Uncertain Eruption
| Episode 1 | Eruption | |||||||||||||||
|---|---|---|---|---|---|---|---|---|---|---|---|---|---|---|---|
| 1858 Apr - Unknown | Evidence from Unknown | ||||||||||||||
|
List of 1 Events for Episode 1
| |||||||||||||||
1856 Dec - 1857 Jan Confirmed Eruption VEI: 2
| Episode 1 | Eruption | Santiago or San Pedro | |||||||||||||||||||
|---|---|---|---|---|---|---|---|---|---|---|---|---|---|---|---|---|---|---|---|---|
| 1856 Dec - 1857 Jan | Evidence from Observations: Reported | |||||||||||||||||||
| Incer (1988, unpub. manuscript) notes a strong "detonation" on 2 March 1856 that may have originated from a collapse at Santiago Crater or the formation of San Pedro Crater, along with acidic fumes in 1857. CAVW reports an explosive eruption from December 1856 to January 1857. | ||||||||||||||||||||
|
List of 2 Events for Episode 1 at Santiago or San Pedro
| ||||||||||||||||||||
1853 Apr 9 (?) - 1853 Sep 15 (in or after) Confirmed Eruption VEI: 1 (?)
| Episode 1 | Eruption | Santiago | |||||||||||||||||||||||||||||||||||||||
|---|---|---|---|---|---|---|---|---|---|---|---|---|---|---|---|---|---|---|---|---|---|---|---|---|---|---|---|---|---|---|---|---|---|---|---|---|---|---|---|---|
| 1853 Apr 9 (?) - 1853 Sep 15 (in or after) | Evidence from Observations: Reported | |||||||||||||||||||||||||||||||||||||||
| A strong "detonation" on 9 April 1853 was followed by heavy gas emission with no noticeable ejection of pyroclastic material. "Flames" were seen at the summit on the night of 15 September from the town of Masatepe, and later investigation revealed a new 70 x 90 yard (64 x 82 m) crater (later known as Santiago) with incandescent lava surrounded by volcanic bombs (Incer 1988, unpub. manuscript). CAVW lists explosive eruptions on 9 April and 1 July. | ||||||||||||||||||||||||||||||||||||||||
|
List of 6 Events for Episode 1 at Santiago
| ||||||||||||||||||||||||||||||||||||||||
1852 Jun - 1852 Jul Confirmed Eruption VEI: 2
| Episode 1 | Eruption | Between Masaya and Nindirí Craters | ||||||||||||||||||||||||||||||||||
|---|---|---|---|---|---|---|---|---|---|---|---|---|---|---|---|---|---|---|---|---|---|---|---|---|---|---|---|---|---|---|---|---|---|---|---|
| 1852 Jun - 1852 Jul | Evidence from Observations: Reported | ||||||||||||||||||||||||||||||||||
| Following frequent earthquakes in April and June 1852, and heating up of the water of nearby lakes, some explosions were heard and a fissure opened up in the plateau between Masaya and Nindirí Craters and a small lava cone formed (McBirney, 1956; Incer, 1988 unpub. manuscript). Harris (2009) noted that a vent opened in Nindiri's NW sector during June-July 1852 that erupted scoria (now found on the 1670 bench) and a sequence of lava flows which created a shield of pahoehoe and aa around the vent. | |||||||||||||||||||||||||||||||||||
|
List of 5 Events for Episode 1 at Between Masaya and Nindirí Craters
| |||||||||||||||||||||||||||||||||||
[ 1775 ] Discredited Eruption
Juarros and Montessus de Ballore (1884) reported a lava flow in 1775 that nearly reached Lake Managua and caused damage that is not supported by field observations or colonial documents, and was probably confused with the 1772 eruption (Incer 1988, unpub. manuscript).
1772 Mar 16 - 1772 Mar 25 (?) Confirmed Eruption VEI: 2
| Episode 1 | Eruption | North side of Old Masaya Crater | ||||||||||||||||||||||||||||||||||||||||||||
|---|---|---|---|---|---|---|---|---|---|---|---|---|---|---|---|---|---|---|---|---|---|---|---|---|---|---|---|---|---|---|---|---|---|---|---|---|---|---|---|---|---|---|---|---|---|
| 1772 Mar 16 - 1772 Mar 25 (?) | Evidence from Observations: Reported | ||||||||||||||||||||||||||||||||||||||||||||
| On 16 March 1772 lava emerged from a fissure on the north side of Old Masaya Crater, accompanied by bomb ejection. Part of the flow was diverted by the caldera wall and flowed into Masaya Lake, but much of the flow overtopped the caldera rim and traveled a total of 16 km to near the shores of Lake Managua, cutting the road between Nindiri and Managua and destroying croplands. The eruption lasted about 9 days (Incer, 1988 unpub. manuscript). | |||||||||||||||||||||||||||||||||||||||||||||
|
List of 7 Events for Episode 1 at North side of Old Masaya Crater
| |||||||||||||||||||||||||||||||||||||||||||||
1670 Confirmed Eruption VEI: 3
| Episode 1 | Eruption (Lava Lake) | Nindirí | |||||||||||||||||||||||||||||
|---|---|---|---|---|---|---|---|---|---|---|---|---|---|---|---|---|---|---|---|---|---|---|---|---|---|---|---|---|---|---|
| 1670 - Unknown | Evidence from Observations: Reported | |||||||||||||||||||||||||||||
| A lava flow traveled from Nindiri Crater for 5 km down the N flank of the post-caldera cone. Squier and the CAVW confused this flow with the 1772 lava flow from Old Masaya Crater although Sapper (1917) locates it correctly (Incer 1988, unpub. manuscript). A lava lake emplaced in 1670 formed benches in Nindirí Crater (Rymer et al., 1998). | ||||||||||||||||||||||||||||||
|
List of 4 Events for Episode 1 at Nindirí
| ||||||||||||||||||||||||||||||
[ 1613 ] Uncertain Eruption
| Episode 1 | Uncertain | Nindirí | ||||||||||||||||||||||||
|---|---|---|---|---|---|---|---|---|---|---|---|---|---|---|---|---|---|---|---|---|---|---|---|---|---|
| 1613 - Unknown | Evidence from Unknown | ||||||||||||||||||||||||
| Vazquez de Espinosa reported that the volcano was emitting a cloud of thick, dense smoke, which often occurs at the end of Masaya lava lake cycles (Incer, 1988 unpub. manuscript). | |||||||||||||||||||||||||
|
List of 3 Events for Episode 1 at Nindirí
| |||||||||||||||||||||||||
1570 - 1586 (?) Confirmed Eruption VEI: 0
| Episode 1 | Eruption (Lava Lake) | Nindirí | |||||||||||||||||||
|---|---|---|---|---|---|---|---|---|---|---|---|---|---|---|---|---|---|---|---|---|
| 1570 - 1586 (?) | Evidence from Observations: Reported | |||||||||||||||||||
| The lava lake reappeared in 1570, when Friar Alonso Molino obtained the royal concession to mine the "gold" in the crater (Incer, 1988 unpub. manuscript). Friar Alonso Ponce reported a permanent strong fume column rising from the crater in 1586 that possibly represented the terminal phase of the 1570 lava lake cycle (Incer, 1988 unpub. manuscript). | ||||||||||||||||||||
|
List of 2 Events for Episode 1 at Nindirí
| ||||||||||||||||||||
1551 Confirmed Eruption VEI: 0
| Episode 1 | Eruption (Lava Lake) | Nindirí | |||||||||||||||||||
|---|---|---|---|---|---|---|---|---|---|---|---|---|---|---|---|---|---|---|---|---|
| 1551 - Unknown | Evidence from Observations: Reported | |||||||||||||||||||
| A new lava lake may have formed in 1551, when a request was sent to the King of Spain for 200 slaves to open a tunnel through the cone of Masaya to extract gold (Incer, 1988 unpub. manuscript). | ||||||||||||||||||||
|
List of 2 Events for Episode 1 at Nindirí
| ||||||||||||||||||||
1524 - 1544 (?) Confirmed Eruption VEI: 0
| Episode 1 | Eruption (Lava Lake) | Nindirí | |||||||||||||||||||||||||||||
|---|---|---|---|---|---|---|---|---|---|---|---|---|---|---|---|---|---|---|---|---|---|---|---|---|---|---|---|---|---|---|
| 1524 - 1544 (?) | Evidence from Observations: Reported | |||||||||||||||||||||||||||||
| An active lava lake was apparently present in Nindirí Crater from 1524 to 1544, when Spanish Friars passing through Nicaragua all investigated the volcano. The Spanish chronicler Oviedo observed the lava lake when he climbed the volcano in July 1529. In 1534 Friar Bartolome de las Casas reported that a letter could be read as far away as the town on Nindirí by the glow of lava. In 1538 Friar Blas del Castillo attempted to scoop out some of the incandescent material under the assumption it was molten gold. Friar Toribio Benvente observed the active lava lake (Incer, 1988 unpub. manuscript and pers. comm.). INETER (1999-) mentioned a 16th-century eruption only in 1520. | ||||||||||||||||||||||||||||||
|
List of 4 Events for Episode 1 at Nindirí
| ||||||||||||||||||||||||||||||
0150 (?) Confirmed Eruption VEI: 5
| Episode 1 | Eruption | Masaya Tuff | |||||||||||||||||||||||||||||
|---|---|---|---|---|---|---|---|---|---|---|---|---|---|---|---|---|---|---|---|---|---|---|---|---|---|---|---|---|---|---|
| 0150 (?) - Unknown | Evidence from Correlation: Tephrochronology | |||||||||||||||||||||||||||||
| The Masaya Tuff (MT tephra) was produced during a Surtseyan eruption about 1,800 years ago that concluded with eruption of the Plinian scoria fall Ticuantepe Lapilli (TIL tephra) (Perez and Kutterolf, 2006). Inclusion of offshore deposits gave an estimated tephra volume of 6.6 km3 (Kutterolf et al., 2008). | ||||||||||||||||||||||||||||||
|
List of 4 Events for Episode 1 at Masaya Tuff
| ||||||||||||||||||||||||||||||
0170 BCE ± 100 years Confirmed Eruption VEI: 5
| Episode 1 | Eruption | Masaya Triple Layer | ||||||||||||||||||||||||||||||||||||||||||||
|---|---|---|---|---|---|---|---|---|---|---|---|---|---|---|---|---|---|---|---|---|---|---|---|---|---|---|---|---|---|---|---|---|---|---|---|---|---|---|---|---|---|---|---|---|---|
| 0170 BCE ± 100 years - Unknown | Evidence from Isotopic: 14C (uncalibrated) | ||||||||||||||||||||||||||||||||||||||||||||
| The Plinian eruption that deposited the Masaya Triple Layer tephra was 14C dated at 2,120 ± 120 BP (Fruendt et al., 2006; Perez and Feundt, 2006). The La Concepcion Tephra was also considered to be part of the Masaya Triple Layer eruption (Kutterolf et al., 2007). The famous footprint layer at Masaya was produced during the early stages of this eruption. | |||||||||||||||||||||||||||||||||||||||||||||
|
List of 7 Events for Episode 1 at Masaya Triple Layer
| |||||||||||||||||||||||||||||||||||||||||||||
4050 BCE (?) Confirmed Eruption VEI: 6
| Episode 1 | Eruption | NW of caldera, San Antonio Tephra | ||||||||||||||||||||||||||||||||||||||||||||
|---|---|---|---|---|---|---|---|---|---|---|---|---|---|---|---|---|---|---|---|---|---|---|---|---|---|---|---|---|---|---|---|---|---|---|---|---|---|---|---|---|---|---|---|---|---|
| 4050 BCE (?) - Unknown | Evidence from Correlation: Tephrochronology | ||||||||||||||||||||||||||||||||||||||||||||
| A basaltic Plinian eruption dated about 6,500 BP produced the widespread San Judas scoria unit (Williams, 1983). Later work refers to this unit as the San Antonio Tephra (SAT), which was considered to have been emplaced about 6,000 BP and to have had a volume of 13.5 km3 (Perez and Freundt, 2006; Kutterolf et al., 2008). | |||||||||||||||||||||||||||||||||||||||||||||
|
List of 7 Events for Episode 1 at NW of caldera, San Antonio Tephra
| |||||||||||||||||||||||||||||||||||||||||||||
There is data available for 1 deformation periods. Expand each entry for additional details.
| Start Date: 2007 | Stop Date: 2010 | Direction: Subsidence | Method: InSAR |
| Magnitude: Unknown | Spatial Extent: Unknown | Latitude: Unknown | Longitude: Unknown |
Remarks: Subsidence within ring fault | |||
Reference List: Ebmeier et al. 2013.
Full References:
Ebmeier S K, Biggs J, Mather T A, Amelung F, 2013. On the lack of InSAR observations of magmatic deformation at central American volcanoes. J. Geophys. Res.. https://doi.org/10.1002/jgrb.50195
There is no Emissions History data available for Masaya.
 Masaya is one of Nicaragua's most unusual and most active volcanoes. It is a broad, 6 x 11 km basaltic caldera with steep-sided walls up to 300-m high. The caldera is filled on its NW end by more than a dozen vents erupted along a circular, 4-km-diameter fracture system. The twin volcanoes of Nindirí and Masaya are seen here from the east caldera rim above Lake Masaya. Masaya has been frequently active since the time of the Spanish Conquistadors, when an active lava lake prompted several attempts to extract the volcano's molten "gold."
  A broad expanse of lava flows extends across the floor of Nicaragua's Masaya caldera, with the wall forming the arcuate rim in the background. The lava flows originated from the post-caldera cones of Masaya and Nindirí. Lake Masaya is located against the eastern caldera wall. Recent lava flows have flooded much of the caldera and have overflowed its rim in one location on the NE side. This view from the NW shows Mombacho volcano in the distance.
 A tumulus on the surface of a pahoehoe lava flow in the foreground is exposed on the western flank of Masaya volcano, with Nindirí cone rising in the background. Nindirí is the westernmost cone of Masaya's summit complex and is cut by a large summit crater not apparent from this vantage point.
  Masaya Volcano National Park provides visitors with the opportunity to observe activity at a frequently active volcano. This observation point on the NE side of Santiago crater is easily accessible from the capital city of Managua. The hazards of close access were underscored in April 2001, when a sudden explosion without precursors ejected blocks onto the parking lot and the surrounding area during a visit by cruise ship passengers. Fortunately, only minor injuries occurred.
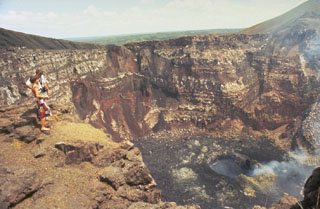 Steep-walled Santiago crater provides a dramatic perspective into the vent of an active volcano. The crater floor is covered by recent lava flows and fume rises from an inner crater. The walls of the 600-m-wide crater expose stacked lava flows, truncated lava lakes, and pyroclastic material erupted from earlier vents.
 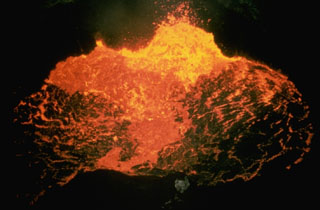 A new lava lake appeared on the floor of Santiago Crater in October 1965, marking the beginning of Masaya's third 20th-century lava-lake cycle. By 1969 activity was restricted to a small spatter cone in the center of the crater. Several lava flows erupted on the crater floor between 1965 and 1972. The spatter cone collapsed in 1972 and lava lake activity was visible until 1979, when activity subsided and was followed by dense gas emissions. Small ash eruptions took place on single days in 1981, 1982, 1984, and 1985.
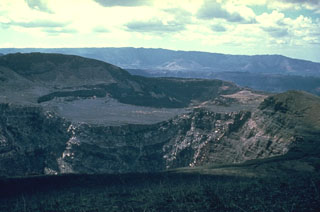 Three Masaya summit craters are visible in this view to the NW; Santiago crater appears in the foreground, with the flat, high surface of Nindirí crater in the middle and San Pedro crater behind it. The flat-lying, lighter-colored lavas in the center are a part of a lava lake emplaced in Nindirí crater during an eruption in July 1852. A small lava flow was also emitted at that time, a few years before the formation of Santiago and San Pedro pit craters in 1858-1859. The NW wall of Masaya caldera forms the low ridge in the middle distance.
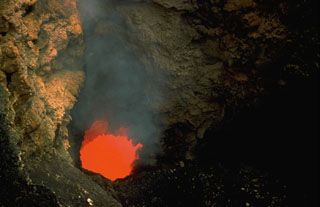 An incandescent vent glows on the floor of Santiago crater in July 1972. A new lava lake formed in Santiago crater in October 1965. By 1969 activity was restricted to a small spatter cone; after it collapsed in 1972 a lava lake was visible until 1979. Periodic lava lake activity has occurred since the time of the Spanish Conquistadors. The partially yellow incandescence of the active lava lake was taken for molten gold, prompting several attempts to mine it.
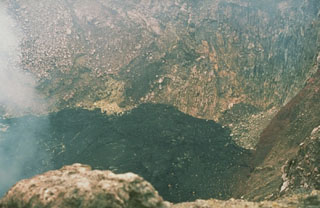 Fresh black lava fills the floor of Santiago crater in December 1976. A new lava lake appeared on the floor of Santiago Crater on October 20, 1965, marking the beginning of Masaya's third 20th-century lava lake cycle. Several lava flows occurred on the crater floor between 1965 and 1972. The spatter cone collapsed in 1972 and lava lake activity was visible until 1979, when the lava lake subsided, producing thick gas emissions.
 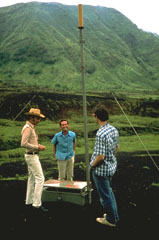 Early monitoring efforts at Masaya volcano included tilt meter stations such as this one, operated by the Instituto Nicaragüense de Estudios Territoriales (INETER). Inflation of the volcano's surface produced by ascent of magma can be detected by sensitive instruments such as the one installed here in 1976.
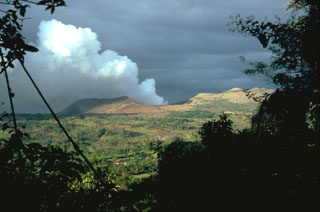 Masaya volcano is noted for long-duration periods of voluminous gas emission. This February 1982 photo from the NE shows a gas plume pouring from Santiago crater, during the 4th gas emission crisis of the 20th century. Emission of a very large gas plume had continued without interruption since the fall of 1979. Remote sensing of SO2 revealed continued high level flux, with a 1500-2000 tons/day average during 1980. Distribution of the gas plumes by prevailing winds caused widespread crop damage.
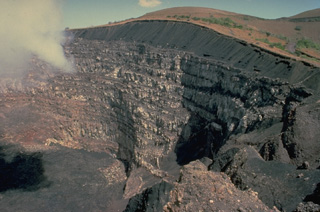 A thick stack of about 20 lava flows is exposed in the 230-m-high eastern walls of Santiago crater, overlain by a sequence of black basaltic ash deposits. The 600-m-wide Santiago crater is seen here from a viewpoint on the SW crater rim. Santiago crater is located on the west side of the post-caldera cone of Nindirí, and has been the source of most historical eruptions of Masaya.
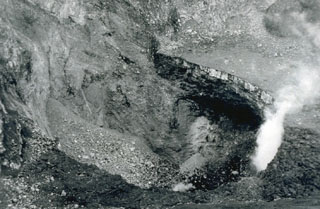 A small eruption occurred from Santiago crater on February 15, 1987 following blockage of the vent by landslides in November and December 1986. The small eruption ejected ash and blocks, which fell back into the bottom of the vent. Additional collapses took place on February 20, and the circular vent continued to produce small eruptions after February 22. This photograph of Santiago's inner crater (180 m in diameter and 72 m deep) was taken after the collapse events of late 1986 and early 1987.
 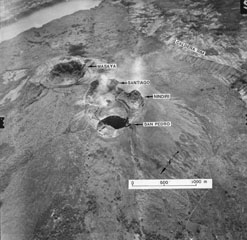 An aerial oblique photo from the NW shows the summit crater complex of Masaya volcano. The wall of the 6 x 11 km wide caldera inside which the central cone complex was constructed can be seen at the upper right and the extreme upper left (where it contains Lake Masaya).
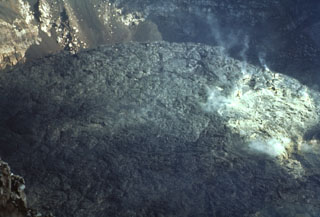 An October 1971 photo from the crater rim shows a fresh black lava flow extruded onto the crater floor. Fumaroles rise from the surface of the flow at the right. Masaya began a long-duration eruptive period in 1965. Several lava flows, such as this one, were erupted between 1965 and 1972. An active lava lake was visible until 1979, and intermittent small explosive eruptions lasted until 1985.
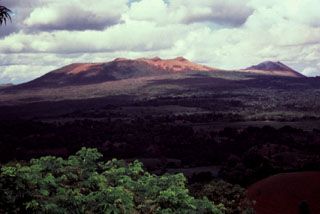 The Masaya central cone complex within the Holocene Masaya caldera (foreground) lies within a larger Pleistocene caldera, the Las Sierras (or Las Nubes) caldera, which was formed following the eruption of a major ignimbrite about 30,000 years ago. The ignimbrite deposit from this eruption is found in the Managua area, where it is cut by faults of the Managua Graben, which extends to the north, constraining the SE margins of Lake Managua.
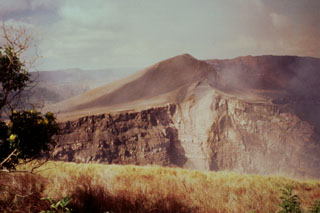 Santiago crater, seen here from the NE, formed in 1853. A strong detonation on April 9, 1853 was followed by heavy gas emission with no noticeable ejection of pyroclastic material. Flames were seen at the summit of the volcano on the night of September 15 from the town of Masatepe and later investigation revealed a new 80 x 65 m wide crater (later known as Santiago) with incandescent lava surrounded by volcanic bombs. Santiago pit crater expanded significantly in 1858-1859 and is now 600 m wide.
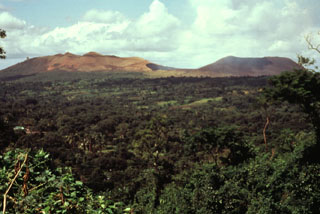 Masaya (left) and Nindirí (right) cones are seen here from the NW across the floor of Masaya caldera. Santiago crater, the source of most of Masaya's historical eruptions, lies in the saddle between the two cones. Historical and prehistorical lava flows blanket the caldera floor.
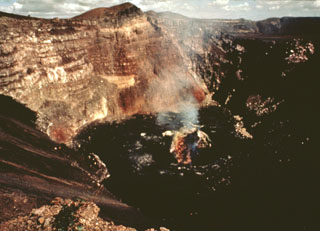 Fume rises in 1978 from a vent on the floor of Santiago crater, seen here from its SE rim. The floor of the crater is covered by fresh lava flows erupted between 1965 and 1972. A lava lake was present on the part of the crater floor until 1979, and intermittent explosive activity continued until 1985.
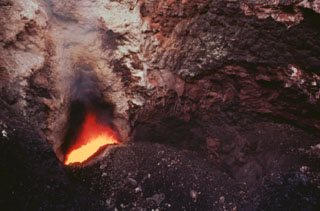 Incandescent magma is visible in 1996 at the bottom of Santiago crater from a vent below the south crater wall. A small strombolian eruption on December 5, 1996 ejected blocks (<10 cm in diameter), ash, and Pele's hair. Some of the inner crater walls collapsed, partly closing the incandescent vent. Prior to this eruption the vent's gas temperature was 1,084°C; afterwards, it dropped to 360°C.
 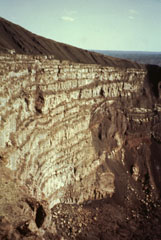 Santiago crater was initially formed in 1853, but the present pit crater formed during the 1858-1859 eruption. A column of flames and ash eruptions were reported on January 27 and March 27, 1859 accompanied by collapse of Santiago and San Pedro Craters. After its initial collapse, Santiago pit crater was a vertical cylinder about 150 m deep and 600 m across. By the time of the 1865 visit of Seebach, the craters had evolved to their present configuration.
 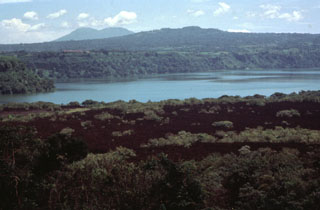 The sparsely vegetated lava flow in the foreground was emplaced during an eruption in 1772. The flow originated from a vent on the north side of Old Masaya crater and traveled to the north. One lobe passed through a notch in the northern caldera rim, while the lobe seen in this photo was deflected by the caldera rim and traveled to the SE into Lake Masaya, which is ponded against the SE caldera rim. The twin-peaked stratovolcano in the distance is Mombacho volcano.
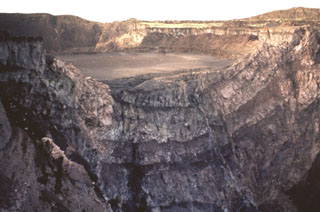 Nindirí crater is partially truncated by the walls of Santiago crater, which formed in 1858-1859. The crater walls reveal flows from lava lakes erupted between 1524 and 1670. An active lava lake was apparently present in Nindirí crater from 1524 to 1544, as reported by Spanish Friars passing through Nicaragua. The Spanish chronicler Oviedo observed the lava lake when he climbed the volcano in July 1529. In 1534 Friar Bartolomé de las Casas reported that a letter could be read at night in the town of Nindirí (6 km away) by the glow of lava.
 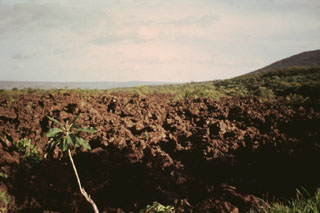 The fresh-looking lava flow in the foreground was erupted in 1772. On March 16 of that year lava emerged from a fissure on the north side of Old Masaya Crater, accompanied by bomb ejection. Part of the flow was diverted by the caldera wall and flowed into Masaya Lake, but much of the flow overtopped the caldera rim and traveled a total of 16 km to near the shores of Lake Managua, cutting the road between Nindirí and Managua and destroying croplands. The eruption lasted about 9 days.
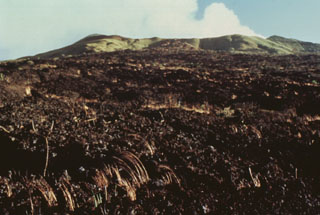 The 1670 lava flow covering much of this photo originated from Nindirí crater on the horizon. A lava lake in the crater eventually overflowed the rim, producing a lava flow that traveled from Nindirí crater for 5 km down the northern flank of Masaya's post-caldera cone. Some accounts confused the 1670 flow from Nindirí with the 1772 flow from Old Masaya crater.
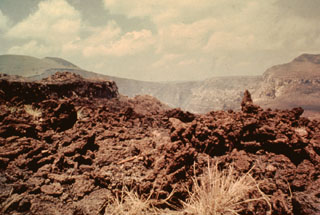 The 1670 lava flow from Nindirí crater in the background is seen here spilling over the crater rim. A series of lava lakes emplaced in 1670 eventually overflowed the rim through this narrow notch and produced a large lava flow that traveled 5 km down the north flank of the intracaldera cone.
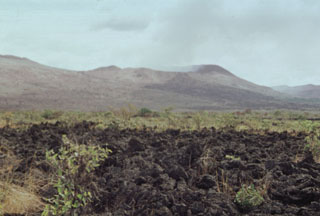 The blocky lava flow in the foreground was erupted in 1772 from a vent on the northern side of Old Masaya cone (extreme left). The dark flow at the upper right spilling over the rim of Nindirí crater was erupted in 1670 and traveled down the northern flank of the cone.
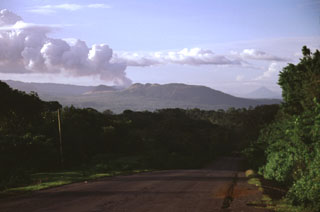 A vigorous gas plume is seen exiting from Masaya volcano in November 1998. Masaya's latest episode of degassing activity began in mid 1993. Prevailing winds typically distribute plumes from Masaya to the west, where they come in contact with the higher-elevation Las Sierras highlands (left horizon). The volcanic emissions during 1998-1999 affected a 1250 km2 area downwind, causing health hazards and extensive vegetation damage, resulting in economic losses to coffee plantations.
 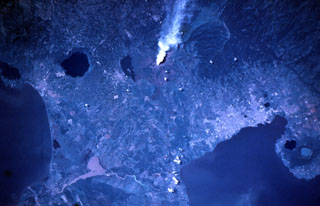 A vigorous steam plume pours from Masaya volcano in this November 9, 1984 Space Shuttle image taken near the end of a two-decade-long eruptive episode. North lies to the lower right, with Lake Nicaragua at the lower left and Lake Managua at the lower right. To the left of the plume from Santiago crater is Lake Masaya (ponded against the rim of Masaya caldera) and the circular lake-filled Apoyo caldera. The two caldera lakes at the lower right are Apoyeque (light blue) and Jiloa (dark-colored), across the bay from the city of Managua.
Maps are not currently available due to technical issues.
The following 3 samples associated with this volcano can be found in the Smithsonian's NMNH Department of Mineral Sciences collections, and may be availble for research (contact the Rock and Ore Collections Manager). Catalog number links will open a window with more information.
| Catalog Number | Sample Description | Lava Source | Collection Date |
|---|---|---|---|
| NMNH 116287-1 | Basalt | NINDIRI - SAN PEDRO | 13 Apr 1951 |
| NMNH 116287-2 | Basalt | SANTIAGO | 13 Apr 1951 |
| NMNH 116287-3 | Basalt | SANTIAGO | 13 Apr 1951 |
| Copernicus Browser | The Copernicus Browser replaced the Sentinel Hub Playground browser in 2023, to provide access to Earth observation archives from the Copernicus Data Space Ecosystem, the main distribution platform for data from the EU Copernicus missions. |
| MIROVA | Middle InfraRed Observation of Volcanic Activity (MIROVA) is a near real time volcanic hot-spot detection system based on the analysis of MODIS (Moderate Resolution Imaging Spectroradiometer) data. In particular, MIROVA uses the Middle InfraRed Radiation (MIR), measured over target volcanoes, in order to detect, locate and measure the heat radiation sourced from volcanic activity. |
| MODVOLC Thermal Alerts | Using infrared satellite Moderate Resolution Imaging Spectroradiometer (MODIS) data, scientists at the Hawai'i Institute of Geophysics and Planetology, University of Hawai'i, developed an automated system called MODVOLC to map thermal hot-spots in near real time. For each MODIS image, the algorithm automatically scans each 1 km pixel within it to check for high-temperature hot-spots. When one is found the date, time, location, and intensity are recorded. MODIS looks at every square km of the Earth every 48 hours, once during the day and once during the night, and the presence of two MODIS sensors in space allows at least four hot-spot observations every two days. Each day updated global maps are compiled to display the locations of all hot spots detected in the previous 24 hours. There is a drop-down list with volcano names which allow users to 'zoom-in' and examine the distribution of hot-spots at a variety of spatial scales. |
|
WOVOdat
Single Volcano View Temporal Evolution of Unrest Side by Side Volcanoes |
WOVOdat is a database of volcanic unrest; instrumentally and visually recorded changes in seismicity, ground deformation, gas emission, and other parameters from their normal baselines. It is sponsored by the World Organization of Volcano Observatories (WOVO) and presently hosted at the Earth Observatory of Singapore.
GVMID Data on Volcano Monitoring Infrastructure The Global Volcano Monitoring Infrastructure Database GVMID, is aimed at documenting and improving capabilities of volcano monitoring from the ground and space. GVMID should provide a snapshot and baseline view of the techniques and instrumentation that are in place at various volcanoes, which can be use by volcano observatories as reference to setup new monitoring system or improving networks at a specific volcano. These data will allow identification of what monitoring gaps exist, which can be then targeted by remote sensing infrastructure and future instrument deployments. |
| Volcanic Hazard Maps | The IAVCEI Commission on Volcanic Hazards and Risk has a Volcanic Hazard Maps database designed to serve as a resource for hazard mappers (or other interested parties) to explore how common issues in hazard map development have been addressed at different volcanoes, in different countries, for different hazards, and for different intended audiences. In addition to the comprehensive, searchable Volcanic Hazard Maps Database, this website contains information about diversity of volcanic hazard maps, illustrated using examples from the database. This site is for educational purposes related to volcanic hazard maps. Hazard maps found on this website should not be used for emergency purposes. For the most recent, official hazard map for a particular volcano, please seek out the proper institutional authorities on the matter. |
| IRIS seismic stations/networks | Incorporated Research Institutions for Seismology (IRIS) Data Services map showing the location of seismic stations from all available networks (permanent or temporary) within a radius of 0.18° (about 20 km at mid-latitudes) from the given location of Masaya. Users can customize a variety of filters and options in the left panel. Note that if there are no stations are known the map will default to show the entire world with a "No data matched request" error notice. |
| UNAVCO GPS/GNSS stations | Geodetic Data Services map from UNAVCO showing the location of GPS/GNSS stations from all available networks (permanent or temporary) within a radius of 20 km from the given location of Masaya. Users can customize the data search based on station or network names, location, and time window. Requires Adobe Flash Player. |
| DECADE Data | The DECADE portal, still in the developmental stage, serves as an example of the proposed interoperability between The Smithsonian Institution's Global Volcanism Program, the Mapping Gas Emissions (MaGa) Database, and the EarthChem Geochemical Portal. The Deep Earth Carbon Degassing (DECADE) initiative seeks to use new and established technologies to determine accurate global fluxes of volcanic CO2 to the atmosphere, but installing CO2 monitoring networks on 20 of the world's 150 most actively degassing volcanoes. The group uses related laboratory-based studies (direct gas sampling and analysis, melt inclusions) to provide new data for direct degassing of deep earth carbon to the atmosphere. |
| Large Eruptions of Masaya | Information about large Quaternary eruptions (VEI >= 4) is cataloged in the Large Magnitude Explosive Volcanic Eruptions (LaMEVE) database of the Volcano Global Risk Identification and Analysis Project (VOGRIPA). |
| EarthChem | EarthChem develops and maintains databases, software, and services that support the preservation, discovery, access and analysis of geochemical data, and facilitate their integration with the broad array of other available earth science parameters. EarthChem is operated by a joint team of disciplinary scientists, data scientists, data managers and information technology developers who are part of the NSF-funded data facility Integrated Earth Data Applications (IEDA). IEDA is a collaborative effort of EarthChem and the Marine Geoscience Data System (MGDS). |