The Instituto Geofísico del Perú (IGP) reported that a lahar carrying blocks descended the Volcánmayo drainage on the SE flank of Ubinas at 1727 on 26 February. The public was warned to stay away from the drainage and to avoid driving on the Querapi-Ubinas-Huarina highway. The Alert Level remained at Yellow (the second level on a four-color scale) and the public was warned to stay 2 km away from the crater.
Source: Instituto Geofísico del Perú (IGP)
Explosions produced ash plumes in September 2019; several lahars generated in January and February 2020
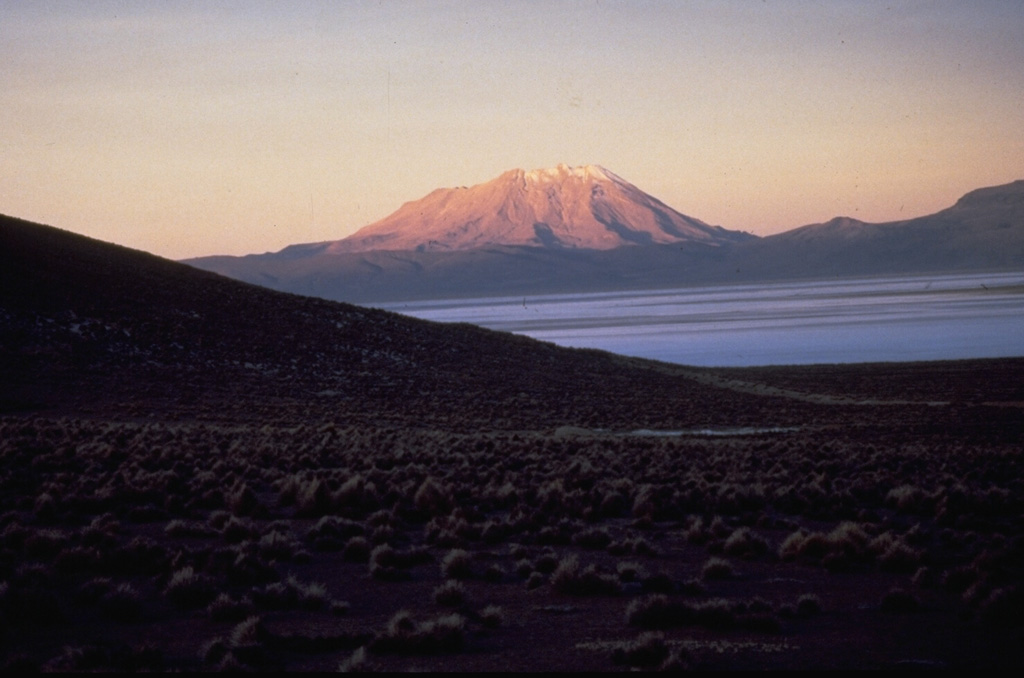
Ubinas, located 70 km from the city of Arequipa in Peru, has produced frequent eruptions since 1550 characterized by ash plumes, ballistic ejecta (blocks and bombs), some pyroclastic flows, and lahars. Activity is focused at the summit crater (figure 53). A new eruptive episode began on 24 June 2019, with an ash plume reaching 12 km altitude on 19 July. This report summarizes activity during September 2019 through February 2020 and is based on agency reports and satellite data.
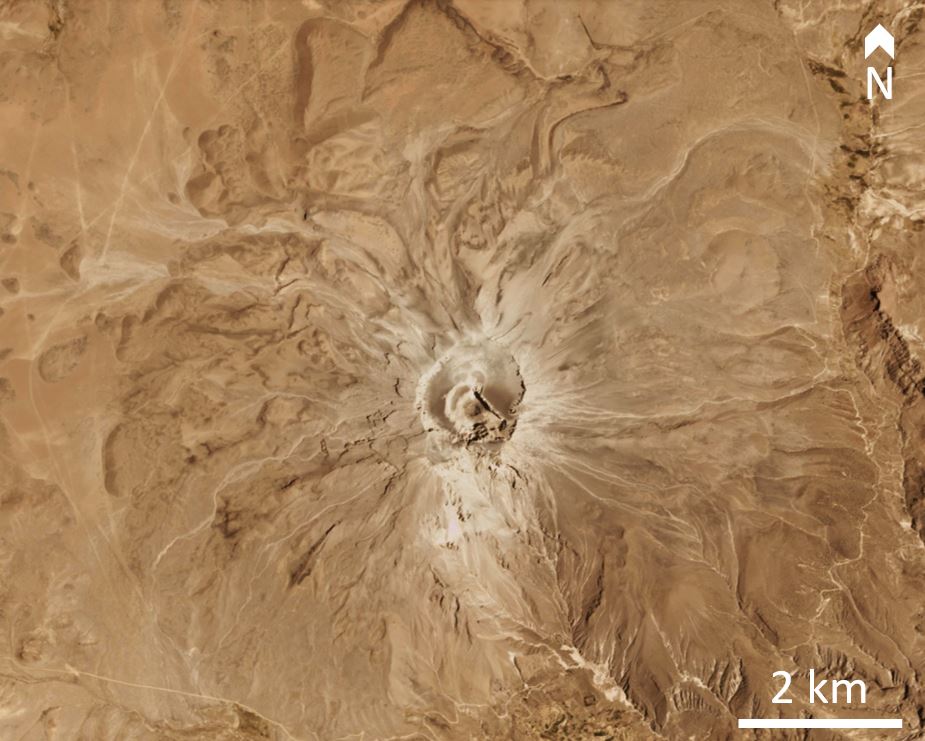 |
Figure 53. A PlanetScope satellite image of Ubinas on 16 December 2019. Courtesy of PlanetLabs. |
Prior to September 2019 the last explosion occurred on 22 July. At 2145 on 1 September moderate, continuous ash emission occurred reaching nearly 1 km above the crater. An explosion produced an ash plume at 1358 on the 3rd that reached up to 1.3 km above the summit; six minutes later ashfall and lapilli up to 1.5 cm in diameter was reported 6 km away, with ashfall reported up to 8 km away (figure 54 and 55). Three explosions produced ash plumes at 0456, 0551, and 0844 on 4 September, with the two later ash plumes reaching around 2 km above the crater. The ash plume dispersed to the south and ashfall was reported in Ubinas, Tonohaya, San Miguel, Anascapa, Huatahua, Huarina, and Matalaque, reaching a thickness of 1 mm in Ubinas.
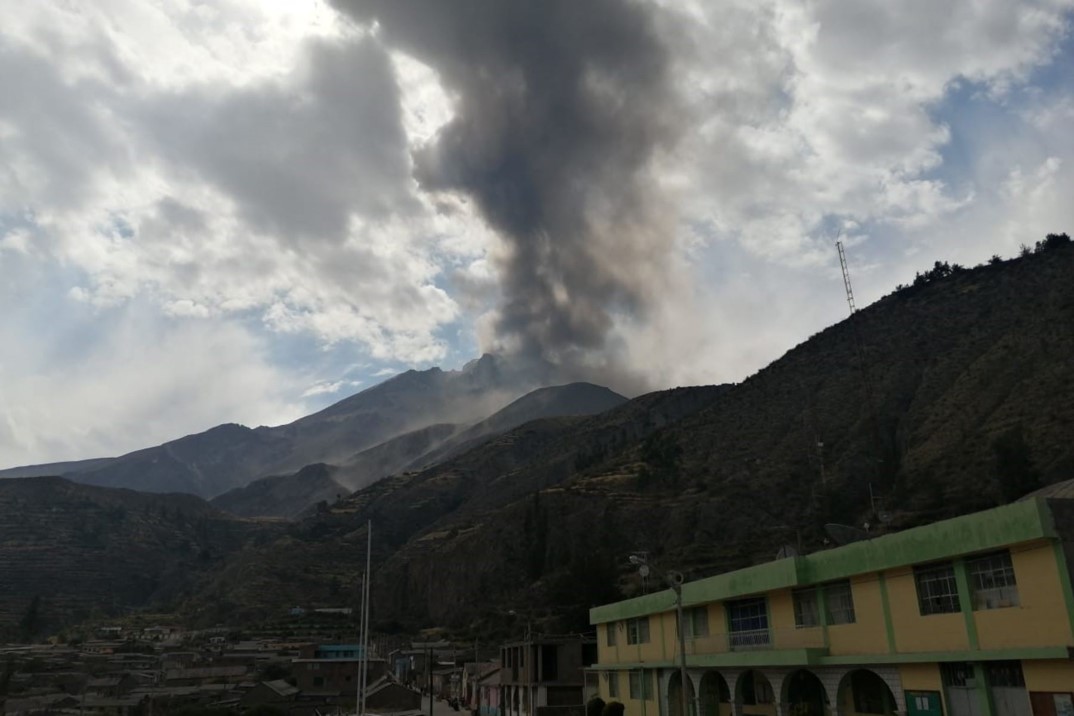 |
Figure 54. An eruption at Ubinas produced an ash plume up to 1.3 km on at 1358 on 3 September 2019. Courtesy of INGEMMET. |
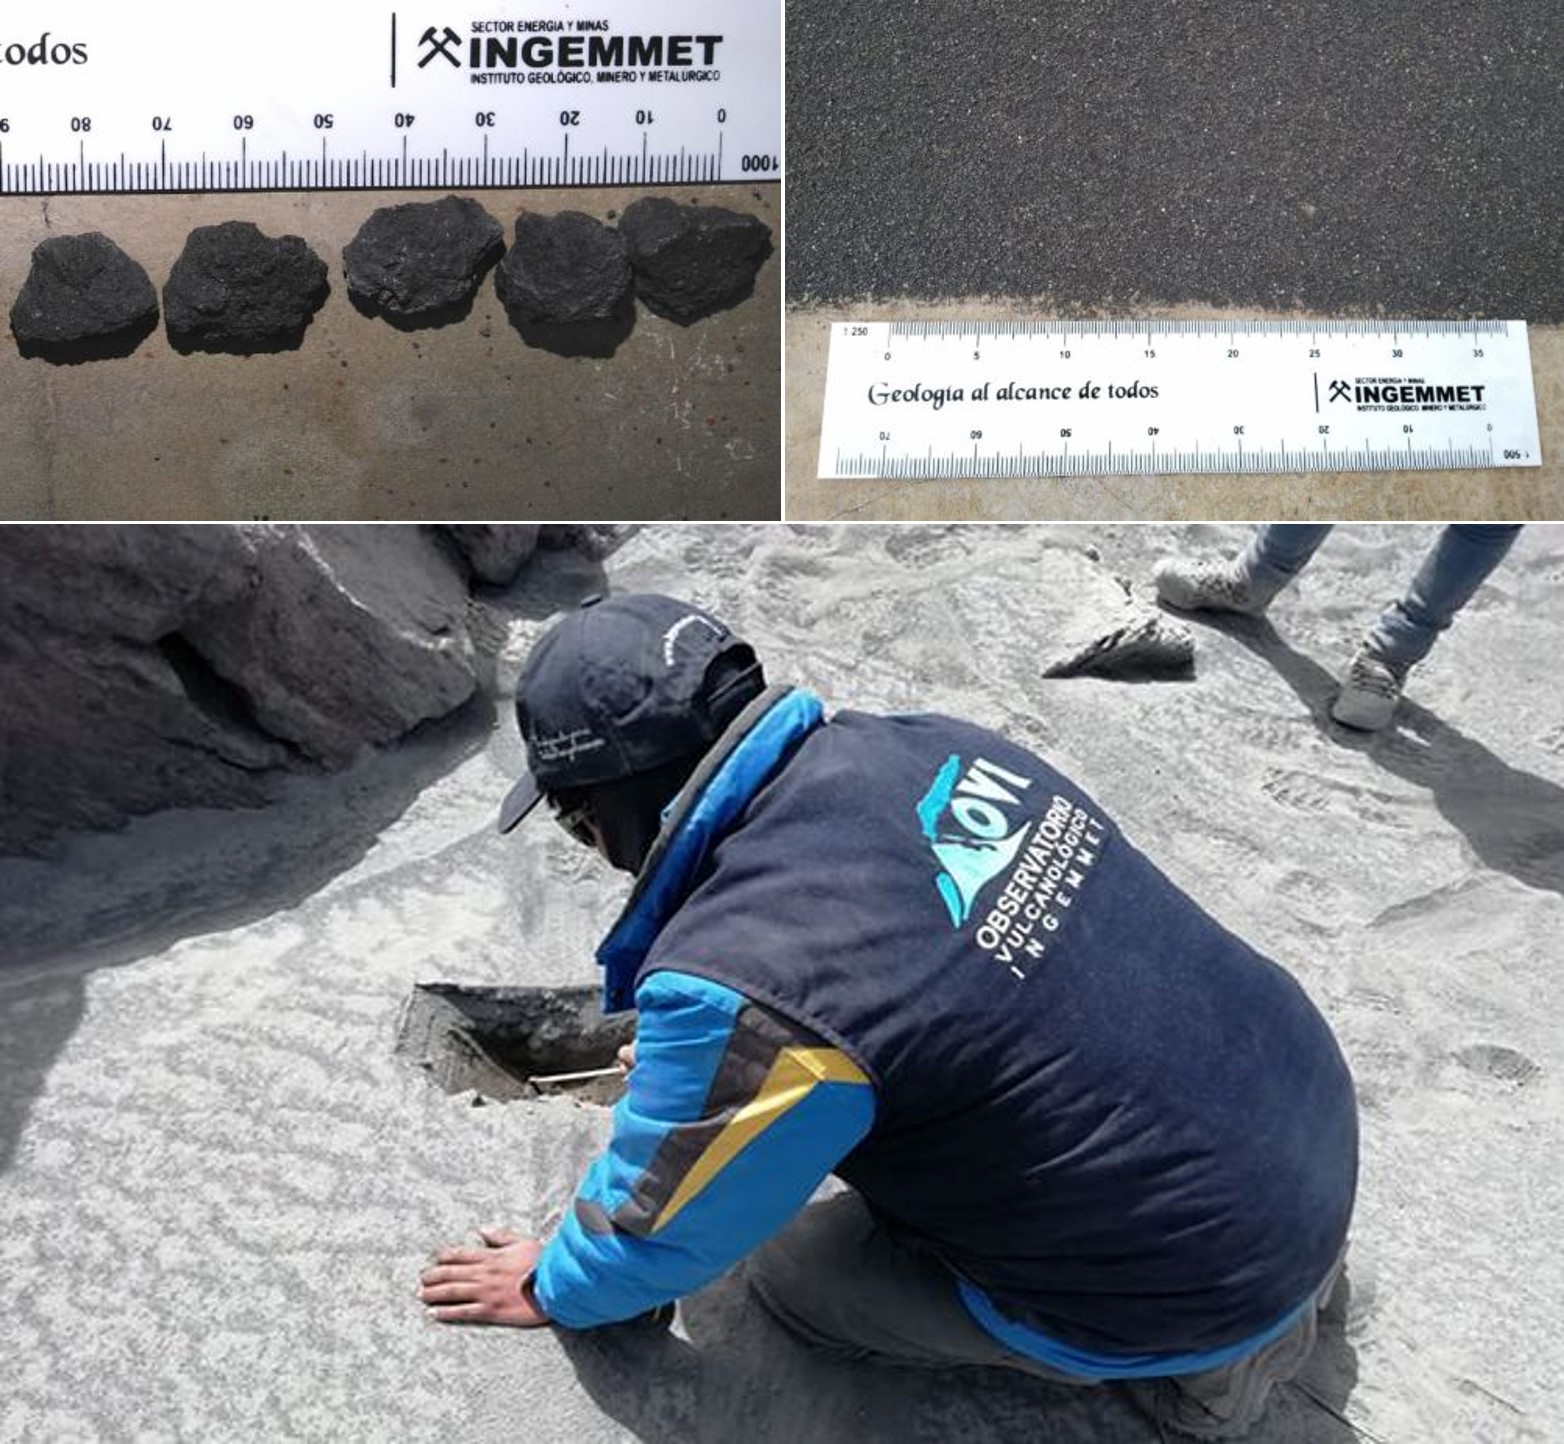 |
Figure 55. Ash and lapilli fall up to 1.5 cm in diameter was reported 6 km away from Ubinas on 3 September 2019 (top) and an Ingemmet geologist collects ash samples from the last three explosions. Courtesy of INGEMMET. |
During 8-9 September there were three explosions generating ash plumes to less than 2.5 km, with the largest occurring at 1358 and producing ashfall in the Moquegua region to the south. Following these events, gas and water vapor were continuously emitted up to 1 km above the crater. There was an increase in seismicity during the 10-11th and an explosion produced a 1.5 km high (above the crater) ash plume at 0726 on the 12th, which dispersed to the S and SE (figure 56). During 10-15 September there was continuous emission of gas (blue in color) and steam up to 1.5 km above the volcano. Gas emission, thermal anomalies, and seismicity continued during 16-29 September, but no further explosions were recorded.
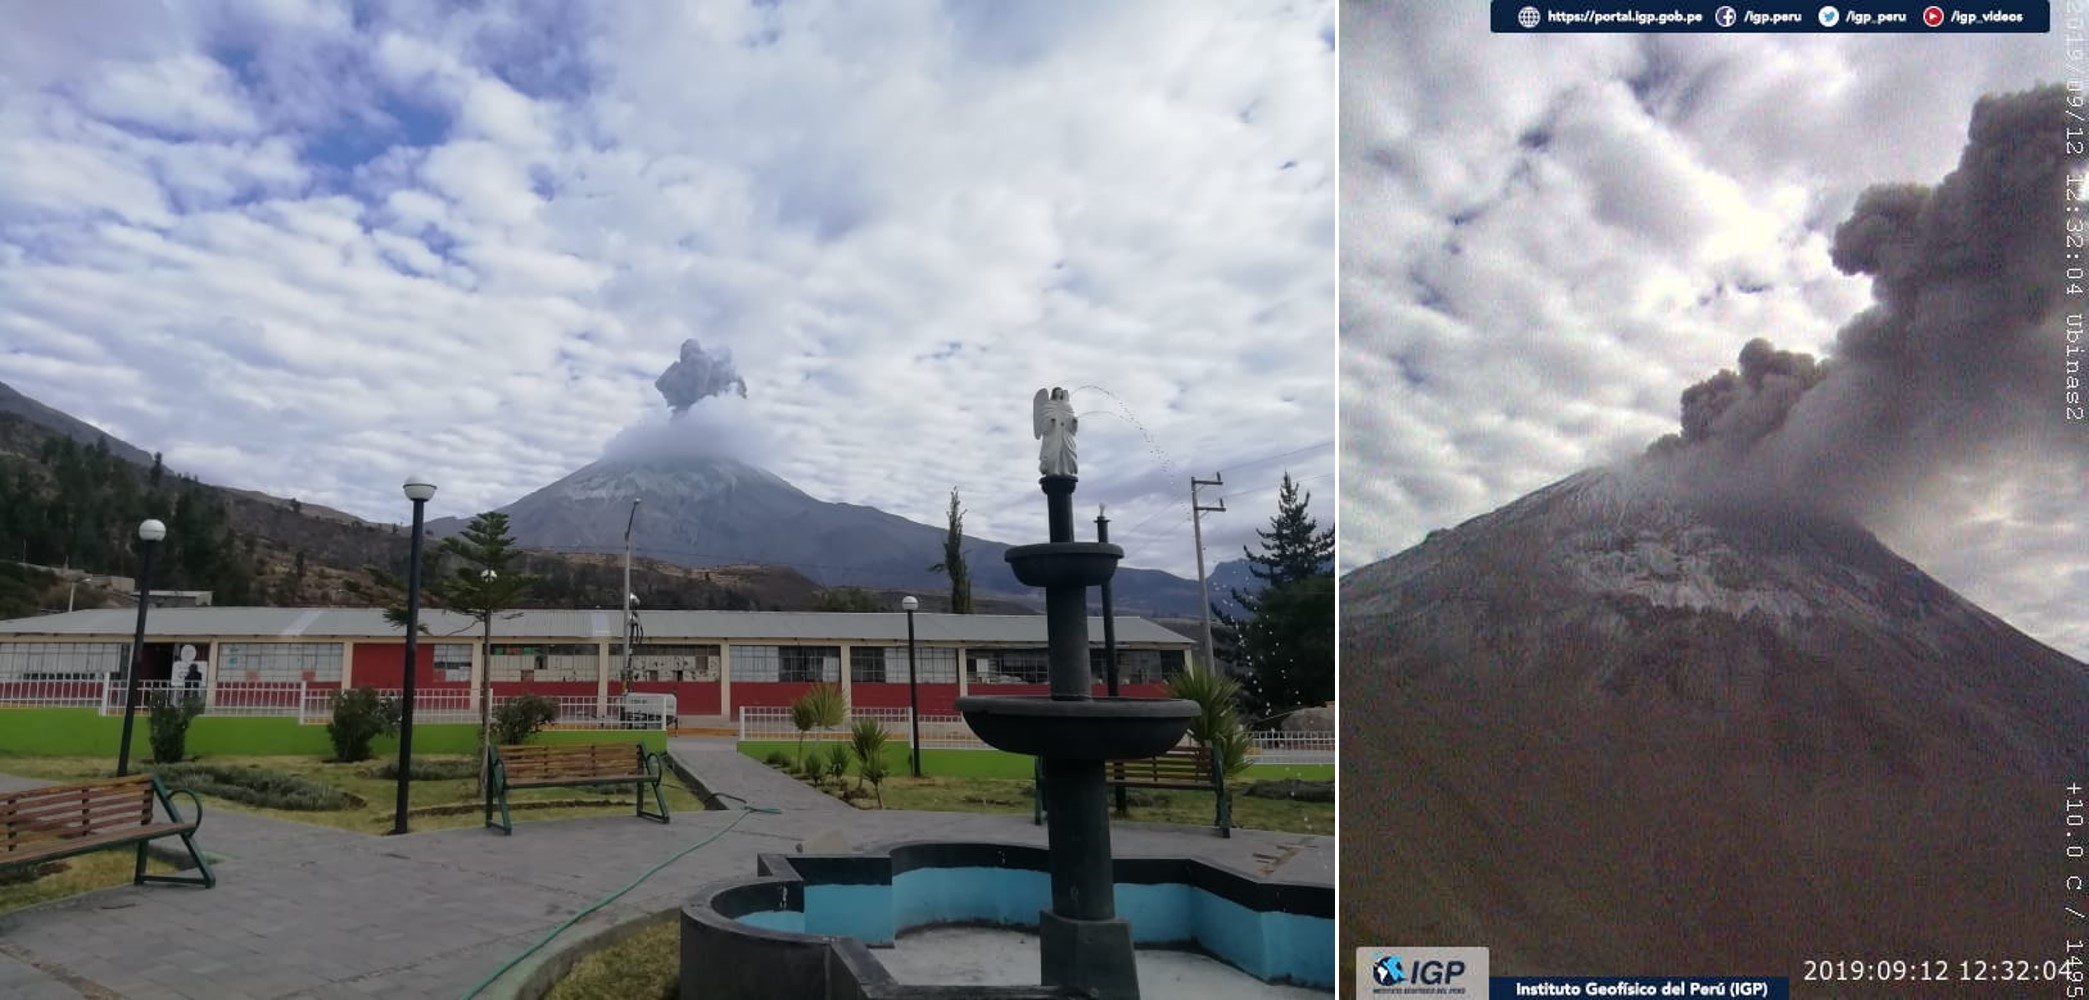 |
Figure 56. An explosion at Ubinas on 12 September 2019 produced an ash plume to 1.5 km above the volcano. The ash dispersed to the S and SE. Courtesy of IGP. |
Throughout October activity consisted of seismicity, elevated temperatures within the crater, and gas emissions reaching 800 to 1,500 m above the crater. No explosions were recorded. Drone footage released in early October (figure 57) shows the gas emissions and provided a view of the crater floor (figure 58). On the 15th IGP reported that the likelihood of an eruption had reduced.
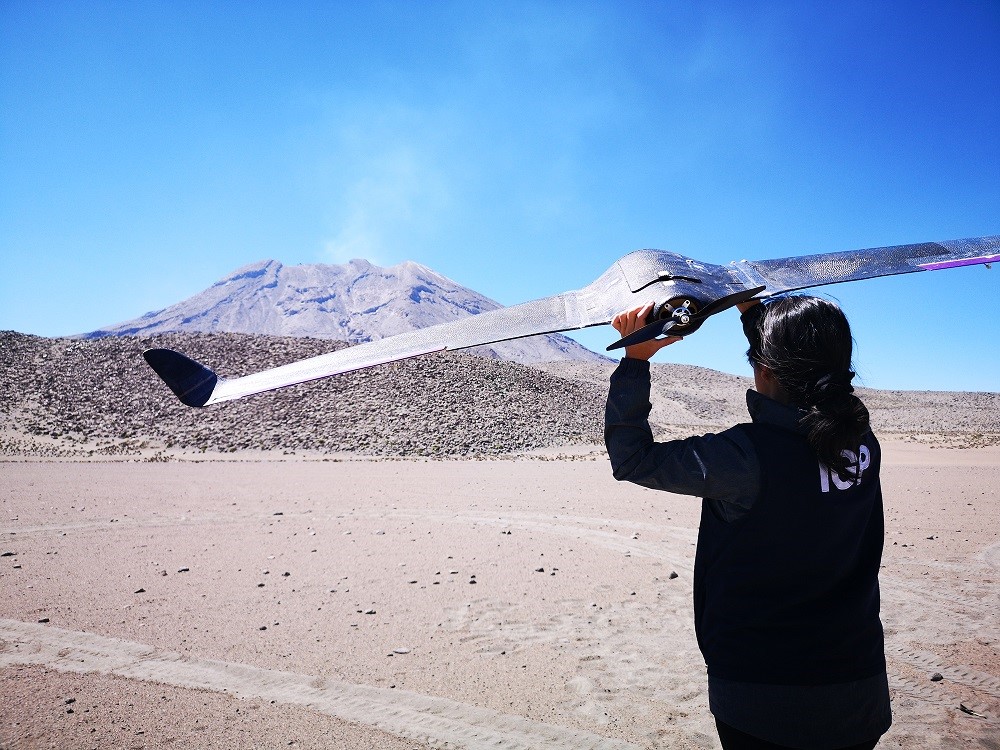 |
Figure 57. IGP flew a fixed-wing drone over Ubinas as part of their monitoring efforts. This photograph shows gas emissions rising from the summit crater, published on 7 October 2019. Courtesy of IGP. |
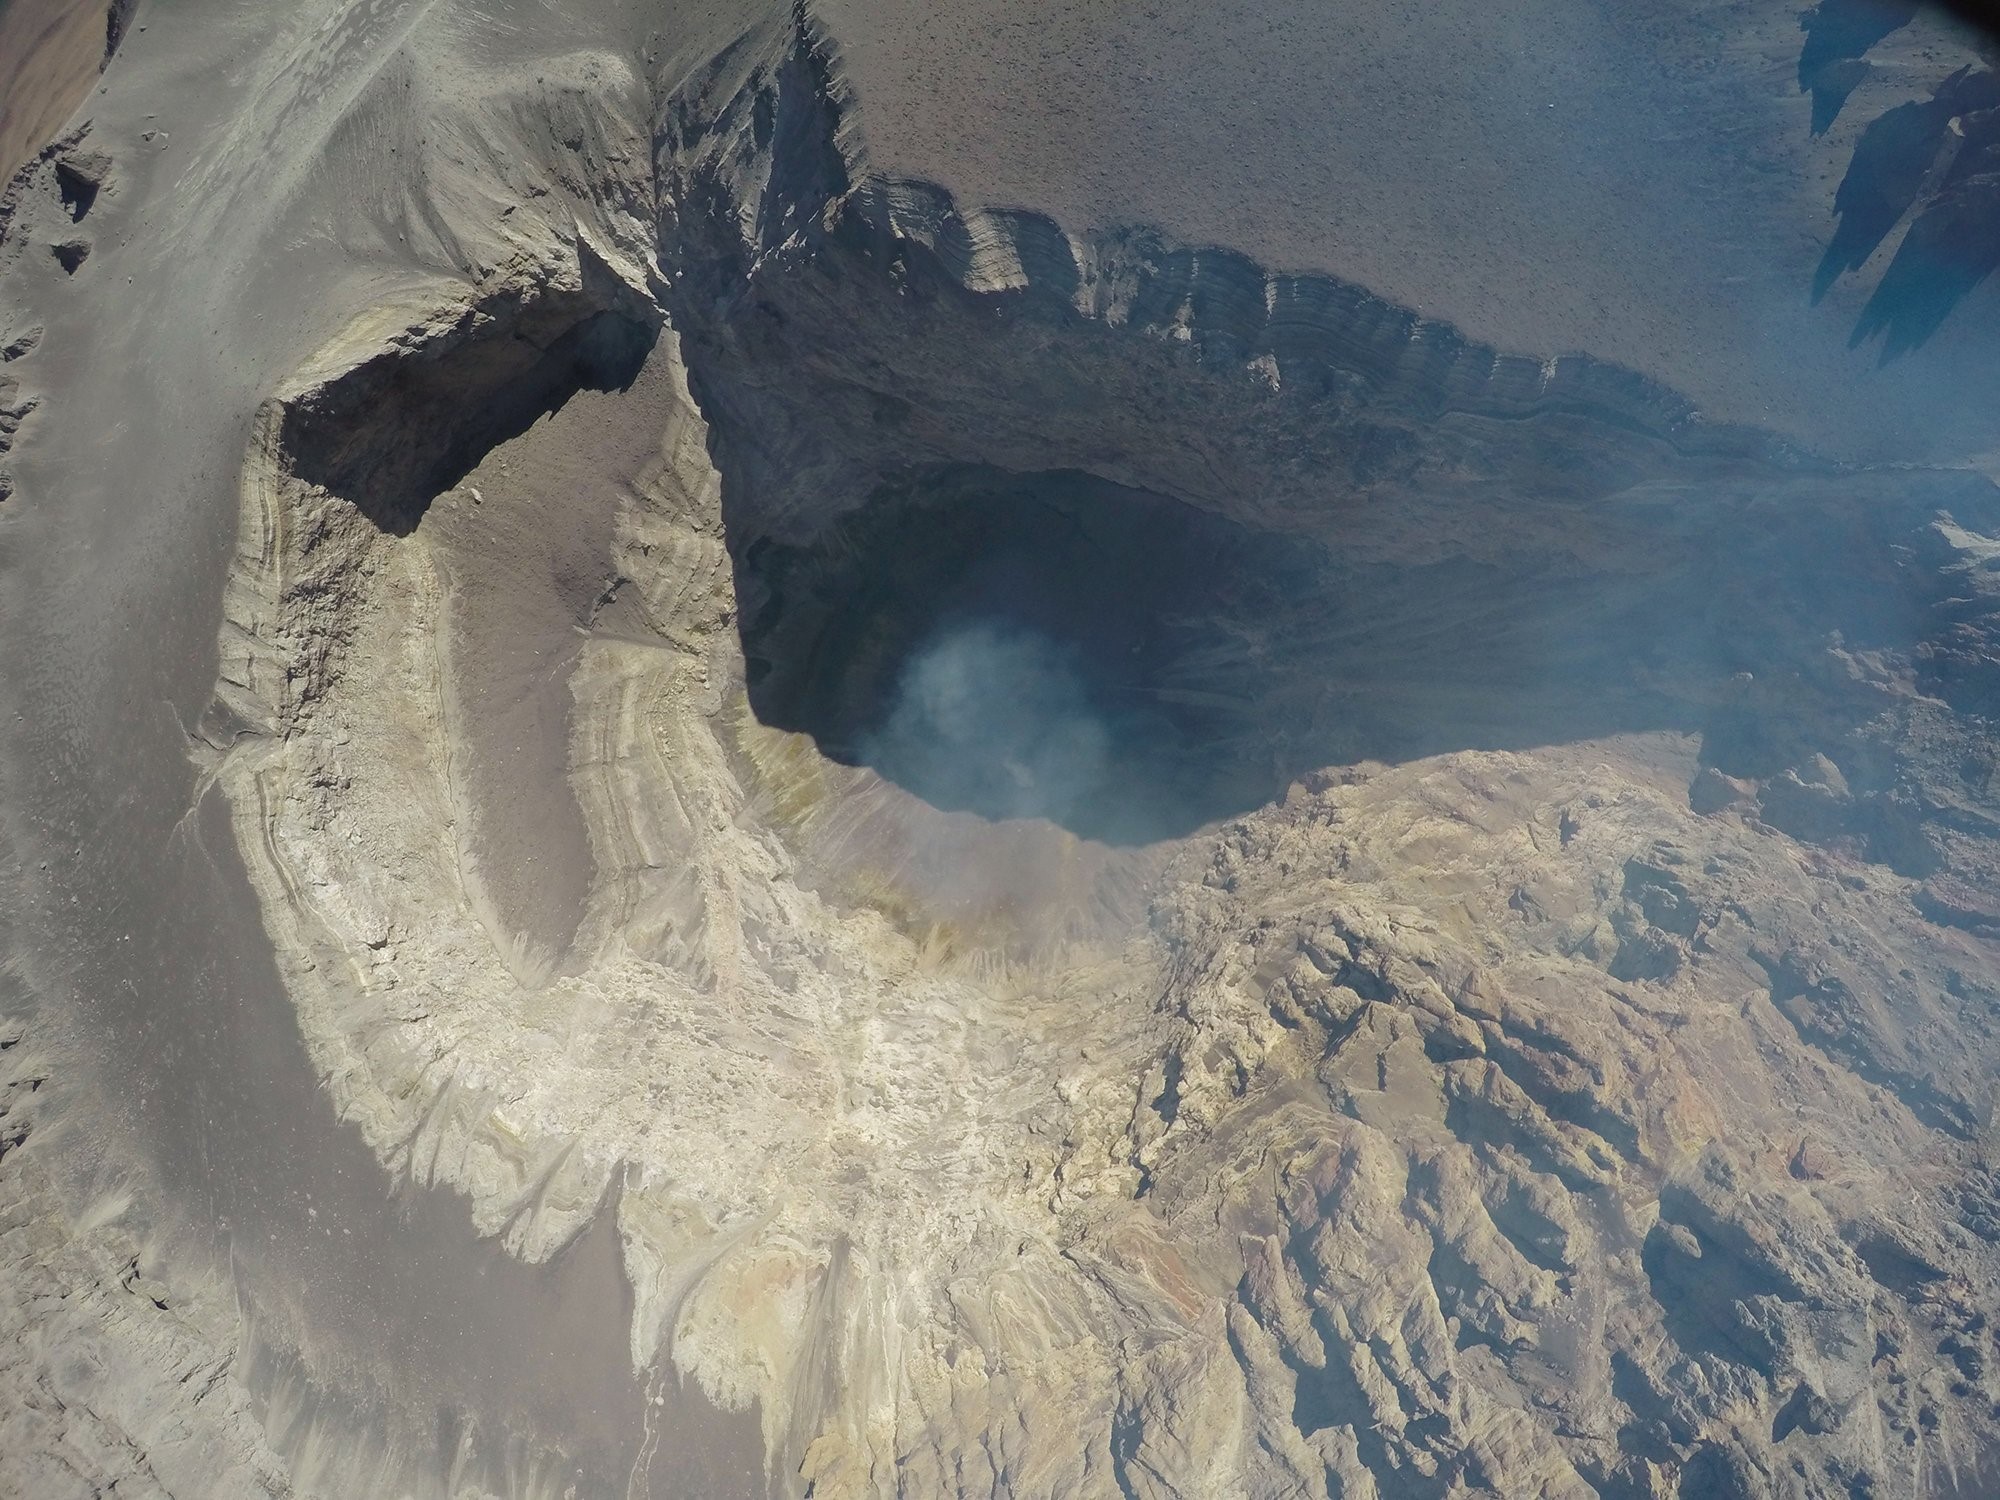 |
Figure 58. Drone image showing gas emissions and the summit crater of Ubinas. Image taken by IGP staff and released on 7 October 2019; courtesy of IGP. |
Similar activity continued through early November with no reported explosions, and the thermal anomalies were no longer detected at the end of November (figure 59), although a faint thermal anomaly was visible in Sentinel-2 data in mid-December (figure 60). A rockfall occurred at 1138 on 13 November down the Volcanmayo gorge.
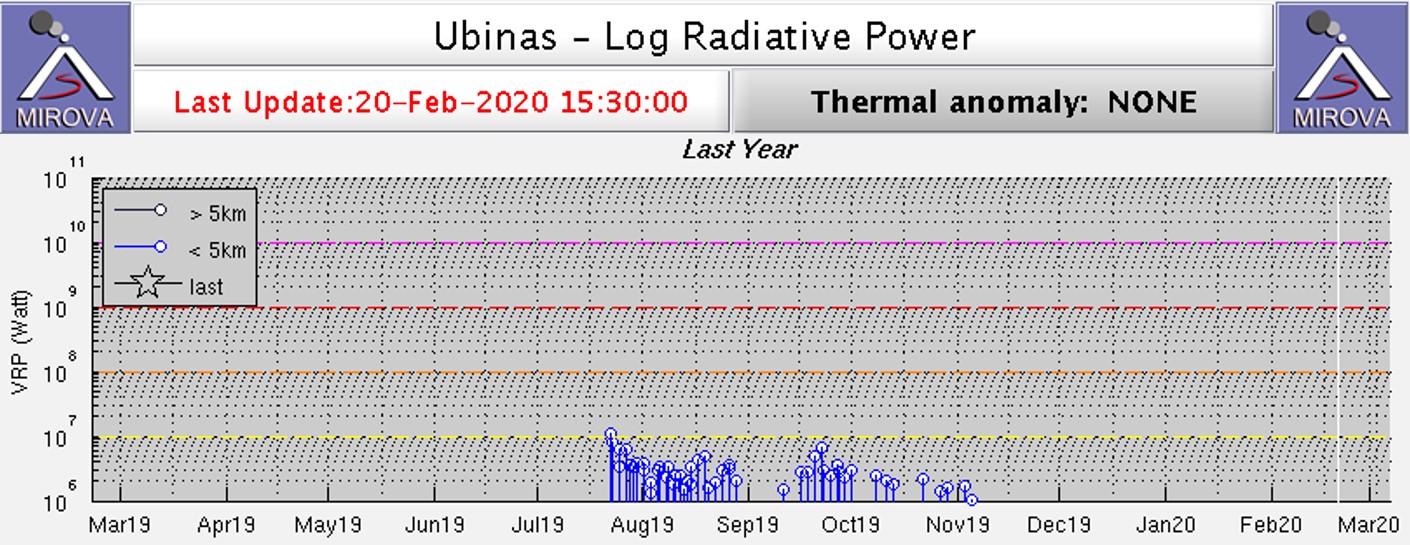 |
Figure 59. This MIROA Log Radiative Power plot shows increased thermal energy detected at Ubinas during August through November 2019. Courtesy of MIROVA. |
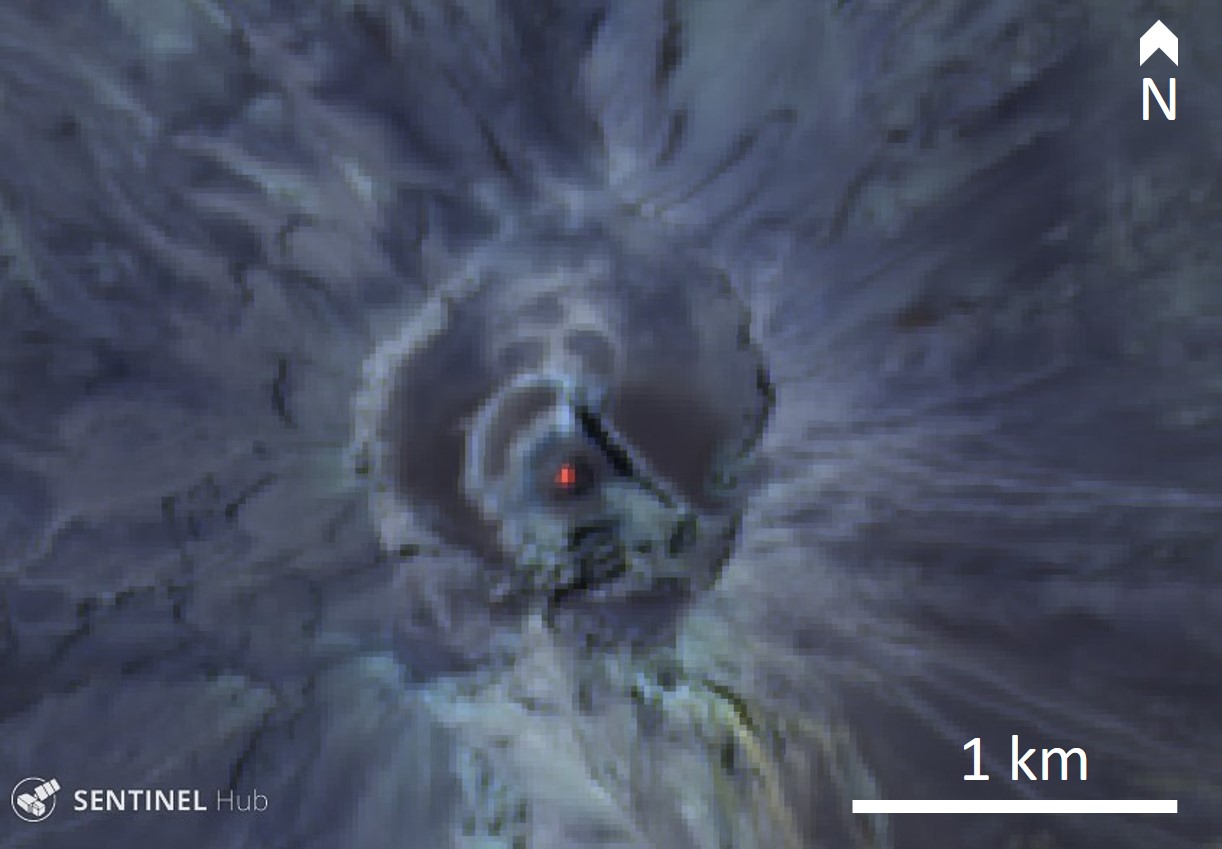 |
Figure 60. Sentinel-2 thermal satellite image showing elevated temperatures in the Ubinas crater on 16 December 2019. Courtesy of Sentinel Hub Playground. |
There were no explosions during January or February 2020, with seismicity and reduced gas emissions continuing. There was a small- to moderate-volume lahar generated at 1620 on 4 January down the SE flank. A second moderate- to high-volume lahar was generated at 1532 on 24 February, and three more lahars at 1325 and 1500 on 29 February, and at 1601 on 1 March, moved down the Volcanmayo gorge and the Sacohaya river channel. The last three lahars were of moderate to large volume.
Information Contacts: Observatorio Volcanologico del INGEMMET (Instituto Geológical Minero y Metalúrgico), Barrio Magisterial Nro. 2 B-16 Umacollo - Yanahuara Arequipa, Peru (URL: http://ovi.ingemmet.gob.pe); Instituto Geofisico del Peru (IGP), Calle Badajoz N° 169 Urb. Mayorazgo IV Etapa, Ate, Lima 15012, Perú (URL: https://www.gob.pe/igp); MIROVA (Middle InfraRed Observation of Volcanic Activity), a collaborative project between the Universities of Turin and Florence (Italy) supported by the Centre for Volcanic Risk of the Italian Civil Protection Department (URL: http://www.mirovaweb.it/); Planet Labs, Inc. (URL: https://www.planet.com/); Sentinel Hub Playground (URL: https://www.sentinel-hub.com/explore/sentinel-playground).
2025: January
| February
2024: January
| February
| March
| May
| June
| July
2023: March
| June
| July
| August
| September
| October
| November
| December
2021: March
2020: May
| December
2019: June
| July
| August
| September
2016: January
| September
| November
2015: March
| April
| May
| June
| July
| August
| September
| October
| November
2014: January
| February
| March
| April
| May
| June
| July
| August
| September
| October
| November
2013: July
| August
| September
| October
2010: July
2009: January
| February
| March
| May
| June
| July
| August
2008: February
| March
| April
| May
| June
| July
| August
| September
| October
| November
| December
2007: January
| February
| March
| April
| May
| June
| July
| August
| September
| October
| November
| December
2006: March
| April
| May
| June
| July
| August
| September
| October
| November
| December
The Instituto Geofísico del Perú (IGP) reported that a lahar carrying blocks descended the Volcánmayo drainage on the SE flank of Ubinas at 1727 on 26 February. The public was warned to stay away from the drainage and to avoid driving on the Querapi-Ubinas-Huarina highway. The Alert Level remained at Yellow (the second level on a four-color scale) and the public was warned to stay 2 km away from the crater.
Source: Instituto Geofísico del Perú (IGP)
The Instituto Geofísico del Perú (IGP) reported that a lahar carrying blocks descended the Volcánmayo drainage on the SE flank of Ubinas at 2052 on 23 February. The public was warned to stay away from the drainage and to avoid driving on the Querapi-Ubinas-Huarina highway. The Alert Level remained at Yellow (the second level on a four-color scale) and the public was warned to stay 2 km away from the crater.
Source: Instituto Geofísico del Perú (IGP)
The Instituto Geofísico del Perú (IGP) reported that a lahar carrying blocks descended the Sacohaya River on the S flank of Ubinas at 1618 on 10 February. The public was warned to stay away from the drainage and to take precautions while driving on the Arequipa-Querapi-Ubinas-Huarina highway. The Alert Level remained at Yellow (the second level on a four-color scale) and the public was warned to stay 2 km away from the crater.
Source: Instituto Geofísico del Perú (IGP)
The Instituto Geofísico del Perú (IGP) reported that a lahar descended the Volcánmayo drainage on the SE flank of Ubinas at 1722 on 31 January. The public was warned to stay away from the drainage and to avoid driving on the Querapi-Ubinas-Huarina highway. The Alert Level remained at Yellow (the second level on a four-color scale) and the public was warned to stay 2 km away from the crater.
Source: Instituto Geofísico del Perú (IGP)
The Instituto Geofísico del Perú (IGP) reported that a lahar descended the Volcánmayo drainage on the SE flank of Ubinas at 1930 on 25 January. The public was warned to stay away from the drainage and to avoid driving on the Querapi-Ubinas-Huarina highway. The Alert Level remained at Yellow (the second level on a four-color scale) and the public was warned to stay 2 km away from the crater.
Source: Instituto Geofísico del Perú (IGP)
Instituto Geofísico del Perú (IGP) reported that during 24-30 July daily seismicity at Ubinas was characterized by 55-116 events associated with rock fracturing and 49-129 events associated with fluid movement. Gas-and-steam emissions were sometimes visible rising 200-600 m above the crater rim. Daily thermal anomalies were identified in satellite images. The Alert Level remained at Yellow (the second level on a four-color scale) and the public was warned to stay 2 km away from the crater.
Source: Instituto Geofísico del Perú (IGP)
Instituto Geofísico del Perú (IGP) reported that during 1-15 June seismicity at Ubinas was characterized by daily averages of 144 events associated with rock fracturing and 73 events associated with fluid movement. Gas, steam, and ash emissions were sometimes visible rising as high as 800 m above the crater rim and drifting mainly E and NE, though ash was not present in the emissions at least during 12-15 June. Sulfur dioxide emissions were minor, averaging 74 tons per day. A total of 23 thermal anomalies were identified in satellite images. Gas-and-steam emissions rose as high as 500 m above the crater rim during 16-17 June. The Alert Level remained at Yellow (the second level on a four-color scale) and the public was warned to stay 2 km away from the crater.
Source: Instituto Geofísico del Perú (IGP)
Instituto Geofísico del Perú (IGP) reported that thermal anomalies from the main crater floor at Ubinas were identified daily during 21-28 May, except during 22-23 May. Daily gas-and-steam plumes rose as high as 900 m above the crater rim. The Alert Level remained at Yellow (the second level on a four-color scale) and the public was warned to stay 2 km away from the crater.
Source: Instituto Geofísico del Perú (IGP)
Instituto Geofísico del Perú (IGP) reported that thermal anomalies from the main crater floor at Ubinas were identified daily during 15-21 May, except for on 15 May. Daily gas-and-steam plumes rose as high as to 1.6 km above the crater rim. The Alert Level remained at Yellow (the second level on a four-color scale) and the public was warned to stay 2 km away from the crater.
Source: Instituto Geofísico del Perú (IGP)
Instituto Geofísico del Perú (IGP) reported that thermal anomalies from the main crater floor at Ubinas were identified almost daily during 7-14 May. Ash, gas, and steam plumes rose to 1.1 km above the crater rim during 7-8 May. Similar plumes emitted continuously for a period of time on 12 May rose to 1.1 km above the crater rim and drifted S and SE. The Alert Level remained at Yellow (the second level on a four-color scale) and the public was warned to stay 2 km away from the crater.
Source: Instituto Geofísico del Perú (IGP)
Instituto Geofísico del Perú (IGP) reported that thermal anomalies from the Ubinas main crater were identified during 5-6 May. At 0516 on 6 May an ash plume rose 2.1 km above the crater rim and drifted more than 10 km SE. Ashfall was reported in the towns of Ubinas (6.5 km SSE), Tonohaya (7 km SSE), Anascapa (11 km SE), San Miguel (10 km SE), Huarina, and Matalaque (17 km SSE). The Alert Level remained at Yellow (the second level on a four-color scale) and the public was warned to stay 2 km away from the crater.
Source: Instituto Geofísico del Perú (IGP)
Instituto Geofísico del Perú (IGP) reported that lahars on the SE flank of Ubinas descended through the Volcánmayo drainage towards the Ubinas River at 1507 on 13 March and at 1454 on 17 March. The public was warned to stay away from the drainage and to avoid driving on the Querapi-Ubinas-Huarina highway.
Source: Instituto Geofísico del Perú (IGP)
Instituto Geofísico del Perú (IGP) reported that a lahar on the SE flank of Ubinas descended through the Volcánmayo drainage towards the Ubinas River at 1445 on 6 March. The public was warned to stay away from the drainage and to avoid driving on the Querapi-Ubinas-Huarina highway.
Source: Instituto Geofísico del Perú (IGP)
Instituto Geofísico del Perú (IGP) reported that lahars on the SE flank of Ubinas descended through the Volcánmayo drainage towards the Ubinas River at 1654 on 29 February and at 1541 on 4 March. The public was warned to stay away from the drainage and to avoid driving on the Querapi-Ubinas-Huarina highway.
Source: Instituto Geofísico del Perú (IGP)
Instituto Geofísico del Perú (IGP) reported that a lahar descended the Volcánmayo drainage on the SE flank at Ubinas at 1745 on 25 February and traveled towards the Ubinas River. The public was warned to stay away from the drainage and to avoid driving on the Querapi-Ubinas-Huarina highway.
Source: Instituto Geofísico del Perú (IGP)
Instituto Geofísico del Perú (IGP) reported that a lahar descended the Volcánmayo drainage on the SE flank at Ubinas at 1645 on 19 February. The report noted that the lahars traveled towards the Ubinas River. The public was warned to stay away from the drainage and to avoid driving on the Querapi-Ubinas-Huarina highway.
Source: Instituto Geofísico del Perú (IGP)
Instituto Geofísico del Perú (IGP) reported that lahars descended the Volcánmayo drainage on the SE flank at Ubinas at 1910 on 23 January, at 2015 on 25 January, and at 1540 on 27 January. The report noted that the lahars traveled towards the Ubinas River and could possibly impact the Districts of Ubinas, Matalaque, and population centers. The public was warned to stay away from the drainage and to avoid driving on the Querapi-Ubinas-Huarina highway. Daily gas-and-steam plumes rose 100-500 m above the summit and drifted in multiple directions during 24-30 January.
Source: Instituto Geofísico del Perú (IGP)
Instituto Geofísico del Perú (IGP) reported that activity at Ubinas was at low levels during 1-15 December. Seismicity was low with daily averages of 143 volcano-tectonic earthquakes indicating rock fracturing and 23 earthquakes signifying the movement of gas and magma. Additionally, there was a total of more than 16 hours of seismic signals associated with ash emissions. During 10-15 December webcam images recorded emissions of gas, steam, and ash that rose as high as 2.5 km above the summit and drifted NW and W. The Alert Level remained at Yellow (the second level on a four-color scale) and the public was warned to stay 2 km away from the crater.
Source: Instituto Geofísico del Perú (IGP)
According to the Washington VAAC an ash puff from Ubinas was identified in a satellite image at 0040 on 11 December rising 5.5 km (18,000 ft) a.s.l. and drifting NW. Webcam images at 0620 and 1220 showed continuous steam emissions possibly containing diffuse ash rising as high as 7 km (23,000 ft) a.s.l. Steam emissions containing small amounts of ash were visible at 1810. Emissions were no longer visible in satellite and webcam images at 0010 on 12 December.
Source: Washington Volcanic Ash Advisory Center (VAAC)
Instituto Geofísico del Perú (IGP) reported that activity at Ubinas was at low levels during 30 October-5 November. Seismicity was low with daily averages of 95 volcano-tectonic earthquakes indicating rock fracturing and 24 long-period earthquakes signifying the movement of gas and magma. Gas-and-steam plumes rose as high as 900 m above the crater rim and drifted E and SE; no explosions nor ash emissions were recorded. The Alert Level was lowered to Yellow (the second level on a four-color scale) and the public was warned to stay 2 km away from the crater.
Source: Instituto Geofísico del Perú (IGP)
Instituto Geofísico del Perú (IGP) reported that the eruption at Ubinas continued during 23-29 October at low-to-moderate levels. There were daily averages of 175 volcano-tectonic earthquakes indicating rock fracturing and 17 long-period earthquakes signifying the movement of gas and magma. Daily gas-and-steam plumes rose as high as 500 m above the crater rim and drifted in multiple directions. At 0043 on 27 October an ash, gas, and steam emission rose 500 m above the crater rim and drifted SE and E. A minor thermal anomaly on the crater floor was visible. The Alert Level remained at Orange (the third level on a four-color scale) and the public was warned to stay 4 km away from the crater.
Source: Instituto Geofísico del Perú (IGP)
Instituto Geofísico del Perú (IGP) reported that the eruption at Ubinas continued during 16-22 October at low-to-moderate levels. There were daily averages of 204 volcano-tectonic earthquakes indicating rock fracturing and 25 long-period earthquakes signifying the movement of gas and magma. Steam-and-gas emissions rose as high as 1 km above the crater rim and drifted E and SE. The Alert Level remained at Orange (the third level on a four-color scale) and the public was warned to stay 4 km away from the crater.
Source: Instituto Geofísico del Perú (IGP)
Instituto Geofísico del Perú (IGP) reported that the eruption at Ubinas continued during 3-9 October at low to moderate levels. There were daily averages of 155 volcano-tectonic earthquakes indicating rock fracturing and 27 long-period earthquakes signifying the movement of gas and magma. In addition, seismic signals associated with ash emissions were recorded for a total of 25 hours during the week. On 4 October IGP reported that an ash plume drifted more than 15 km SW and S. According to the Washington VAAC small, diffuse ash plumes identified in satellite images drifted N, E, SE, and S at altitudes of 5.5-7.6 km (18,000-25,000 ft) a.s.l. during 4-8 October. IGP noted that on 7 October a steam, gas, and ash plume rose as high as 1.9 km above the crater rim and drifted NE, E, and SE. The Alert Level remained at Orange (the third level on a four-color scale) and the public was warned to stay 4 km away from the crater.
Sources: Instituto Geofísico del Perú (IGP); Washington Volcanic Ash Advisory Center (VAAC)
Instituto Geofísico del Perú (IGP) reported that the eruption at Ubinas continued during 25 September-1 October at low-to-moderate levels. There were daily averages of 129 volcano-tectonic earthquakes indicating rock fracturing and 52 long-period earthquakes signifying the movement of gas and magma. A period of continuous ash emissions began at 1656 on 1 October and lasted about 90 minutes; the ash plumes rose as high as 1 km above the crater rim and drifted more than 10 km E, S, and SW. The Alert Level remained at Orange (the third level on a four-color scale) and the public was warned to stay 4 km away from the crater.
Source: Instituto Geofísico del Perú (IGP)
Instituto Geofísico del Perú (IGP) reported that the eruption at Ubinas continued during 11-17 September at low-to-moderate levels. There were daily averages of 144 volcano-tectonic earthquakes indicating rock fracturing and 86 long-period earthquakes signifying the movement of gas and magma. One explosion was recorded on 14 September. INGEMMET noted that sulfur dioxide emissions were at low levels during 14-15 September, averaging 900 tons per day. Ash-and-steam plumes rose 1.6 km above the crater rim and drifted SE and NE, causing ashfall in areas within 5 km downwind. IGP noted that seismic signals associated with ash emissions were recorded for an average of three hours per day during 14-16 September. Ash, gas, and steam emissions visible in webcam images rose as high as 2.6 km above the crater rim and drifted as far as 15 km NE, E, and SE. Deformation data indicated a slight trend of inflation with variations less than 5 mm. The Alert Level remained at Orange (the third level on a four-color scale) and the public was warned to stay 4 km away from the crater.
Sources: Instituto Geofísico del Perú (IGP); Instituto Geológico Minero y Metalúrgico (INGEMMET)
Instituto Geofísico del Perú (IGP) reported that the eruption at Ubinas continued at low-to-moderate levels during 4-10 September. There were daily averages of 183 volcano-tectonic earthquakes indicating rock fracturing and 27 long-period earthquakes signifying the movement of gas and magma. Gas-and-steam emissions rose as high as 1 km above the crater rim and drifted as far as 5 km NE, E, and SE; no explosions or ash plumes were recorded during the week. The Alert Level remained at Orange (the third level on a four-color scale) and the public was warned to stay 4 km away from the crater.
Source: Instituto Geofísico del Perú (IGP)
Instituto Geofísico del Perú (IGP) reported that the eruption at Ubinas continued during 28 August-3 September. There were daily averages of 78 volcano-tectonic earthquakes indicating rock fracturing and 42 long-period earthquakes signifying the movement of gas and magma. In addition, seismic signals associated with ash emissions were recorded for an average of 30 minutes per day, with a maximum of 1 hour on 3 September. Webcams recorded ash-and-gas emissions rising as high as 600 m above the crater rim and drifting as far as 5 km E and SE during 28 August-4 September. The Alert Level remained at Orange (the third level on a four-color scale) and the public was warned to stay 4 km away from the crater.
Source: Instituto Geofísico del Perú (IGP)
Instituto Geofísico del Perú (IGP) reported that the eruption at Ubinas continued during 22-27 August. There were daily averages of 229 volcano-tectonic earthquakes indicating rock fracturing and 54 long-period earthquakes signifying the movement of gas and magma. In addition, seismic signals associated with ash emissions were recorded for an average of eight hours per day, with a maximum of 17 hours on 26 August. An explosion at 1757 on 25 August generated an ash-and-gas plume that rose 4.2 km above the crater rim and drifted up to 25 km in multiple directions. According to the Buenos Aires VAAC diffuse ash-and-gas puffs, both daily and with periods of continuous emissions, reached 6.1-7.3 km (20,000-24,000 ft) a.s.l. (up to 1.6 km above the summit) and drifted multiple directions. The Alert Level remained at Orange (the third level on a four-color scale) and the public was warned to stay 4 km away from the crater.
Sources: Buenos Aires Volcanic Ash Advisory Center (VAAC); Instituto Geofísico del Perú (IGP)
Instituto Geofísico del Perú (IGP) and Instituto Geológico Minero y Metalúrgico (INGEMMET) reported that the eruption at Ubinas continued during 14-21 August. According to IGP there were a daily average of 104 volcano-tectonic earthquakes indicating rock fracturing and 71 long-period earthquakes signifying the movement of gas and magma. In addition, seismic signals associated with ash emissions were recorded for an average of eight hours per day, with a maximum of 14 hours on 17 August. According to the Buenos Aires VAAC diffuse ash-and-gas puffs rose 6.4-7.6 km (21,000-25,000 ft) a.s.l. (0.7-1.9 km above the summit) and drifted W, NW, and N during 15-18 August. IGP noted that ash-and-gas plumes rose as high as 3.5 km above the crater rim and drifted as far as 50 km W, NW, N, and NE; ash advisories were issued on 17, 18, and 21 August. Explosions were recorded at 0141 and 0918 on 21 August. The Alert Level remained at Orange (the third level on a four-color scale) and the public was warned to stay 4 km away from the crater.
Sources: Instituto Geofísico del Perú (IGP); Instituto Geológico Minero y Metalúrgico (INGEMMET); Buenos Aires Volcanic Ash Advisory Center (VAAC)
Instituto Geofísico del Perú (IGP) and Instituto Geológico Minero y Metalúrgico (INGEMMET) reported that the eruption at Ubinas continued during 7-13 August. According to IGP a daily average of 102 volcano-tectonic earthquakes indicating rock fracturing and 60 long-period earthquakes signifying the movement of gas and magma. An explosion on 10 August produced an ash plume that rose 2.4 km above the crater rim and drifted 25 km SE and E. Ashfall was reported in Ubinas, Matalaque, and Chojata. INGEMMET noted that sulfur dioxide emissions were at moderate levels during 10-11 and 13-14 August, averaging 2,400-3,700 tons per day. Ash-and-steam plumes rose as high as 800 m and drifted E, SE, S, and W during 13-14 August. The Alert Level remained at Orange (the third level on a four-color scale) and the public was warned to stay 4 km away from the crater.
Sources: Instituto Geofísico del Perú (IGP); Instituto Geológico Minero y Metalúrgico (INGEMMET)
Instituto Geofísico del Perú (IGP) and Instituto Geológico Minero y Metalúrgico (INGEMMET) reported that the eruption at Ubinas continued during 31 July-7 August. According to IGP a daily average of 115 volcano-tectonic earthquakes indicating rock fracturing and 124 long-period earthquakes signifying the movement of gas and magma 31 July-6 August. In addition, there were four seismic signals associated with explosive events (mainly on 1 and 6 August) and 6-9 daily hours of seismic signals related to ash emissions. At 2110 on 1 August a major explosion produced an ash plume that rose as high as 5.4 km above the crater rim and ejected blocks as far as 3 km from the crater onto the SW, S, and SE flanks. The ash plume drifted 30 km E, SE, S, SW, and W, causing ashfall in the districts of Ubinas (6 km SE) and Chojata (19 km ESE). Ash-and-gas emissions rose as high as 2 km and drifted in multiple directions on the other days of the week. Ashfall was reported within a 15-km radius. An explosion at 0009 on 6 August produced a gas-and-ash plume that rose 1.4 km and drifted SE and E, causing ashfall in Ubinas and Chojata and other areas within a 30-km radius. INGEMMET noted that sulfur dioxide emissions were low on 7 August, averaging 400 tons per day. The Alert Level remained at Orange (the third level on a four-color scale) and the public was warned to stay 4 km away from the crater.
Sources: Instituto Geofísico del Perú (IGP); Instituto Geológico Minero y Metalúrgico (INGEMMET)
Instituto Geofísico del Perú (IGP) reported that the eruption at Ubinas continued during 26 July through 1 August. According to IGP there were 60 volcano-tectonic earthquakes recorded during 24-30 July indicating rock fracturing and 117 long-period earthquakes signifying the movement of gas and magma. In addition, there were five seismic signals associated with explosive events and 5-13 hours of seismic signals related to ash emissions. The Buenos Aires VAAC reported that intermittent ash emissions detected in satellite imagery rose to 6-7.3 km altitude and drifted NE on 26 July. Ash plumes on 27 July reached 5.5-6.4 km altitude and drifted NE and ENE based on webcam imagery. Ash emissions on 28 July rose to 6.4 km altitude and drifted E and SE. On 29 July small ash plumes rose to 6.7-7.9 km altitude and drifted SE, though they were mostly obscured by weather clouds. IGP reported that at 0957 on 29 July an explosion produced an ash plume that rose 2.5 km above the crater rim and drifted as far as 40 NE, E, and SE. As a result, significant ashfall was reported in the districts of Ubinas (6.5 km SSE) and Matalaque (17 km SSE). The Alert Level remained at Orange (the third level on a four-color scale) and the public was warned to stay 4 km away from the crater.
Sources: Instituto Geofísico del Perú (IGP); Buenos Aires Volcanic Ash Advisory Center (VAAC)
Instituto Geofísico del Perú (IGP) and Instituto Geológico Minero y Metalúrgico (INGEMMET) reported that the eruption at Ubinas continued during 19-25 July. According to IGP there were 46 volcano-tectonic earthquakes indicating rock fracturing and 122 long-period earthquakes signifying the movement of gas and magma recorded by the seismic network during 17-23 July. In addition, there were seven seismic signals associated with major explosive events, and 9-14 hours of seismic signals related to ash emissions.
Both IGP and INGEMMET reported a few notable explosions and ash plumes during the week. At 0530 on 20 July an explosion produced an ash plume that rose 3-4.5 km above the crater rim and drifted W and SW. Another explosion the next day, at 0922 on 21 July, produced an ash-and-gas plume that rose 5 km above the crater rim. Ashfall was reported in Querapi (4.5 km SE), Ubinas (6.5 km SSE), Tonohaya (7 km SSE), Anascapa (11 km SE), Sacohaya, San Miguel (10 km SE), Escacha, Huatagua (14 km SE), Huarina, Escacha (9 km SE), Matalaque (17 km SSE), Logén, Santa Lucía de Salinas, and Salinas de Moche. An explosion at 1323 on 22 July generated an ash plume that rose 5.5 km and drifted NE, E, and SE. The Alert Level remained at Orange (the third level on a four-color scale) and the public was warned to stay 4 km away from the crater.
Sources: Instituto Geofísico del Perú (IGP); Instituto Geológico Minero y Metalúrgico (INGEMMET)
Instituto Geofísico del Perú (IGP) reported that the eruption at Ubinas continued at low-to-moderate levels during 10-16 July. During the week there were 80 volcano-tectonic earthquakes indicating rock fracturing and 93 long-period earthquakes signifying the movement of gas and magma. On 16 July there were two seismic signals associated with major explosive events, and 3.6 hours of seismic signals related to ash emissions. Emissions of gas and ash rose to 1.5 km above the summit and drifted as far as 15 km to the E, SE, and S. The Alert Level remained at Orange (the third level on a four-color scale) and the public was warned to stay 4 km away from the crater.
Source: Instituto Geofísico del Perú (IGP)
IGP and INGEMMET reported that the eruption at Ubinas continued during 5-12 July. According to IGP there were 67 volcano-tectonic earthquakes indicating rock fracturing and 47 long-period earthquakes signifying the movement of gas and magma recorded during 5-9 July. A period of continuous ash-and-gas emissions was visible on 5 July with the plumes drifting more than 10 km SE and E. The Washington VAAC reported that ash plumes and periodic puffs of ash rose 5.5-9.1 km (18,000-30,000 ft) a.s.l. and drifted N and NE. On 6 July explosions recorded at 0747 and 2330 produced ash-and-gas plumes that rose as high as 3.5 km above the crater rim and drifted within 30 km NW, NE, SE, and S. According to the VAAC the explosion at 0747 produced a plume of ash and gas that rose to 9.1 km a.s.l., drifted SW, and gradually dissipated, while a lower-altitude plume at 7.6 km (25,000 ft) a.s.l. drifted NE. Gobierno Regional de Moquegua declared a state of emergency for districts in the Moquegua region, along with Coalaque Chojata, Icuña, Lloque, Matalaque (17 km SE), Ubinas, and Yunga of the General Sánchez Cerro province, to be in effect for 60 days.
On 7 July the VAAC reported that at 0320 an ash plume rose to 7.3 km (24,000 ft) a.s.l. and drifted E. At 0900 and 1520 steam plumes with diffuse ash rose to 6.7 km (22,000 ft) a.s.l. and drifted SE. Diffuse gas emissions were visible in satellite images drifting SE at 2120. Very small ash puffs visible in satellite and webcam images at 0920 and 1520 on 8 July rose as high as 6.4 km (21,000 ft) a.s.l. and drifted SE. INGEMMET reported that during 9-11 July sulfur dioxide emissions were low at 300 tons per day. Gas-and-steam plumes rose 150-400 m and drifted S. The Alert Level remained at Orange (the third level on a four-color scale) and the public was warned to stay 4 km away from the crater.
Sources: Instituto Geofísico del Perú (IGP); Instituto Geológico Minero y Metalúrgico (INGEMMET); Gobierno Regional de Moquegua; Washington Volcanic Ash Advisory Center (VAAC)
IGP and INGEMMET reported that the eruption at Ubinas continued during 26 June-4 July. A thermal anomaly in the crater was detected for the first time on 26 June and continued to be periodically detected through 4 July. According to IGP there were 98 Volcano-tectonic (VT) earthquakes indicating rock fracturing and 52 long-period (LP) earthquakes signifying the movement of gas and magma recorded during 26-28 June. Earthquakes indicting emissions decreased. Ash-and-gas emissions were visible in webcam images rising as high as 1 km above the crater rim and drifting NW, W, and SW. Seismic activity significantly increased during 29-30 June with 173 VT earthquakes, 351 LP events, and harmonic tremor, which signified rising magma. Ash-and-gas plumes rose 800 m and drifted SW, NW, NE, and E. Sulfur dioxide emissions were 600-1,150 tons per day (t/d). The Gobierno Regional de Moquegua raised the Alert Level to Orange (the third level on a four-color scale) on 30 June based on the recommendation from IGP and INGEMMET.
IGP noted that ash emissions were continuously observed in satellite and webcam images during 30 June-1 July and drifted more than 10 km S and SE. During 1-2 July there were 72 VT events and 114 LP events; seismic signals indicating emissions decreased on 2 July. Ash-and-gas plumes rose as high as 1.7 km above the crater rim and drifted SE, S, SW, and NW. Ashfall was reported in Ubinas (6.5 km SSE) and Ouerapi (4.5 km SE). During 2-3 July INGEMMET noted that ash-and-gas plumes rose 400 m and drifted SW, causing ashfall in areas within 5 km downwind. Sulfur dioxide emissions were 700 t/d.
Activity significantly increased on 4 July. IGP counted 16 seismic signals associated with explosive activity. According to INGEMMET an explosion ejected ballistics and produced an ash-and-steam plume that rose 5.5 km and drifted SW and S. Ashfall was recorded in Querapi, Ubinas, Sacohaya (7 km SSE), Anascapa (11 km SE), San Miguel (10 km SE), Tonohaya (7 km SSE), Huatahua, Huarina, Escacha (9 km SE), and Matalaque (17 km SSE), and was most significant within 5 km of the volcano. IGP noted that ash fell within a radius of 20 km and deposits were 1 mm thick in towns in the district of Ubinas.
Sources: Instituto Geológico Minero y Metalúrgico (INGEMMET); Instituto Geofísico del Perú (IGP); Gobierno Regional de Moquegua
Instituto Geofísico del Perú (IGP) reported that a new eruption began at Ubinas on 22 June after three days of increased seismicity. The seismic network recorded a total of 315 volcano-tectonic earthquakes with a maximum magnitude of 1.8 and 281 long-period earthquakes. The eruption began at 0011 on 22 June with a minor ash plume rising 1 km above the crater rim and drifted E based on seismicity and webcams.
During 23-25 June IGP reported a total of 402 volcano-tectonic earthquakes with a maximum magnitude of 1.9 and 865 long-period earthquakes. Sporadic diffuse ash emissions continued during this period that rose as high as 1.5 km above the crater rim. On 23 June the Buenos Aires VAAC reported that diffuse ash plumes were visible in satellite images rising to 6.4 km (21,000 ft) a.s.l., or about 700 m above the summit, and drifting NE and NW. At 1500 they noted that continuous steam emissions occasionally accompanied by diffuse ash puffs were visible in webcam images. On 24 June small diffuse ash puffs were visible in webcam and satellite images rising 6.4-7 km (21,000-23,000 ft) a.s.l., or 700-1,300 m above the summit, and drifting NW. On 25 June continuous gas emissions with sporadic diffuse ash puffs were visible in webcam images, though the ash was too diffuse to be detected in satellite images. IGP noted that no notable deformation nor thermal anomalies were detected. The Alert Level remained at Yellow (the second level on a four-color scale).
Sources: Instituto Geofísico del Perú (IGP); Buenos Aires Volcanic Ash Advisory Center (VAAC)
Instituto Geofísico del Perú (IGP) reported that seismicity at Ubinas had been increasing since mid-May, and that during 1-18 June fumarolic plumes rose 500 m above the crater rim. The Gobierno Regional de Moquegua raised the Alert Level to Yellow (the second lowest level on a four-color scale) on 20 June based on the recommendation from IGP.
Sources: Instituto Geofísico del Perú (IGP); Gobierno Regional de Moquegua
Instituto Geofísico del Perú (IGP) reported that at 1713 on 28 March a moderate-volume lahar descended the Volcánmayo drainage on Ubinas’s SE flank. The town of Tonohaya (7 km SSE) is located along the drainage and the town of Ubinas is 2 km E of the drainage. The Alert Level remained at Yellow (the second lowest level on a four-color scale). [Correction: The Alert Level was at Green, the lowest level.]
Source: Instituto Geofísico del Perú (IGP)
Instituto Geofísico del Perú (IGP) reported that during 29 March-4 April there were 11 volcano-tectonic earthquakes at Ubinas with magnitudes less than 1.8, and a few seismic signals indicated emissions. Sporadic steam-and-gas plumes rose as high as 200 m above the crater rim. On 5 April the Alert Level was lowered to Green (the lowest level on a four-color scale).
Source: Instituto Geofísico del Perú (IGP)
Instituto Geofísico del Perú (IGP) reported that at 1659 on 31 December and at 1746 on 1 January low-volume lahars descended the Volcánmayo drainage on Ubinas’s SE flank and damaged parts of the highway linking Arequipa, Querapi, Ubinas, and Huarina. The Alert Level remained at Yellow (the second lowest level on a four-color scale).
Source: Instituto Geofísico del Perú (IGP)
During 11-18 May the number of seismic events at Ubinas totaled 54 with volcano-tectonic (VT) signals being the most numerous. Sporadic emissions of gas and steam were recorded by the webcam rising to heights less than 300 m above the summit. The Alert Level remained at Orange (the second highest level on a four-color scale) and the public were warned to stay outside of a 10-km radius.
Source: Instituto Geofísico del Perú (IGP)
During 16-22 September the number of seismic events totaled 4,356, with volcano-tectonic (VT) signals being the most numerous, averaging 567 events per day, and all having magnitudes under M 2.5. Hybrid events averaged 119 events per day. Continuous emissions of blueish gas and water vapor were recorded by the webcam rising to heights less than 1 km above the summit. Four thermal anomalies were recorded by the MIROVA system. The Alert Level remained at Orange (the second highest level on a four-color scale) and the public were warned to stay outside of a 10-km radius.
Source: Instituto Geofísico del Perú (IGP)
During 10-15 September the number of seismic events at Ubinas totaled 4,093, with volcano-tectonic (VT) signals being the most numerous, averaging 572 events per day, and all having magnitudes under M 2.5. Hybrid events averaged 299 events per day. Continuous emissions of blueish gas and water vapor were recorded by the webcam rising to heights less than 1.5 km above the summit. Two thermal anomalies were recorded by the MIROVA system. An explosion at 0725 on 12 September produced a gas-and-ash plume that rose 1.5 km and affected several districts S and SE in the Moquegua region. The Alert Level remained at Orange (the second highest level on a four-color scale) and the public were warned to stay outside of a 10-km radius.
Source: Instituto Geofísico del Perú (IGP)
IGP reported that during 3-9 September three volcanic explosions were detected at Ubinas, all producing eruption plumes that rose to heights less than 2.5 km above the crater rim. The largest, and first, was recorded at 1358 on 3 September and produced significant amounts of ash and gas, affecting areas to the S and SE. After the explosions gas-and-steam plumes rose as high as 1 km. The Alert Level remained at Orange (the second highest level on a four-color scale) and the public were warned to stay outside of a 10-km radius.
Source: Instituto Geofísico del Perú (IGP)
IGP reported that during 27 August-2 September gas-and-water-vapor plumes from Ubinas rose to heights less than 1 km above the summit, and three thermal anomalies were recorded by the MIROVA system. The number of seismic events was 2,828 (all under M 2.3), with volcano-tectonic (VT) signals being the most numerous. There was a slight increase in the number of long-period, hybrid, and VT events compared to the previous week. Beginning at 2145 on 1 September a period of continuous ash emissions was recorded by the webcam. An explosion at 1358 on 3 September generated an ash plume that rose 1.3 km above the summit and drifted more than 10 km S and SE. Prior to this event, the last explosion as recorded on 22 July. The Alert Level remained at Orange (the second highest level on a four-color scale) and the public were warned to stay outside of a 15-km radius.
Source: Instituto Geofísico del Perú (IGP)
IGP reported that during 20-26 August blue-colored gas plumes from Ubinas rose above the crater and eight thermal anomalies were recorded by the MIROVA system. The number of seismic events was 1,736 (all under M 2.4), and there was an increase in the magnitude and number of hybrid and long-period events. Around 1030 on 26 August an ash emission rose to heights below 2 km above the crater rim. Continuous ash emissions on 27 August were recorded by satellite and webcam images drifting S and SW. The Alert Level remained at Orange (the second highest level on a four-color scale) and the public were warned to stay outside of a 15-km radius.
Source: Instituto Geofísico del Perú (IGP)
IGP reported that during 13-19 August blue-colored gas plumes from Ubinas rose to heights of less than 1.5 km above the base of the crater. Seven thermal anomalies were recorded by the MIROVA system. The number of seismic events was 1,716 (all under M 2.4), a decrease in the total number recorded during the previous week. The Alert Level remained at Orange (the second highest level on a four-color scale) and the public were warned to stay outside of a 15-km radius.
Source: Instituto Geofísico del Perú (IGP)
IGP reported that activity at Ubinas continued to be elevated after the 19 July explosions. A total of 1,522 earthquakes, all with magnitudes under 2.2, were recorded during 20-24 July. Explosions were detected at 0718 and 2325 on 22 July. The Buenos Aires VAAC reported that an ash plume rising to 9.4 km (31,000 ft) a.s.l. and drifting SE was identified in satellite data at 0040 on 22 July. Continuous steam-and-gas emissions with sporadic pulses of ash were visible in webcam views during the rest of the day. Ash emissions near the summit crater were periodically visible on 24 July though often partially hidden by weather clouds. Ash plumes were visible in satellite images rising to 7 km (23,000 ft) a.s.l. Diffuse ash emissions near the crater were visible on 25 July, though a thermal anomaly was identified in satellite images. During 26-28 July there were 503 people evacuated from areas affected by ashfall.
Sources: Instituto Geofísico del Perú (IGP); Buenos Aires Volcanic Ash Advisory Center (VAAC); Gobierno Regional de Moquegua
IGP reported that during 17-19 July gas-and-ash emissions occasionally rose from Ubinas’s summit crater and drifted N, E, and SE. Beginning at 0227 on 19 July as many as three explosions (two were recorded at 0227 and 0235) generated ash plumes that rose to 5.8 km above the crater rim. The Buenos Aires VAAC reported that ash plumes rose as high as 6.5 km above the crater rim (or to 40,000 ft. a.s.l.) based on satellite images. The Alert Level was raised to Orange (on a 4-level scale). Ash plumes drifted as far as 250 km E and SE, reaching Bolivia. Ashfall was reported in areas downwind including the towns of Ubinas (6.5 km SSE), Escacha, Anascapa (11 km SE), Tonohaya (7 km SSE), Sacohaya, San Miguel (10 km SE), Huarina, and Matalaque, causing some families to evacuate. The VAAC reported that during 20-23 July ash plumes rose to 7.3-9.5 km (24,000-31,000 ft) a.s.l. and drifted E, ESE, and SE.
Sources: Instituto Geofísico del Perú (IGP); Gobierno Regional de Moquegua; Buenos Aires Volcanic Ash Advisory Center (VAAC); Instituto Nacional de Defensa Civil Perú (INDECI)
Instituto Geofísico del Perú (IGP) reported that seismic activity at Ubinas remained elevated during 1-15 July; volcano-tectonic events averaged 279 per day and long-period events (indicating fluid movement) averaged 116 events per day. Minor bluish emissions rose from the crater. The Alert Level remained at Yellow (on a 4-level scale).
Sources: Instituto Geofísico del Perú (IGP); Instituto Geológico Minero y Metalúrgico (INGEMMET)
Instituto Geofísico del Perú (IGP) and INGEMMET reported that seismic activity at Ubinas remained elevated during 24-30 June; volcano-tectonic events averaged 200 per day and signals indicating fluid movement averaged 38 events per day. Emissions of gas, water vapor, and ash rose from the crater and drifted N and NE based on webcam views and corroborated with satellite data. According to a news article an eruption plume rose 400 m above the crater rim and drifted 10 km NE. The Alert Level was raised to Yellow (on a 4-level scale) on 27 June.
Sources: Instituto Geológico Minero y Metalúrgico (INGEMMET); Instituto Geofísico del Perú (IGP); Gobierno Regional de Moquegua
Instituto Geofísico del Perú (IGP) reported that seismic activity at Ubinas increased suddenly on 18 June with signals indicating rock fracturing. During 21-24 June signals indicating fluid movement emerged and, beginning at 0700 on 24 June, webcams recorded ash, gas, and steam plumes rising from the crater. The plumes were visible in satellite images rising to 6.1 km (20,000 ft) a.s.l. and drifting N, NE, and E. IGP recommended that the authorities raise the Alert Level to Yellow (on a 4 level scale).
Source: Instituto Geofísico del Perú (IGP)
The Comité Científico de Monitoreo Permanente del volcán Ubinas, made up of scientists from IGP's Observatorio Vulcanológico del Sur (OVS) and INGEMMET's Observatorio Vulcanológico (OVI), reported that at 1829 on 17 November an explosion at Ubinas generated an ash plume that rose 500 m above the crater rim and drifted W.
Sources: Observatorio Vulcanológico del INGEMMET (OVI); Instituto Geofísico del Perú (IGP)
The Comité Científico de Monitoreo Permanente del volcán Ubinas, made up of scientists from IGP's Observatorio Vulcanológico del Sur (OVS) and INGEMMET's Observatorio Vulcanológico (OVI), reported that on 8 November three explosions at Ubinas (at 2126, 2127, and 2149) generated an ash plume that rose 1.5 km above the crater rim and drifted E.
Source: Instituto Geofísico del Perú (IGP)
According to IGP's Observatorio Vulcanológico del Sur (OVS) seismicity at Ubinas increased during 9-14 September, characterized by an increased number of volcano-tectonic and hybrid events. Volcano-tectonic vents also became more intense. A small thermal anomaly was detected on 20 September. According to a news article, an "exhalation" occurred at 1921 on 2 October, and was followed by explosions detected at 2250 that same day, and 0424 and 0552 on 3 October. The largest explosion, at 2250 on 2 October, emitted a dense ash plume that rose 1.7 km and drifted 10 km NE and NW, causing ashfall in Santa Rosa de Phara and Yanapuqui.
Sources: Instituto Geofísico del Perú (IGP); Peru 21; Correo
Instituto Geofísico del Perú (IGP) Observatorio Volcanológico del Sur (OVS) reported that during 12-18 January the seismic network at Ubinas recorded an increase in the number and magnitude of long-period earthquakes and a decrease in volcano-tectonic events. Thermal anomalies were detected on 13 and 15 January. At 0640 on 15 January a plume rose 500 m above the crater's base. At 1253 an explosion generated an ash plume that rose 3 km above the crater's base and drifted S and SW. The report noted that this was the first explosive event since 5 November 2015.
Source: Instituto Geofísico del Perú (IGP)
Instituto Geofísico del Perú (IGP) Observatorio Volcanológico del Sur (OVS) reported that during 10-16 November sporadic ash-and-gas emissions from Ubinas were observed during rare breaks in the cloud cover. On 13 November an ash plume rose 1.5 km above the crater floor and drifted S and SW. The next day ash plumes rose 600 m. Thermal anomalies were detected on 17 November. Long-period and hybrid earthquakes were less frequent than the previous week; volcano-tectonic signals increased although the energy levels remained low.
Source: Instituto Geofísico del Perú (IGP)
Instituto Geofísico del Perú (IGP) Observatorio Volcanológico del Sur (OVS) reported that during 3-9 November ash-and-gas emissions rose above Ubinas. A moderate explosion detected at 1216 on 5 November generated an ash plume that rose 2.2 km. Thermal anomalies were detected on 3, 5, and 8 November.
Source: Instituto Geofísico del Perú (IGP)
Instituto Geofísico del Perú (IGP) Observatorio Volcanológico del Sur (OVS) reported that during 27 October-2 November seismicity at Ubinas fluctuated; the level of long-period earthquakes remained high and continued to increase, while hybrid and volcano-tectonic signals also increased but remained at low levels. Steam-and-gas plumes with some ash rose from the crater. Thermal anomalies were detected on 30 October and 1 November.
Source: Instituto Geofísico del Perú (IGP)
Instituto Geofísico del Perú (IGP) Observatorio Volcanológico del Sur (OVS) reported that during 20-26 October seismicity at Ubinas decreased overall; the level of long-period earthquakes remained high while hybrid and volcano-tectonic signals were at low levels. On 21 October an ash plume rose 1 km and drifted NE and E. Bluish gas-and-steam plumes rose from the crater during the rest of the period.
Source: Instituto Geofísico del Perú (IGP)
Instituto Geofísico del Perú (IGP) Observatorio Volcanológico del Sur (OVS) reported that during 13-19 October seismicity at Ubinas fluctuated; moderate levels of seismicity were detected near the beginning of the period but then declined during the second half of the week. Thermal anomalies were detected during 13-14 October. Five explosions generated ash plumes that rose 2 km above the crater on 15 October.
Source: Instituto Geofísico del Perú (IGP)
Instituto Geofísico del Perú (IGP) Observatorio Volcanológico del Sur (OVS) reported that long-period and volcano-tectonic events were at low levels at Ubinas during 15-21 September. Sporadic steam-and-gas plumes rose 600 m. Seismicity (hybrid and long-period events) increased during 20-21 September. An explosion on 21 September at 0914 produced ash plumes that rose 1.7 km and drifted S; ash emission continued until about 0800 the next day. Ashfall was reported in Querapi (4.5 km SE), Ubinas (6.5 km SSE), Tonohaya (7 km SSE), Anascapa (11 km SE), Sacohaya, and San Miguel (10 km SE).
Source: Instituto Geofísico del Perú (IGP)
Instituto Geofísico del Perú (IGP) Observatorio Volcanológico del Sur (OVS) reported increased seismicity at Ubinas during 1-7 September, specifically an increase in the occurrence of long-period events and hybrid signals. Tremor increased during 5-7 September. A steam plume rose 1.5 km above the base of the crater on 2 September, and ash emissions were recorded during 6-7 September.
Source: Instituto Geofísico del Perú (IGP)
Instituto Geofísico del Perú (IGP) Observatorio Volcanológico del Sur (OVS) reported increased seismicity at Ubinas during 12-18 August, specifically an increase in the frequency of volcano-tectonic and hybrid signals. At 1016 on 15 August an ash-and-steam plume rose 1.6 km above the crater base. White and blue gas emissions rose from the crater on other days.
Source: Instituto Geofísico del Perú (IGP)
Instituto Geofísico del Perú (IGP) Observatorio Volcanológico del Sur (OVS) reported that during 21-26 July seismic activity at Ubinas increased, particularly during 25-26 July. Constant gas, steam, and ash emissions were observed during 21-24 July. On 25 July bluish gas emissions were observed most of the day until a strong explosion (the strongest so far in 2015) at 1903 ejected ash, lapilli, and ballistics. Lapilli and some 1-2-cm-long fragments fell in the towns of Ubinas (6.5 km SSE) and Escacha. Another explosion was registered at 2003.
Source: Instituto Geofísico del Perú (IGP)
Instituto Geofísico del Perú (IGP) Observatorio Volcanológico del Sur (OVS) reported that during 7-13 July seismic activity declined. Volcano-tectonic earthquakes continued to decrease and the rate of long-period events slightly increased as compared to the previous week. The number of hybrid events decreased, and tremor associated with emissions was greatly reduced. Explosions were observed on 9 and 11 July, producing ash plumes that drifted NE, E, and S. Ash emissions were observed on other days as well.
Source: Instituto Geofísico del Perú (IGP)
Instituto Geofísico del Perú (IGP) Observatorio Volcanológico del Sur (OVS) reported that during 30 June-6 July volcano-tectonic earthquakes decreased and the rate of long-period events remained steady as compared to the previous week. The number of hybrid events slightly increased. Explosions were observed, and ash emissions rose as high as 1.6 km above the crater base and drifted NE, E, and SE.
Source: Instituto Geofísico del Perú (IGP)
Instituto Geofísico del Perú (IGP) Observatorio Volcanológico del Sur (OVS) reported that during 23-29 June seismic tremor at Ubinas, often associated with emissions, slightly increased compared to the previous week. Ash-and-gas plumes rose as high as 3 km above the crater base, drifting in multiple directions, and four explosions were detected during 24-27 June.
Source: Instituto Geofísico del Perú (IGP)
Instituto Geofísico del Perú (IGP) Observatorio Volcanológico del Sur (OVS) reported that during 17-22 June the occurrence of long-period earthquakes slightly increased to an average of 110 events/day from 62 events/day the previous week. Volcano-tectonic events continued to occur at a high rate. Harmonic tremor and hybrid events were also detected. Ash-and-gas emissions rose as high as 2 km above the crater base and drifted in multiple directions; 12 emissions were counted, eight of them on 22 June.
Source: Instituto Geofísico del Perú (IGP)
Instituto Geofísico del Perú (IGP) Observatorio Volcanológico del Sur (OVS) reported that during 9-16 June the number of long-period earthquakes greatly decreased to 62 events/day from 778 events/day the previous week. Volcano-tectonic events continued to occur at a high rate. Periods of constant ash emissions during 9-11 June rose as high as 1.4 km above the crater base and drifted mainly NE, E, and SE. Sporadic pulses of gas and ash on 12 June rose 800 m. A hybrid event was recorded at 1915 on 13 June; six hours later a thermal anomaly was detected by satellite images. Another thermal anomaly was detected on 16 June.
Source: Instituto Geofísico del Perú (IGP)
Instituto Geofísico del Perú (IGP) Observatorio Volcanológico del Sur (OVS) reported that during 2-8 June long-period earthquakes continued at a high rate, in occurrence and magnitude. A large number of observed ash emissions were related to periods of tremor and swarms of long-period earthquakes. Ash emissions rose 1.2 km above the crater base and drifted in multiple directions.
Source: Instituto Geofísico del Perú (IGP)
Instituto Geofísico del Perú (IGP) Observatorio Volcanológico del Sur (OVS) reported that during 19-26 May long-period earthquakes continued at the same rate while volcano-tectonic and hybrid events increased. Overall the dominant signal was spasmodic tremor associated with ash-and-steam emissions. While conducting fieldwork during 19-22 May, OVS staff observed persistent water vapor, gas, and ash emissions that rose 400 m. At 1051 and 1213 on 24 May ash plumes rose as high as 1.2 km and drifted NE and E.
Source: Instituto Geofísico del Perú (IGP)
Instituto Geofísico del Perú (IGP) Observatorio Volcanológico del Sur (OVS) reported that during 29 April-5 May long-period and tornillo-type earthquakes continued to decrease while volcano-tectonic events increased. Hybrid events were at a low level, however, an increase in the number of events were detected on 29 April. Overall the dominant signal was spasmodic tremor associated with ash-and-steam emissions. Constant steam emissions were visually observed even though cloud cover often prevented observations. Ash emission increased on 1 May, rising as high as 800 m above the crater.
Source: Instituto Geofísico del Perú (IGP)
According to Observatorio Volcanológico del Sur (OVS) and Observatorio Vulcanológico del INGEMMET (OVI), six explosions from Ubinas were recorded during 15-17 April, producing ash plumes that drifted 15 km SW, S, and SE. The largest ash plume, generated from an explosion detected at 0759 on 15 April, rose 3.5 km. The other explosions (at 1408 on 15 April, at 0600 on 16 April, and at 0743, 0936, and 1518 on 17 April) generated ash plumes that rose 1.5-1.8 km. Seismicity consisting of tornillos, hybrid events, and long-period events decreased from the previous week; the dominant signal was tremor characteristic of emissions and hydrothermal activity.
Sources: Instituto Geofísico del Perú (IGP); Instituto Geológico Minero y Metalúrgico (INGEMMET)
INGEMMET's Observatorio Vulcanológico (OVI) reported that after a decline in activity at Ubinas during the previous five months two phreatic explosions were detected on 8 April. The explosions occurred at 0424 and 0550, generated ash-and-gas plumes that rose 2-2.5 km above the crater and drifted SE. According to Observatorio Volcanológico del Sur (OVS) snowmelt during 12-13 April led to large lahars that descended the S flank. A report on 13 April noted that large volumes of ash continued to be emitted during the previous 48 hours.
Sources: Instituto Geofísico del Perú (IGP); Instituto Geológico Minero y Metalúrgico (INGEMMET)
Instituto Geofísico del Perú (IGP) Observatorio Volcanológico del Sur (OVS) reported that during 10 February-17 March seismicity at Ubinas was generally low, although a hybrid event was detected on 11 March. Two main sources of seismicity were located 1 km W of the crater at depths of 1-3 km and 2 km NW at depths of 1-5 km. Water-vapor emissions rose as high as 1.5 km above the crater. Sporadic ash emissions were observed on 17 March.
Source: Instituto Geofísico del Perú (IGP)
According to IGP a small 64-second-long explosion at Ubinas, that started at 0741 on 23 November, produced an ash plume that rose 2.5 km above the crater's base and drifted S and SE. A second explosion occurred at 1004 and generated an ash plume that rose 2.2 km and drifted S. Residents of Ubinas felt a slight rumble at the time of the second explosion.
Source: Instituto Geofísico del Perú (IGP)
IGP and INGEMMET reported that the Alert Level for Ubinas was lowered to Yellow on 10 October; seismicity, the number of explosions, and sulfur dioxide output had all declined. The report noted that sporadic ash emissions as well as explosions were expected to continue.
Sources: Instituto Geofísico del Perú (IGP); Instituto Geológico Minero y Metalúrgico (INGEMMET)
During 10-16 September IGP reported that the eruption of Ubinas was continuing and maintained Alert Level Orange. On 10 September there were 15 explosions with plumes 900-1,700 m above the crater and 10 exhalation events; on 11 September there was one explosion with a plume 3,000 m above the crater and 8 exhalation events (600-900 m above the crater). There were no explosions or exhalations during 12-16 September, although seismicity (LP, VT, and hybrid earthquakes) continued except on 13 September when hybrid earthquakes were absent.
Source: Instituto Geofísico del Perú (IGP)
During 3-9 September IGP reported that the eruption of Ubinas was continuing. During 3-4 and 9 September, steam plumes from fumaroles occasionally rose from the summit. Seismicity was generally low but dominated by tremor. Two exhalations of ash were observed on 5 September, the first at 0858 generated an ash plume up to 1,000 m above the summit which dispersed S. The second plume occurred at 1327 and dispersed ash 500 m above the summit that dispersed N.
A total of five explosions were detected on 8 September, the strongest occurred at 0850 and produced a 1,200 m plume; the second explosion expelled ash to heights between 1,300 and 1,900 m; ashfall was noted in areas S.
The Buenos Aires VAAC reported Aviation Color Code Orange on 8 and 9 September when visible images revealed a narrow plume of steam and ash drifting SE. By 0400 on 9 September, the emissions contained water vapor, gas, and light ash, and reached an altitude of 7,300 m (24,000 ft) a.s.l..
Sources: Buenos Aires Volcanic Ash Advisory Center (VAAC); Instituto Geofísico del Perú (IGP)
During 27 August-2 September INGEMMET reported that the eruption of Ubinas was continuing. During 27-31 August gas and ash plumes rose 200-1100 m above the crater and drifted E, NE, SE, and S. On 27 August INGEMMET reported increased volcanic tremor which continued until 30 August when the volcanic tremor decreased. On 28 August the Buenos Aires VAAC listed the Aviation Color Code at Red, noting intermittent light ash and possible ongoing emissions.
Sources: Instituto Geológico Minero y Metalúrgico (INGEMMET); Buenos Aires Volcanic Ash Advisory Center (VAAC)
During 20-26 August INGEMMET reported that the eruption of Ubinas was continuing. During 20-25 August water vapor, gas, and minor ash plumes rose 200-1800 m above the crater and drifted E, NE, and S. On 21 August an explosion was followed by an ash plume that rose 4.2 km (13,800 ft) above the summit and drifted S and expelled incandescent blocks up to 2 km from the crater, primarily on the S flank. The explosion was heard up to 10 km from the volcano. On 22 August an ash plume rose to 1.8 km (5,900 ft) and drifted E and NE. On 21-22 August ashfall was reported in the towns of Querapi, Ubinas, Escacha, Tonohaya, and Yalahua.
Sources: Instituto Geofísico del Perú (IGP); Instituto Geológico Minero y Metalúrgico (INGEMMET); Buenos Aires Volcanic Ash Advisory Center (VAAC)
During 13-17 August INGEMMET reported that seismicity has decreased and the eruption of Ubinas continued. Mild steam-and-gas emissions rose 200-400 m above the summit and drifted SE and NE.
Source: Instituto Geológico Minero y Metalúrgico (INGEMMET)
During 6-9 August INGEMMET reported that the eruption of Ubinas was continuing. On 6-7 August gas-and-minor ash emissions rose 300-1200 m above the crater and drifted NE and S. On 6 August ash was reported in the village of Para (NE). On 8-9 August, white emissions of primarily water vapor rose 100-300 m above the crater and drifted S and SE. On 6 August Buenos Aires VAAC reported intermittent light volcanic ash and emission puffs to 6.7 km (22,000 ft)a.s.l. and continuous emissions of gases and light ash on 7 August.
Sources: Instituto Geológico Minero y Metalúrgico (INGEMMET); Buenos Aires Volcanic Ash Advisory Center (VAAC)
On 31 July and 3-5 August the Buenos Aires VAAC reported continuous emission of light ash from Ubinas. On 30 July INGEMMET reportedsteam-and-gas plumes that rose 500-1100 m above the summit. On 31 July INGEMMET reported an eruption column rose to 3 km (9,800 ft) a.s.l. and drifted NW. On 1 and 3 August gas-and-ash emission rose 200-1200 m above the crater and drifted W.
Sources: Buenos Aires Volcanic Ash Advisory Center (VAAC); Instituto Geológico Minero y Metalúrgico (INGEMMET)
On 23 July the Buenos Aires VAAC reported a weak emission of light ash. During 23-25 July INGEMMET and IGP reported that seismicity at Ubinas has decreased. On 23-24 July mild gas-and-ash emissions rose 200-550 m above the summit and drifted E and NE. On 25 July there were no explosions, but minor gas and ash emissions drifted E.
Sources: Instituto Geofísico del Perú (IGP); Instituto Geológico Minero y Metalúrgico (INGEMMET); Buenos Aires Volcanic Ash Advisory Center (VAAC)
During 16-22 July INGEMMET and IGP reported that the eruption of Ubinas was continuing with gas-and-ash emissions reported most days. An explosion on 17 July, preceded by several days of banded tremor, generated an eruption column that rose 5 km above the summit and expelled incandescent blocks onto the flanks. More explosions on 19 and 21 produced eruption columns of gas-and-ash; the column on 19 July rose 2.8 km above the summit. Emissions and exhalations on 16, 18, and 22 July of gas-and-ash rose to 200-1800 m above the summit. Eruption columns and emissions drifted mostly E, NE, and SE. There were no significant emissions on 20 July. Ashfall was reported in various towns downwind of the plumes, in the areas of Querapi (4 km S), Ubinas (6.5 km SSE), Tonohaya (7 km SSE), San Miguel (10 km SE), Escacha, Yalahua, Lloque, and Sacuhaya.
Sources: Instituto Geofísico del Perú (IGP); Instituto Geológico Minero y Metalúrgico (INGEMMET); Buenos Aires Volcanic Ash Advisory Center (VAAC)
IGP reported that the eruption of Ubinas was continuing during 12 June-10 July. During 12-30 June six explosions generated plumes 1,400-3,600 m above the crater. Volcanic tremor was associated with ash emissions during 12-21, 25, and 26 June. During 28-29 June more than 1,000 hybrid earthquakes were recorded, but volcano-tectonic earthquakes were scarce. A moderate explosion on 30 June generated an incandescent plume. After more than 50 hours of tremor, a moderate explosion occurred at 0858 on 30 June; the plume reached 1,800 m above the crater and ejected tephra 1,500 m down the NW flank.
During 30 June-10 July IGP detected five, small-sized explosions that generated plumes 400-1,500 m above the crater. Seismicity was also reduced during this period; the greatest number of hybrid earthquakes was registered on 6 July when a swarm of 115 earthquakes occurred.
Source: Instituto Geofísico del Perú (IGP)
The Buenos Aires VAAC reported that during 25-28 June there was continuous steam and possible ash emission from Ubinas. In a press release from 30 June, IGP noted minimal releases of ash and gas emissions had been observed during the previous days. Gas-and-ash plumes observed on 30 June rose 1.8 km above the crater. Minor ashfall was reported SE.
Sources: Instituto Geofísico del Perú (IGP); Buenos Aires Volcanic Ash Advisory Center (VAAC)
INGEMMET reported intermittent explosions from Ubinas along with continuing daily tremor and long-period earthquales during 18-23 June. Two explosions were noted on 18 June, as were six gas-and-ash emissions that generated diffuse plumes 400-700 m above the summit. Ashfall was reported in Querapi (located 4 km S). On 19 June the seismic network detected two explosions, and gas-and-ash emissions were observed nine times, reaching 300-1,200 m above the crater. Ashfall was reported in the areas of Querapi, Ubinas (6.5 km SSE), Escacha, Tonohaya (7 km SSE), and San Miguel (10 km SE).
No explosions were recorded on 20 June, but seven gas-and-ash emissions were observed (200-500 m above the crater) with the webcamera. On 21 June, six explosions were recorded, with gas-and-ash plumes seen nine times to heights of 500-1,200 m above the crater. Light ashfall was reported in the towns of Ubinas, Lloque, and Yunga. Seismicity on 22 June included one explosion signature. The webcamera captured views of eight gas-and-ash plumes that reached 300-1,000 m above the crater. No explosions were registered on 23 June, although six gas-and-ash plumes were observed with plume heights as high as 1,300 m above the crater.
Sources: Instituto Geofísico del Perú (IGP); Instituto Geológico Minero y Metalúrgico (INGEMMET)
In a 12 June press release, IGP's Observatorio Volcanologico de Arequipa (IGP-OVA) reported that activity at Ubinas had decreased since April, however periods of intense tremor mainly associated with ash emissions continued to be detected. Ashfall affected areas around the volcano, especially within 6 km E and SSW. An IGP update on 17 June noted a small explosion at 1335 that day that sent ash 1,800 m above the crater, to an altitude of about 7,400 m (24,500 ft) a.s.l.
Sources: Instituto Geofísico del Perú (IGP); Instituto Geológico Minero y Metalúrgico (INGEMMET)
In a press release from 5 June, IGP's Observatorio Volcanologico de Arequipa (IGP-OVA) and Observatorio Vulcanológico del INGEMMET (OVI) reported that an Alert Level Orange continued for residents affected by the Ubinas eruption. Residents of Querapi and Tonohaya remained evacuated. The report noted that a significant and continuous release of ash emissions and gasses were observed during the previous days. Gas-and-ash plumes observed during 5-7 June rose 0.2-2 km above the crater. Minor ashfall was reported in Lloque and Yungas during 6-7 June.
Sources: Instituto Geofísico del Perú (IGP); Instituto Geológico Minero y Metalúrgico (INGEMMET)
Observatorio Vulcanológico del INGEMMET (OVI) reported that during 28-29 May ash emissions at Ubinas continued; gas-and-ash plumes rose 0.6-2.5 km above the crater and drifted ESE. Ashfall was reported in various towns downwind of the plumes, including Querapi (4 km S), Ubinas (6.5 km SSE), Escacha, Chojata, San Miguel, and Tonohaya. The Buenos Aires VAAC reported that seismicity fluctuated during 2-3 June. Satellite and webcam images as well as pilot observations indicated continuous emission of gas and ash that rose to altitudes of 6.7-10.7 km (22,000-35,000 ft) a.s.l. and drifted NE, E, and SE.
Sources: Instituto Geológico Minero y Metalúrgico (INGEMMET); Buenos Aires Volcanic Ash Advisory Center (VAAC)
Observatorio Vulcanológico del INGEMMET (OVI) reported that during 21-23 and 25-27 May ash emissions at Ubinas continued. On most days gas-and-ash plumes rose 0.7-3.8 km above the crater and drifted W, N, E, and SE. Ashfall was reported in various towns downwind of the plumes including Querapi (4 km S), Ubinas (6.5 km SSE), Escacha, Lloque, Chojata, San Miguel, and Tonohaya.
Source: Instituto Geológico Minero y Metalúrgico (INGEMMET)
IGP's Observatorio Volcanologico de Arequipa (IGP-OVA) and Observatorio Vulcanológico del INGEMMET (OVI) reported that during 14-16 May emissions at Ubinas continued. On 14 May emissions with minor amounts of ash rose 0.6-1.8 km above the crater. An explosion at 1902 on 14 May ejected fragments around the crater and caused thick ashfall in Chojata and Escacha. Water vapor and ash plumes rose 0.7-3.5 km on 15 May, and gas, steam, and ash plumes rose 500-800 m on 16 May. A moderate explosion at 1915 on 18 May was followed by nine hours of continuous emissions. Later that day gas-and-ash plumes rose 0.4-1.1 km. During 14-16 and 18 May ash fell in various towns downwind of the plumes, including Querapi (4 km S), Ubinas (6.5 km SSE), Escacha, Lloque, Chojata, and Tonohaya.
A news article from 15 May noted that the mayor of the district of San Juan de Tarucani in Arequipa continued the effort to relocate families.
Sources: Instituto Geofísico del Perú (IGP); Instituto Geológico Minero y Metalúrgico (INGEMMET)
IGP's Observatorio Volcanologico de Arequipa (IGP-OVA) and Observatorio Vulcanológico del INGEMMET (OVI) reported that during 7-12 May gas-and-ash plumes, sometimes with only minor amounts of ash, rose 0.6-3 km above the crater. Ash fell in various towns downwind of the plumes including Querapi (4 km S), Ubinas (6.5 km SSE), Escacha, Anascapa, San Miguel, and Tonohaya. Significant ashfall was reported in Santa Rosa de Phara on 8 May.
Sources: Instituto Geofísico del Perú (IGP); Instituto Geológico Minero y Metalúrgico (INGEMMET)
IGP's Observatorio Volcanologico de Arequipa (IGP-OVA) and Observatorio Vulcanológico del INGEMMET (OVI) reported that during 30 April-1 May seismic activity at Ubinas increased significantly, and then declined through 6 May. Explosions generated ash plumes that rose 0.2-3 km above the crater and drifted in multiple directions, especially to the S, SE, E, and NE. Ash fell in various towns downwind of the plumes including Querapi (4 km S), Ubinas (6.5 km SSE), Escacha, Anascapa, San Miguel, and Lloque. On 4 May minor amounts of ash fell throughout the Ubinas valley, more than 15 km away. Although sulfur dioxide emissions had been declining since the peak on 15 April (4,873 tons per day) they continued to be high at more than 1,000 tons per day; villages downwind reported strong sulfur odors.
Sources: Instituto Geofísico del Perú (IGP); Instituto Geológico Minero y Metalúrgico (INGEMMET)
IGP's Observatorio Volcanologico de Arequipa (IGP-OVA) and Observatorio Vulcanológico del INGEMMET (OVI) reported that during 23-28 April daily explosions at Ubinas generated ash plumes that rose 0.2-2.5 km above the crater and drifted in multiple directions, especially to the S, SE, and E. Ash fell in various towns downwind of the plumes including Querapi (4 km S), Ubinas (6.5 km SSE), Escacha, Yungas, and Chojata. Seismicity was at a low level; signals indicating magma ascent were absent.
Sources: Instituto Geofísico del Perú (IGP); Instituto Geológico Minero y Metalúrgico (INGEMMET)
IGP's Observatorio Volcanologico de Arequipa (IGP-OVA) and Observatorio Vulcanológico del INGEMMET (OVI) reported that 21 moderate explosions at Ubinas were detected during 11-16 April along with a sharp increase in seismicity; the magnitude and frequency of explosions increased during 14-16 April. Multiple explosions during 16-22 April ejected incandescent tephra, and generated plumes of gas, water vapor, and ash that rose at most 5 km above the crater. Ash fell in multiple areas in almost all directions, but was most concentrated to the S, SW, and W; towns affected included Querapi (4 km S), Ubinas (6.5 km SSE), Sacuaya, Huatagua (14 km SE), Escacha, Quinistaquillas, San Miguel (10 km SE), Tonohaya, and Matalaque. On 18 April at 1836 a significant gas-and-ash emission was accompanied by the ejection of incandescent blocks that landed up to 2 km from the crater. Explosions on 19 and 22 April ejected incandescent tephra, 20-30 cm in diameter, up to 2.5 km away from the crater. Fine ash fell in Omate, 37 km SSW. According to a news article, an evacuation of 4,000 residents was underway, along with nearly 30,000 livestock.
Sources: Instituto Geofísico del Perú (IGP); Instituto Geológico Minero y Metalúrgico (INGEMMET); Disaster News Network
IGP's Observatorio Volcanologico de Arequipa (IGP-OVA) and Observatorio Vulcanológico del INGEMMET (OVI) reported that during 9-14 April seismicity at Ubinas remained high. Gas-and-ash plumes rose 0.3-2.2 km above the crater and drifted mostly E, SE, and S. Ashfall was reported in Ubinas (6.5 km SSE), Huatagua (14 km SE), Anascapa (11 km SE), Tonohaya (7 km SSE), San Miguel (10 km SE), Sacuaya, Querapi (4 km S), San Juan de Tarucani, Escacha, Ichuña, Yungas, and Chojata. On 13 April a significant explosion occurred that possibly removed the body of recently erupted lava on the crater floor; incandescent tephra was ejected from the crater. On 14 April an explosion ejected incandescent tephra from the crater that was deposited on the W flank.
Sources: Instituto Geofísico del Perú (IGP); Instituto Geológico Minero y Metalúrgico (INGEMMET)
IGP's Observatorio Volcanologico de Arequipa (IGP-OVA) reported that during 29 March-2 April seismicity at Ubinas increased significantly. The increase began at 1000 on 29 March with energetic tremor (indicating magma ascent and degassing) and small explosions. On 2 April harmonic tremor was detected. Gas-and-ash plumes rose 0.9-2.2 km above the crater and drifted SE and E. Minor ashfall was reported in Tonohaya (7 km SSE), San Miguel, and Ubinas (6.5 km SSE). Based on webcam views, the Buenos Aires VAAC reported that on 3 April gas-and-steam plumes possibly containing ash rose 6.1-7.3 km (20,000-24,000 ft) a.s.l. and dissipated around the crater. IGP-OVA noted that on 4 April there were 23 explosions detected; ash plumes drifted S and SE. During 5-7 April explosions generated ash plumes that rose as high as 2 km and drifted S and SW. During 7-8 April explosions also ejected incandescent fragments, up to 20 cm in diameter, no more than 1 km away. Ash plumes rose as high as 3 km.
Sources: Instituto Geofísico del Perú (IGP); Buenos Aires Volcanic Ash Advisory Center (VAAC)
IGP's Observatorio Volcanologico de Arequipa (IGP-OVA) reported that volcanologists visiting Ubinas on 19 March observed that lava had continued erupt, covering the 120-m-wide crater floor. Seismic signals detected during 20-21 and 23 March indicating increased lava emissions. Gas-and-ash plumes rose as high as 1.3 km above the crater almost daily during 10-25 March; ashfall was reported on 25 March in nearby villages and noises from the volcano were audible in areas as far as 6 km SE.
INGEMMET reported that on 26 March gas-and-ash emissions rose 1.2-1.7 km and drifted NE, E, and SW. Small amounts of fine ash fell within 4 km of the crater. Ash emissions on 27 March caused ashfall in Ubinas (6.5 km SSE), Querapi (4 km S), and Tonohaya (7 km SSE). Rockslides traveled down the SE flank. On 28 March residents of Ubinas reported noises from the volcano. Seismicity increased the next day and was characterized by long-period earthquakes and harmonic tremor. On 30 March gas-and-steam plumes rose as high as 1.2 km. A news article stated that residents of Querapi had started to evacuate. A low-energy explosion occurred at 0743 on 31 March and produced an ash plume that rose 1.2 km. More low-energy explosions followed: at 1119, 1306, 1518, and 1616. The explosions produced ash plumes that rose 1-1.8 km. Ashfall was reported in Ubinas and Querapi.
Sources: Instituto Geológico Minero y Metalúrgico (INGEMMET); La República; Instituto Geofísico del Perú (IGP)
In a 23 March news article IGP volcanologists noted that the seismic network at Ubinas indicated a large output of lava during 10-11 March; sulfur dioxide emissions also increased during this period. Lava in the crater was incandescent. Based on analysis of satellite images and the INGEMMET web cam, the Buenos Aires VAAC reported that an emission of gas and steam on 23 March possibly contained diffuse ash. The plume drifted NE before dissipating about 55 km away. The next day another steam-and-gas emission possibly containing some ash drifted NE.
On 25 March Observatorio Vulcanológico del INGEMMET (OVI) reported that in the previous days bluish white gas plumes rose 1.3 km above the crater rim and sulfur dioxide emissions averaged 2,200 tons per day. The report also noted that lava had continued to erupt in recent weeks.
Sources: Instituto Geológico Minero y Metalúrgico (INGEMMET); Buenos Aires Volcanic Ash Advisory Center (VAAC); Grupo RPP
Based on analyses of satellite imagery, the Buenos Aires VAAC reported that diffuse plumes from Ubinas, possibly containing ash, drifted WNW on 13 March and SW on 15 March. Satellite images on 16 March showed a diffuse gas plume containing some ash drifting WSW.
Source: Buenos Aires Volcanic Ash Advisory Center (VAAC)
IGP reported that during 26 February-4 March activity at Ubinas was characterized as low to moderate; seismicity fluctuated but remained low. Volcanologists visited the crater during 1-2 March and observed a new elongated body of incandescent lava that was 30-40 m long and emitted bluish gas. The Buenos Aires VAAC reported that although a pilot reported an ash plume drifting NE at an altitude of 8.8 km (29,000 ft) a.s.l. on 7 March, there was no indication of ash in satellite images. On 10 March a narrow and diffuse plume possibly containing ash was detected in satellite images drifting SW. Clear images the next day showed no ash present.
Sources: Instituto Geofísico del Perú (IGP); Buenos Aires Volcanic Ash Advisory Center (VAAC)
IGP reported that a phreatic explosion from Ubinas occurred at 1445 on 14 February and generated a water vapor, gas, and ash plume that rose 1 km above the crater. Seismic activity had been increasing before the explosion, since 8 February.
Source: Instituto Geofísico del Perú (IGP)
IGP's Observatorio Volcanologico de Arequipa (IGP-OVA) reported that on 1 February at 1559 a gas-and-ash plume from Ubinas rose 0.5-2 km above the crater and drifted E and SE. A photo showed ash from the plume falling onto the flanks. The event was accompanied by increased seismicity for several hours. At 2027 on 7 February a large volcano-tectonic earthquake occurred under the volcano at a depth of 9 km. Bluish gas emissions were sporadic during 8-11 February.
Source: Instituto Geofísico del Perú (IGP)
IGP reported that two earthquake swarms at Ubinas were detected: the first during 8-9 January and the second on 25 January. An emission was observed on 23 January. Seismicity increased again during 30-31 January. The Buenos Aires VAAC reported that, although a pilot reported an ash plume on 2 February, there was no ash detected in satellite images. The next day a pilot observed steam emissions with small amounts of ash; satellite images confirmed the presence of ash.
Sources: Instituto Geofísico del Perú (IGP); Buenos Aires Volcanic Ash Advisory Center (VAAC)
IGP reported that a 2-minute-long non-explosive seismic signal indicated gas-and-ash emissions at Ubinas on 22 October.
Source: Instituto Geofísico del Perú (IGP)
According to a news source, IGP reported that a seventh phreatic explosion from Ubinas occurred just after 1800 on 4 September; six explosions were recorded between 1 and 3 September. The explosion caused alarmed residents of Querapi, 4 km S, to temporarily leave their homes and congregate in the town square.
Source: La República
IGP reported six phreatic explosions from Ubinas during 1-3 September. The series of explosions decreased in both energy and length of the tremor signal associated with each explosion; tremor lasted 75 minutes for the first explosion and 5-10 minutes for the last one. Most of the explosions generated ash plumes that rose 1.5-2 km above the crater.
The first explosion occurred at 2246 on 1 September, lasted 110 seconds, ejected ballistics up to 2 m in diameter, and caused ashfall 2 km ENE. The second explosion, at 1552 on 2 September, lasted 292 seconds and ejected fewer ballistics. Details for the 3rd through the 6th explosions are as follows: the 3rd occurred at 2350 on 2 September and lasted 279 seconds; the 4th occurred at 0809 on 3 September and lasted 296 seconds; the 5th occurred at 1021 on 3 September and lasted 288 seconds; the 6th occurred at 1029 on 3 September and lasted 74 seconds.
Source: Instituto Geofísico del Perú (IGP)
The Buenos Aires VAAC reported that, although a pilot reported an ash plume from Ubinas rising to an altitude of 5.5 km (18,000 ft) a.s.l. and drifting W on [11 July], there was no ash detected in clear satellite images.
Source: Buenos Aires Volcanic Ash Advisory Center (VAAC)
Based on a pilot observation and analyses of satellite imagery, the Buenos Aires VAAC reported that on 18 July an ash plume from Ubinas drifted NE. A subsequent report about 12 hours later stated that no further activity was seen.
Source: Buenos Aires Volcanic Ash Advisory Center (VAAC)
Based on a pilot observation, the Buenos Aires VAAC reported that an emission from Ubinas was seen on 23 August. Ash was not detected in satellite imagery.
Source: Buenos Aires Volcanic Ash Advisory Center (VAAC)
Based on a SIGMET notice, the Buenos Aires VAAC reported that an emission from Ubinas was seen on 15 August. Ash was not detected in satellite imagery.
Source: Buenos Aires Volcanic Ash Advisory Center (VAAC)
Based on a pilot observation, the Buenos Aires VAAC reported that on 4 July an ash plume from Ubinas rose to altitudes of 6.7-9.1 km (22,000-30,000 ft) a.s.l. and drifted NE. Ash was not detected on satellite imagery.
Source: Buenos Aires Volcanic Ash Advisory Center (VAAC)
Based on SIGMET notices and analysis of satellite imagery, the Buenos Aires VAAC reported that during 11 and 13-15 June eruptions from Ubinas produced ash plumes that rose to altitudes of 5.5-7.9 km (18,000-26,000 ft) a.s.l. Plumes drifted NE, E, and SE. Ash was not identified on satellite imagery on 13 June.
Source: Buenos Aires Volcanic Ash Advisory Center (VAAC)
Based on analysis of satellite imagery, the Buenos Aires VAAC reported that on 5 June plumes from Ubinas rose to altitudes of 6.1-6.7 km (20,000-22,000 ft) a.s.l. and drifted W and S. A pilot reported that an ash plume rose to an altitude of 7.9 km (26,000 ft) a.s.l. and drifted SW. On 6 and 9 June, plumes seen on satellite imagery rose to altitudes of 6.1-7.6 km (20,000-25,000 ft) a.s.l. and drifted S and NE, respectively.
Source: Buenos Aires Volcanic Ash Advisory Center (VAAC)
Based on SIGMET notices, the Buenos Aires VAAC reported that on 29 and 31 May eruptions from Ubinas produced ash plumes that rose to altitudes of 5.5-6.7 km (18,000-22,000 ft) a.s.l. and drifted NE and SW. Ash was not detected on satellite imagery on 31 May. INGEMMET reported on 1 June a bluish gas plume with some ash content. On 2 June, an explosion was detected and gas-and-ash plumes that rose 0.9-1.5 km drifted E.
Sources: Instituto Geológico Minero y Metalúrgico (INGEMMET); Buenos Aires Volcanic Ash Advisory Center (VAAC)
Based on SIGMET notices, the Buenos Aires VAAC reported that on 20 May an eruption of Ubinas produced an ash plume that rose to an altitude of 7.3 km (24,000 ft) a.s.l. and drifted NE. Ash was not detected on satellite imagery. According to a news article, two explosions were detected on 25 May. Gas emissions impacted local residents and their fields, prompting residents to request government assistance.
Sources: Buenos Aires Volcanic Ash Advisory Center (VAAC); Peru.com
Based on pilot observations, analysis of satellite imagery, and SIGMET notices, the Buenos Aires VAAC reported that during 15-19 May ash plumes from Ubinas rose to altitudes of 5.5-7.6 km (18,000-25,000 ft) a.s.l. and drifted SW, NW, and SSE.
Source: Buenos Aires Volcanic Ash Advisory Center (VAAC)
Based on pilot observations, the Buenos Aires VAAC reported that a plume from Ubinas rose to an altitude of 7.9 km (26,000 ft) a.s.l. on 18 March. Ash was not identified in satellite imagery.
Source: Buenos Aires Volcanic Ash Advisory Center (VAAC)
Based on a SIGMET notice and analysis of satellite imagery, the Buenos Aires VAAC reported that during 11-12 March ash plumes from Ubinas rose to altitudes of 5.5-7.3 km (18,000-24,000 ft) a.s.l. and drifted NE. A SIGMET notice described an ash plume that rose to altitudes of 9.1-9.8 km (30,000-32,000 ft) a.s.l. on 15 March; ash was not identified in satellite imagery.
Source: Buenos Aires Volcanic Ash Advisory Center (VAAC)
Based on a SIGMET notice and analysis of satellite imagery, the Buenos Aires VAAC reported that on 4 March an ash plume from Ubinas rose to an altitude of 5.8 km (19,000 ft) a.s.l. and drifted SW.
Source: Buenos Aires Volcanic Ash Advisory Center (VAAC)
Based on a SIGMET notice and a pilot observation, the Buenos Aires VAAC reported that on 23 February an ash plume from Ubinas rose to altitudes of 6.2-7.6 km (20,500-25,000 ft) a.s.l. and drifted S. Ash was not seen on satellite imagery.
Source: Buenos Aires Volcanic Ash Advisory Center (VAAC)
INGEMMET reported that although cloud cover occasionally prevented visual observations of Ubinas, steam and steam-and-ash plumes were seen during 11-16 February and rose to altitudes of 5.7-6.5 km (18,700-21,300 ft) a.s.l. The plumes drifted NE, N, W, and SW.
Source: Instituto Geológico Minero y Metalúrgico (INGEMMET)
Based on a SIGMET notice, the Buenos Aires VAAC reported that on 31 January an ash plume from Ubinas rose to an altitude of 6.7 km (22,000 ft) a.s.l. and drifted SW. Ash was not seen on satellite imagery.
Source: Buenos Aires Volcanic Ash Advisory Center (VAAC)
Based on a SIGMET notice, the Buenos Aires VAAC reported that on 11 January an ash plume from Ubinas rose to an altitude of 7.3 km (24,000 ft) a.s.l. and drifted NE.
Source: Buenos Aires Volcanic Ash Advisory Center (VAAC)
Based on a SIGMET notice, the Buenos Aires VAAC reported that on 5 January an ash plume from Ubinas rose to an altitude of 5.5 km (18,000 ft) a.s.l. and drifted SE.
Source: Buenos Aires Volcanic Ash Advisory Center (VAAC)
Based on a SIGMET notice, the Buenos Aires VAAC reported that on 30 November an ash plume from Ubinas rose to altitudes of 5.5-6.1 km (18,000-20,000 ft) a.s.l. and drifted SW.
Source: Buenos Aires Volcanic Ash Advisory Center (VAAC)
Based on SIGMET notices, the Buenos Aires VAAC reported that on 31 October ash plumes were continuously emitted from Ubinas and rose to altitudes of 5.5-6.7 km (18,000-22,000 ft) a.s.l. The plumes drifted E.
Source: Buenos Aires Volcanic Ash Advisory Center (VAAC)
Based on SIGMET notices, the Buenos Aires VAAC reported that on 22 October ash plumes were continuously emitted from Ubinas and rose to altitudes of 5.5-6.7 km (18,000-22,000 ft) a.s.l. The plumes drifted S.
Source: Buenos Aires Volcanic Ash Advisory Center (VAAC)
Based on SIGMET notices and pilot observations, the Buenos Aires VAAC reported that on 15, 18, 20, and 21 October ash plumes were continuously emitted from Ubinas and rose to altitudes of 4.9-7 km (16,000-23,000 ft) a.s.l. The plumes drifted SE and NW.
Source: Buenos Aires Volcanic Ash Advisory Center (VAAC)
Based on SIGMET notices, the Buenos Aires VAAC reported that during 11-13 October ash plumes were continuously emitted from Ubinas and rose to altitudes of 5.5-7 km (18,000-23,000 ft) a.s.l. The plumes drifted SE and W.
Source: Buenos Aires Volcanic Ash Advisory Center (VAAC)
Based on SIGMET reports, the Buenos Aires VAAC reported that on 1 and 3 October ash plumes were continuously emitted from Ubinas and rose to altitudes of 5.5-6.1 km (18,000-20,000 ft) a.s.l. The plumes drifted N and NE.
Source: Buenos Aires Volcanic Ash Advisory Center (VAAC)
Based on SIGMET reports, the Buenos Aires VAAC reported that on 30 September ash plumes from Ubinas rose to altitudes of 5.5-8.8 km (18,000-29,000 ft) a.s.l. and drifted SSE.
Source: Buenos Aires Volcanic Ash Advisory Center (VAAC)
Based on SIGMET reports, the Buenos Aires VAAC reported that on 17 September ash plumes from Ubinas rose to an altitude of 10.1 km (33,000 ft) a.s.l. and drifted NE. The next day, ash plumes rose to altitudes of 5.5-6.4 km (18,000-21,000 ft) a.s.l.
Source: Buenos Aires Volcanic Ash Advisory Center (VAAC)
Based on SIGMET reports, the Buenos Aires VAAC reported that during 10 and 13-15 September ash plumes from Ubinas rose to altitudes of 5.5-10.1 km (18,000-33,000 ft) a.s.l. and drifted SW, S, SE, E, and NE.
Source: Buenos Aires Volcanic Ash Advisory Center (VAAC)
Based on SIGMET reports and pilot observations, the Buenos Aires VAAC reported that during 5-6 September ash plumes from Ubinas rose to altitudes of 5.5-6.4 km (18,000-21,000 ft) a.s.l. and drifted NE and SE.
Source: Buenos Aires Volcanic Ash Advisory Center (VAAC)
Based on SIGMET reports, analysis of satellite imagery, and pilot observations, the Buenos Aires VAAC reported that during 26-27 August and on 2 September continuous ash plumes from Ubinas rose to altitudes of 5.5-6.1 km (18,000-20,000 ft) a.s.l. Plumes drifted N on 27 August and S on 2 September.
Source: Buenos Aires Volcanic Ash Advisory Center (VAAC)
Based on SIGMET reports and pilot observations, the Buenos Aires VAAC reported that on 18 August ash plumes from Ubinas rose to altitudes of 5.5-6.4 km (18,000-21,000 ft) a.s.l. and drifted W.
Source: Buenos Aires Volcanic Ash Advisory Center (VAAC)
Based on SIGMET reports, the Buenos Aires VAAC reported that ash plumes from Ubinas rose to altitudes of 5.5-5.8 km (18,000-19,000 ft) a.s.l. on 23 July and drifted SE.
Source: Buenos Aires Volcanic Ash Advisory Center (VAAC)
Ash advisories issued by the Buenos Aires VAAC, based on SIGMET notices, indicated ash plumes on 9, 10, and 15 July rising to 5.5-5.8 km (18-19,000 ft) a.s.l. and moving E.
Source: Buenos Aires Volcanic Ash Advisory Center (VAAC)
Based on SIGMET reports, the Buenos Aires VAAC reported that ash plumes from Ubinas rose to altitudes of 5.5-5.8 km (18,000-19,000 ft) a.s.l. on 7 July and drifted NE.
Source: Buenos Aires Volcanic Ash Advisory Center (VAAC)
According to a news articles on 30 June, the Alert level for Ubinas continued at Yellow because small explosions and ash-and-gas emissions continued during the previous two months. Inhabitants of local communities and their livestock have suffered the effects of gas and ash emissions. Local authorities have begun discussion of the potential relocation of about 650 affected families.
Based on SIGMET reports, the Buenos Aires VAAC reported that an ash plume rose to altitudes of 5.5-6.1 km (18,000-120,000 ft) a.s.l. on 26 June. The plume drifted NE and was not observed on satellite imagery.
Sources: Buenos Aires Volcanic Ash Advisory Center (VAAC); La República; Perú 21
Based on SIGMET reports, the Buenos Aires VAAC reported that ash plumes from Ubinas rose to altitudes of 5.5-5.8 km (18,000-19,000 ft) a.s.l. on 18 June and altitudes of 5.5-7.6 km (18,000-25,000 ft) a.s.l. on 22 June. The plumes drifted S, SE, and NE and were not observed on satellite imagery.
Source: Buenos Aires Volcanic Ash Advisory Center (VAAC)
Based on a SIGMET report, the Buenos Aires VAAC reported that on 13 June an ash plume from Ubinas rose to an altitude of 6.7 km (22,000 ft) a.s.l. and drifted S.
Source: Buenos Aires Volcanic Ash Advisory Center (VAAC)
Based on a SIGMET report and observations of satellite imagery, the Buenos Aires VAAC reported that on 7 June an ash plume from Ubinas rose to an altitude of 7.3 km (24,000 ft) a.s.l. and drifted S.
Source: Buenos Aires Volcanic Ash Advisory Center (VAAC)
Based on pilot reports, SIGMET reports, and observations of satellite imagery, the Buenos Aires VAAC reported that during 28-29 May ash plumes from Ubinas rose to altitudes of 5.5-6.1 km (18,000-20,000 ft) a.s.l. and drifted NE and SE. An ash plume rose to an altitude of 4.6 km (15,000 ft) a.s.l. and drifted SSW on 3 June.
Source: Buenos Aires Volcanic Ash Advisory Center (VAAC)
Based on SIGMET reports, the Buenos Aires VAAC reported that during 22-24 May ash plumes from Ubinas rose to altitudes of 4.9-7.9 km (16,000 and 26,000 ft) a.s.l. and drifted S, E, NE, and SE. On 26 May, a pilot reported that a plume rose to an altitude of km (18,000 ft) a.s.l. and drifted SSE. The plume was also identified on satellite imagery.
Source: Buenos Aires Volcanic Ash Advisory Center (VAAC)
Based on SIGMET reports, the Buenos Aires VAAC reported that ash plumes from Ubinas rose to an altitude of 5.5 and 8.5 km (18,000 and 28,000 ft) a.s.l. on 15 and 19 May, respectively. The plumes drifted E and SW.
Source: Buenos Aires Volcanic Ash Advisory Center (VAAC)
Based on SIGMET reports and pilot observations, the Buenos Aires VAAC reported that ash plumes from Ubinas rose to altitudes of 5.5-7 km (18,000-23,000 ft) a.s.l. on 9 and 12 May. Plumes drifted E and SE, respectively.
Source: Buenos Aires Volcanic Ash Advisory Center (VAAC)
Based on SIGMET reports and observations of satellite imagery, the Buenos Aires VAAC reported that ash plumes from Ubinas rose to altitudes of 5.5-9.1 km (18,000-30,000 ft) a.s.l. and drifted NE, E, and SE during 30 April-3 May. According to news articles, an ash-and-gas plume rose to an altitude of 6.2 km (20,300 ft) a.s.l. on 2 May. Ashfall was reported in local communities and dozens of residents of Querapi, about 4.5 km SE, were evacuated.
Sources: Buenos Aires Volcanic Ash Advisory Center (VAAC); Associated Press; NBC News
Based on SIGMET reports and observations of satellite imagery, the Buenos Aires VAAC reported that an ash plume from Ubinas rose to altitudes of 5.5-9.1 km (18,000-30,000 ft) a.s.l. and drifted SE and S on 23 April.
Source: Buenos Aires Volcanic Ash Advisory Center (VAAC)
Based on pilot reports, SIGMET reports, and observations of satellite imagery, the Buenos Aires VAAC reported that ash plumes from Ubinas rose to altitudes of 5.5-7.6 km (18,000-25,000 ft) a.s.l. and drifted ESE and NE during 19-22 April.
Source: Buenos Aires Volcanic Ash Advisory Center (VAAC)
Based on SIGMET advisories, the Buenos Aires VAAC reported that an ash plume from Ubinas rose to altitudes of 5.5-7 km (18,000-23,000 ft) a.s.l. and drifted ENE on 15 April.
Source: Buenos Aires Volcanic Ash Advisory Center (VAAC)
Based on pilot observations, the Buenos Aires VAAC reported that an ash plume from Ubinas rose to altitudes of 5.5-6.7 km (18,000-22,000 ft) a.s.l. and drifted E on 6 April.
Source: Buenos Aires Volcanic Ash Advisory Center (VAAC)
Based on pilot observations, the Buenos Aires VAAC reported that ash plumes from Ubinas rose to altitudes of 3.7-6.7 km (12,000-22,000 ft) a.s.l. on 26 March and 1 April. The plumes drifted SW and NW, respectively.
Source: Buenos Aires Volcanic Ash Advisory Center (VAAC)
Based on pilot observations, the Buenos Aires VAAC reported that an ash plume from Ubinas rose to altitudes of 5.5-6.1 km (18,000-20,000 ft) a.s.l. and drifted N on 17 March.
Source: Buenos Aires Volcanic Ash Advisory Center (VAAC)
Based on pilot reports and observations of satellite imagery, the Buenos Aires VAAC reported that an ash plume from Ubinas rose to altitudes of 7 km (23,000 ft) a.s.l. and drifted W and SW on 9 March.
Source: Buenos Aires Volcanic Ash Advisory Center (VAAC)
Based on pilot reports, the Buenos Aires VAAC reported that an ash plume from Ubinas rose to altitudes of 5.5-6.1 km (18,000-20,000 ft) a.s.l. and drifted SE on 2 March.
Source: Buenos Aires Volcanic Ash Advisory Center (VAAC)
Based on pilot reports, the Buenos Aires VAAC reported that ash plumes from Ubinas rose to altitudes of 5.5-8.5 km (18,000-28,000 ft) a.s.l. and drifted SE on 23 February.
Source: Buenos Aires Volcanic Ash Advisory Center (VAAC)
Based on pilot reports, the Buenos Aires VAAC reported that ash plumes from Ubinas rose to altitudes of 5.5-7 km (18,000-23,000 ft) a.s.l. and drifted NE and SW during 24-25 December.
Source: Buenos Aires Volcanic Ash Advisory Center (VAAC)
Based on Significant Meteorological Information (SIGMET) advisories and pilot reports, the Buenos Aires VAAC reported that ash plumes from Ubinas drifted NW during 11-12 December.
Source: Buenos Aires Volcanic Ash Advisory Center (VAAC)
Based on Significant Meteorological Information (SIGMET) advisories and pilot reports, the Buenos Aires VAAC reported that ash plumes from Ubinas rose to altitudes of 5.5-8.5 km (18,000-28,000 ft) a.s.l. and drifted N and NE during 4-7 and 10 December.
Source: Buenos Aires Volcanic Ash Advisory Center (VAAC)
Based on a pilot report and observations of satellite imagery, the Buenos Aires VAAC reported that ash plumes from Ubinas rose to altitudes of 6.7-7.6 km (22,000-25,000 ft) a.s.l. and drifted SW and NE during 28-29 November.
Source: Buenos Aires Volcanic Ash Advisory Center (VAAC)
Based on Significant Meteorological Information (SIGMET) advisories and observations of satellite imagery, the Buenos Aires VAAC reported that ash plumes from Ubinas rose to altitudes of 5.5-6.7 km (18,000-22,000 ft) a.s.l. during 11-12 November. Plumes drifted NNE.
Source: Buenos Aires Volcanic Ash Advisory Center (VAAC)
Based on Significant Meteorological Information (SIGMET) advisories and observations of satellite imagery, the Buenos Aires VAAC reported that ash plumes from Ubinas rose to altitudes of 5.5-7.6 km (18,000-25,000 ft) a.s.l. during 1 and 3-6 November. Plumes drifted NE and SE.
Source: Buenos Aires Volcanic Ash Advisory Center (VAAC)
Based on a Significant Meteorological Information (SIGMET) advisory, pilot reports, and observations of satellite imagery, the Buenos Aires VAAC reported that ash plumes from Ubinas rose to altitudes of 5.5-8.5 km (18,000-28,000 ft) a.s.l. and drifted NW and NE during 23-27 October.
Source: Buenos Aires Volcanic Ash Advisory Center (VAAC)
Based on a Significant Meteorological Information (SIGMET) advisory, pilot reports, and observations of satellite imagery, the Buenos Aires VAAC reported that ash plumes from Ubinas rose to altitudes of 5.5-7.3 km (18,000-24,000 ft) a.s.l. and drifted NW and NE during 19-20 and 22-23 October.
Source: Buenos Aires Volcanic Ash Advisory Center (VAAC)
Based on a Significant Meteorological Information (SIGMET) advisory and observations of satellite imagery, the Buenos Aires VAAC reported that ash plumes from Ubinas rose to altitudes of 5.5-7.6 km (18,000-25,000 ft) a.s.l. and drifted N, NNE, SE, and ESE during 11-13 and 15 October
Source: Buenos Aires Volcanic Ash Advisory Center (VAAC)
Based on pilot reports, the Buenos Aires VAAC reported that ash plumes from Ubinas rose to altitudes of 5.5-6.4 km (18,000-21,000 ft) a.s.l. and drifted E on 12 and 20 September. Ash was not identified on satellite imagery.
Source: Buenos Aires Volcanic Ash Advisory Center (VAAC)
Based on pilot reports, the Buenos Aires VAAC reported that an ash plume from Ubinas rose to altitudes of 5.5-6.4 km (18,000-21,000 ft) a.s.l. and drifted E on 12 and 20 September. Ash was not identified on satellite imagery.
Source: Buenos Aires Volcanic Ash Advisory Center (VAAC)
Based on observations of satellite imagery and a pilot report, the Buenos Aires VAAC reported that eruption plumes from Ubinas rose to altitudes of 5.5-6.7 km (18,000-22,000 ft) a.s.l. and drifted SE on 12 and 14 September.
Source: Buenos Aires Volcanic Ash Advisory Center (VAAC)
Based on observations of satellite imagery and a pilot report, the Buenos Aires VAAC reported that an eruption plume from Ubinas rose to altitudes of 5.5-7.6 km (18,000-25,000 ft) a.s.l. and drifted SE on 11 September.
Source: Buenos Aires Volcanic Ash Advisory Center (VAAC)
Based on satellite imagery, the Buenos Aires VAAC reported that an eruption plume from Ubinas rose to an altitude of 6.1 km (20,000 ft) a.s.l. and drifted SE on 9 August.
Source: Buenos Aires Volcanic Ash Advisory Center (VAAC)
Based on a Significant Meteorological Information (SIGMET) advisory, the Buenos Aires VAAC reported that ash plumes from Ubinas rose to an altitude of 5.8 km (19,000 ft) a.s.l. on 23 and 25 July. The plumes drifted SE and S, respectively. Ash was not identified on satellite imagery. On 24 July, a diffuse plume was visible on satellite imagery at an altitude of 6.1 km (20,000 ft) a.s.l.
Source: Buenos Aires Volcanic Ash Advisory Center (VAAC)
Based on a Significant Meteorological Information (SIGMET) advisory, the Buenos Aires VAAC reported that an ash plume from Ubinas rose to an altitude of 6.1 km (20,000 ft) a.s.l. and drifted SE on 22 July. Ash was not identified on satellite imagery.
Source: Buenos Aires Volcanic Ash Advisory Center (VAAC)
Based on a Significant Meteorological Information (SIGMET) advisory, the Buenos Aires VAAC reported that an ash plume from Ubinas rose to an altitude between 5.5-6.1 km (18,000-20,000 ft) a.s.l. and drifted S on 4 July. Ash was not identified on satellite imagery.
Source: Buenos Aires Volcanic Ash Advisory Center (VAAC)
Based on pilot observations and Significant Meteorological Information (SIGMET) advisories, the Buenos Aires VAAC reported that Ubinas produced ash plumes during 27-28 June to altitudes of 5.5-7 km (18,000-23,000 ft) a.s.l. Plumes drifted SW, NE, and E. A diffuse ash plume was visible on satellite imagery on 2 July.
Source: Buenos Aires Volcanic Ash Advisory Center (VAAC)
Based on observations from satellite imagery and Significant Meteorological Information (SIGMET) advisories, the Buenos Aires VAAC reported that during 13-17 June continuous emissions from Ubinas produced ash plumes to altitudes of 5.8-6.7 km (19,000-22,000 ft) a.s.l. Plumes drifted NNE, E, SE, SW, and W.
Source: Buenos Aires Volcanic Ash Advisory Center (VAAC)
Based on Significant Meteorological Information (SIGMET) advisories, the Buenos Aires VAAC reported that on 12 June an ash plume from Ubinas rose to an altitude of 6.7 km (22,000 ft) a.s.l. and drifted SE.
Source: Buenos Aires Volcanic Ash Advisory Center (VAAC)
Based on observations from satellite imagery and Significant Meteorological Information (SIGMET) advisories, the Buenos Aires VAAC reported that during 30 May-3 June and on 6 June ash plumes from Ubinas rose to altitudes of 3.7-7.6 km (12,000-25,000 ft) a.s.l. Plumes drifted NE, ESE, and SSE.
Source: Buenos Aires Volcanic Ash Advisory Center (VAAC)
Based on pilot reports, observations from satellite imagery, and Significant Meteorological Information (SIGMET) advisories, the Buenos Aires VAAC reported that during 22-28 May ash plumes from Ubinas rose to altitudes of 5.5-7.3 km (18,000-24,000 ft) a.s.l. Plumes drifted NE, E, and ESE.
Source: Buenos Aires Volcanic Ash Advisory Center (VAAC)
INGEMMET reported that during 16-17 May, ash and gas plumes from Ubinas rose to altitudes of 5.8-7.7 km (19,000-25,300 ft) a.s.l. and drifted SW, SE, and E. Based on pilot reports and satellite imagery, the Buenos Aires VAAC reported that continuous emissions produced ash plumes that rose to altitudes of 5.6-9.1 km (18,000-30,000 ft) a.s.l. during 17 and 19-22 May. Plumes drifted ESE, SE, and E.
Sources: Buenos Aires Volcanic Ash Advisory Center (VAAC); Instituto Geológico Minero y Metalúrgico (INGEMMET)
Based on pilot reports and satellite imagery, the Buenos Aires VAAC reported that on 12 and 15 May ash plumes from Ubinas rose to altitudes of 5.5-8.2 km (18,000-27,000 ft) a.s.l. and drifted SE and N, respectively.
Source: Buenos Aires Volcanic Ash Advisory Center (VAAC)
Based on pilot reports and satellite imagery, the Buenos Aires VAAC reported that ash plumes from Ubinas rose to altitudes of 5.5-9.1 km (18,000-30,000 ft) a.s.l. during 2-5 May. Plumes drifted NE, S, SE, and SW.
Source: Buenos Aires Volcanic Ash Advisory Center (VAAC)
Based on satellite imagery and pilot reports, the Buenos Aires VAAC reported that ash plumes from Ubinas rose to altitudes of 5.5-7 km (18,000-23,000 ft) a.s.l. on 26, 29, and 30 April, and 1 May. Plumes drifted E and SS
Source: Buenos Aires Volcanic Ash Advisory Center (VAAC)
INGEMMET reported that on 18 April, explosions from Ubinas produced gas and ash plumes to altitudes of 5.9-7.7 km (19,400-25,300 ft) a.s.l. Plumes drifted SW. Based on significant meteorological (SIGMET) notices, satellite imagery, and pilot reports, the Buenos Aires VAAC reported that ash plumes rose to altitudes of 5.5-7 km (18,000-28,000 ft) a.s.l. on 17, 18, 22, and 24 April. Plumes drifted NW, SW, and SE.
Sources: Instituto Geológico Minero y Metalúrgico (INGEMMET); Buenos Aires Volcanic Ash Advisory Center (VAAC)
Based on a significant meteorological notice (SIGMET), the Buenos Aires VAAC reported that an ash plume from Ubinas rose to altitudes of 5.5-7 km (26,000-27,000 ft) a.s.l. on 10 April and drifted W. INGEMMET reported that on 11 April, emissions of gas and ash produced plumes to altitudes of 6.2-6.4 km (20,000-21,000 ft) a.s.l. and drifted E. Based on an additional SIGMET, the Buenos Aires VAAC reported that an ash plume rose to altitudes of 6.1-6.4 km (20,000-21,000 ft) a.s.l. and drifted SE.
Sources: Instituto Geológico Minero y Metalúrgico (INGEMMET); Buenos Aires Volcanic Ash Advisory Center (VAAC)
Based on pilot reports and a significant meteorological notice (SIGMET), the Buenos Aires VAAC reported that ash plumes from Ubinas rose to 5.5-7 km (18,000-23,000 ft) a.s.l. during 5 and 7-9 April. Plumes drifted E, SE, S, and SW.
Source: Buenos Aires Volcanic Ash Advisory Center (VAAC)
Based on pilot reports, the Buenos Aires VAAC reported that an ash cloud from Ubinas rose to 5.5-6.1 km (18,000-20,000 ft) a.s.l. on 30 March and drifted E. According to a news article, local residents observed rockfalls and reported ashfall. A scientist from the Geological, Mining, and Metallurgic Institute (INGEMMET) reported that the eruption was the largest in a two-week period characterized by an increased rate of explosions. A diffuse ash plume was visible on satellite imagery on 3 April drifting NE.
Sources: Buenos Aires Volcanic Ash Advisory Center (VAAC); Living in Peru
Based on pilot reports, the Buenos Aires VAAC reported that an ash cloud from Ubinas rose to 5.5-6.4 km (18,000-21,000 ft) a.s.l. on 14 March and drifted SW.
Source: Buenos Aires Volcanic Ash Advisory Center (VAAC)
Based on pilot reports, the Buenos Aires VAAC reported continuous emissions from Ubinas on 11 March. Ash plumes rose to 5.5-6.1 km (18,000-20,000 ft) a.s.l. and drifted N.
Source: Buenos Aires Volcanic Ash Advisory Center (VAAC)
Based on pilot reports, the Buenos Aires VAAC reported continuous emissions from Ubinas on 21 February. Ash plumes rose to 5.5-6.7 km (18,000-22,000 ft) a.s.l. and drifted SW.
Source: Buenos Aires Volcanic Ash Advisory Center (VAAC)
Based on pilot reports, the Buenos Aires VAAC reported continuous emissions from Ubinas during 18-20 February. Ash plumes rose to 5.5-7 km (18,000-23,000 ft) a.s.l. and drifted E and SW.
Source: Buenos Aires Volcanic Ash Advisory Center (VAAC)
Based on pilot reports, the Buenos Aires VAAC reported continuous emissions from Ubinas on 2 and 5 February. Ash plumes rose to 5.5 km (18,000 ft) a.s.l. and drifted SW and S, respectively.
Source: Buenos Aires Volcanic Ash Advisory Center (VAAC)
Based on pilot reports, the Buenos Aires VAAC reported continuous emissions from Ubinas on 28 January. Ash plumes rose to 5.5 km (18,000 ft) a.s.l. and drifted SE.
Source: Buenos Aires Volcanic Ash Advisory Center (VAAC)
Based on satellite imagery, the Buenos Aires VAAC reported continuous emissions from Ubinas on 18 January. The resultant plumes drifted SW.
Source: Buenos Aires Volcanic Ash Advisory Center (VAAC)
Based on pilot reports, the Buenos Aires VAAC reported continuous emissions from Ubinas on 27 and 30 December. Ash plumes rose to 4.9-8.5 km (16,000-28,000 ft) a.s.l. and drifted E.
Source: Buenos Aires Volcanic Ash Advisory Center (VAAC)
Based on pilot reports, the Buenos Aires VAAC reported continuous emissions from Ubinas on 2 December. Ash plumes rose to 5.5 km (18,000 ft) a.s.l. and drifted N.
Source: Buenos Aires Volcanic Ash Advisory Center (VAAC)
Based on pilot reports, the Buenos Aires VAAC reported continuous emissions from Ubinas on 25 November. Ash plumes rose to 5.5 km (18,000 ft) a.s.l.
Source: Buenos Aires Volcanic Ash Advisory Center (VAAC)
Based on pilot reports, the Buenos Aires VAAC reported continuous emissions from Ubinas during 15-16 November. The plumes rose to 5.5 km (18,000 ft) a.s.l. and drifted SW and SE.
Source: Buenos Aires Volcanic Ash Advisory Center (VAAC)
Based on pilot reports and satellite imagery, the Buenos Aires VAAC reported continuous emissions from Ubinas during 9-11 and 13 November. Ash plumes rose to 5.5-7.3 km (18,000-24,000 ft) a.s.l. and drifted S, SW, NW, and NE.
Source: Buenos Aires Volcanic Ash Advisory Center (VAAC)
Based on pilot reports and satellite imagery, the Buenos Aires VAAC reported continuous emissions from Ubinas on 3, 5, and 7 November. Ash plumes rose to 6.1-7.9 km (20,000-26,000 ft) a.s.l. and drifted SW, N, and S, respectively.
Source: Buenos Aires Volcanic Ash Advisory Center (VAAC)
Based on pilot reports, the Buenos Aires VAAC reported continuous emissions from Ubinas on 25, 27-28, and 30-31 October. The plumes rose to 5.5-8.5 km (18,000-28,000 ft) a.s.l. and drifted N, NW, SW, and W.
Source: Buenos Aires Volcanic Ash Advisory Center (VAAC)
Based on pilot reports, the Buenos Aires VAAC reported continuous emissions from Ubinas on 17, 19, 21, and 23-24 October. The plumes rose to 5.5-6.4 km (18,000-21,000 ft) a.s.l. and drifted SE, SW, E, and N.
Source: Buenos Aires Volcanic Ash Advisory Center (VAAC)
Based on pilot reports and satellite imagery, the Buenos Aires VAAC reported continuous emission of ash plumes from Ubinas during 12-17 October. The plumes rose to 4.9-6.7 km (16,000-22,000 ft) a.s.l. and drifted S, SE, E, and N.
Source: Buenos Aires Volcanic Ash Advisory Center (VAAC)
Based on satellite imagery, the Buenos Aires VAAC issued an aviation ash advisory for Ubinas on 5 October. The continuous ash emissions reached altitudes of 5.5 km (18,000 ft) a.s.l. and drifted S.
Source: Buenos Aires Volcanic Ash Advisory Center (VAAC)
Aviation ash advisories for Ubinas, based on pilot reports, were issued by the Buenos Aires VAAC on 27, 28, and 30 September, and 1 October. The reports indicated continuous ash emissions.
Source: Buenos Aires Volcanic Ash Advisory Center (VAAC)
Based on pilot reports, the Buenos Aires VAAC issued aviation ash advisories for Ubinas on 24 and 25 September. The continuous ash emissions were rising as high as 9 km (30,000 ft) a.s.l. and drifting SSE.
Source: Buenos Aires Volcanic Ash Advisory Center (VAAC)
Based on pilot reports, the Buenos Aires VAAC reported continuous emission of ash plumes from Ubinas on 13 September. The plumes rose to altitudes of 4.9 km (16,000 ft) a.s.l.
Source: Buenos Aires Volcanic Ash Advisory Center (VAAC)
Based on pilot reports, the Buenos Aires VAAC reported continuous emission of ash plumes from Ubinas during 5, 9, and 11 September. The plumes rose to altitudes of ~4.9-5.5 km (~16,000-18,000 ft) a.s.l. and drifted NE and E.
Source: Buenos Aires Volcanic Ash Advisory Center (VAAC)
Based on pilot reports and satellite imagery, the Buenos Aires VAAC reported continuous emissions of ash plumes from Ubinas during 30 August-1 September and on 4 September. The plumes reached altitudes of ~4.9-5.5 km (~16,000-18,000 ft) a.s.l. and drifted NE, E, and SE.
Source: Buenos Aires Volcanic Ash Advisory Center (VAAC)
Based on pilot reports and satellite imagery, the Buenos Aires VAAC reported continuous emissions of ash plumes from Ubinas during 23-29 August. The plumes reached altitudes of 4.9-7.6 km (16,000-25,000 ft) a.s.l. and drifted NE, SE, and S.
Source: Buenos Aires Volcanic Ash Advisory Center (VAAC)
Based on pilot reports and satellite imagery, the Buenos Aires VAAC reported continuous emissions of ash plumes from Ubinas during 17-21 August. The plumes reached altitudes of ~5.5-7.9 km (~18,000-26,000 ft) a.s.l. and drifted NE, SE, and S.
Source: Buenos Aires Volcanic Ash Advisory Center (VAAC)
According to the Buenos Aires VAAC, during 8-13 August pilots reported that ash plumes emitted from Ubinas reached altitudes of between 4.9 and 5.5 km (16,000 ft-18,000 ft) a.s.l. and drifted generally N, E, and S. Ash was also visible on satellite imagery.
Source: Buenos Aires Volcanic Ash Advisory Center (VAAC)
According to the Buenos Aires VAAC, during 1-8 August pilots reported that ash plumes emitted from Ubinas reached altitudes of between 4.6 km to 6.7 km (15,000 ft-22,000 ft) a.s.l. and drifted generally NE and SW. Ash was visible on satellite imagery on 4 and 6 August.
Source: Buenos Aires Volcanic Ash Advisory Center (VAAC)
According to the Buenos Aires VAAC, a pilot reported that ash plumes from Ubinas during 22-24 July reached altitudes of 7 km (23,000 ft) a.s.l. and drifted SE. Ash plumes were visible on satellite imagery.
Source: Buenos Aires Volcanic Ash Advisory Center (VAAC)
According to the Buenos Aires VAAC, ash clouds from Ubinas were visible on satellite imagery during 14-15 July and reached altitudes of 5.5 km (18,000 ft) a.s.l. On 17 July, a pilot reported ash clouds that also reached altitudes of 5.5 km (18,000 ft) a.s.l. and drifted NE.
Source: Buenos Aires Volcanic Ash Advisory Center (VAAC)
According to the Buenos Aires VAAC, a pilot reported that ash plumes from Ubinas on 8 and 9 July reached altitudes of 5.5 km (18,000 ft) a.s.l. and drifted NW. Ash plumes were visible on satellite imagery during 8-10 July.
Source: Buenos Aires Volcanic Ash Advisory Center (VAAC)
Based on pilot reports, ash clouds identified from Ubinas on 28 June reached altitudes of 6.7 km (22,000 ft) a.s.l.
Source: Buenos Aires Volcanic Ash Advisory Center (VAAC)
Based on pilot reports, ash clouds identified from Ubinas during 9-11 June reached altitudes of 6.7 km (22,000 ft) a.s.l. and drifted E and SW. According to news articles, approximately 550 families were evacuated on 10 and 11 June.
Sources: Buenos Aires Volcanic Ash Advisory Center (VAAC); Living in Peru
On 3 June, the Alert Level for Ubinas was increased to Orange due to heightened explosive activity. During 31 May to 5 June, ash plumes reached altitudes of 7.9 km (26,000 ft) a.s.l. and drifted N, NE, SE, and S. According to a news report, on 5 June, officials in S Perú prepared to evacuate approximately 480 families.
Sources: Buenos Aires Volcanic Ash Advisory Center (VAAC); Dominican Today
According to a pilot report, the Buenos Aires VAAC reported that an ash plume from Ubinas on 24 May reached an altitude of 6.7 km (22,000 ft) a.s.l. and drifted E. On 25 May, an ash plume reached an altitude of 7 km (23,000 ft) a.s.l. and drifted NW. On 30 May, an ash plume visible on satellite imagery reached an altitude of 7.9 km (26,000 ft) a.s.l. and drifted E.
Buenos Aires Volcanic Ash Advisory Center
Source: Buenos Aires Volcanic Ash Advisory Center (VAAC)
Based on information from significant meteorological advisories (SIGMET) and pilot reports, the Buenos Aires VAAC reported that ash emitted from Ubinas during 20-23 May rose to a maximum height of 7.3 km (24,000 ft) a.s.l.
Source: Buenos Aires Volcanic Ash Advisory Center (VAAC)
Based on information from significant meteorological advisories (SIGMET) and pilot reports, the Buenos Aires VAAC reported that ash emitted from Ubinas during 9-11 and 13-14 May rose to a maximum height of 7.3 km (24,000 ft) a.s.l.
Source: Buenos Aires Volcanic Ash Advisory Center (VAAC)
Based on information from significant meteorological advisories (SIGMET), the Buenos Aires VAAC reported that ash emitted from Ubinas during 4-8 May rose to a maximum height of ~6.7 km (22,000 ft) a.s.l.
Source: Buenos Aires Volcanic Ash Advisory Center (VAAC)
According to INGEMMET, on 22 April at 0715 an explosion began at Ubinas that produced an ash-and-gas plume that reached a height between 1 and 3 km above the volcano (or 21,900 and 28,450 ft a.s.l.). This was the highest rising plume since activity began in late March. Continuous emissions occurred until 1600. Ash and gas emitted during 20-22 April traveled as far as 60 km from the volcano mainly NW, W, and SW, and traces of ash reached the Arequipa airport. During 25 and 26 April, the volume of ash emitted from the volcano decreased significantly. Gas plumes rose between 200 and 700 m above the volcano's caldera (or 19,300 and 20,900 ft a.s.l.). The Alert Level was reduced from Orange to Yellow. Seismicity during 22-26 April was higher than normal. The Buenos Aires VAAC posted volcanic ash advisories during the report period.
Sources: Instituto Geológico Minero y Metalúrgico (INGEMMET); Buenos Aires Volcanic Ash Advisory Center (VAAC)
INGEMMET reported that gas and ash was emitted from Ubinas from 27 March to at least 19 April. On 13 April, ash emissions increased noticeably in comparison to the previous days, with ashfall in the villages of Ubinas, Querapi, and Sacuaya, and as far as 7 km from the volcano. Acid rain was also noted in these villages, particularly between 1400 and 1600 on 14 April. Explosions on 13 and 14 April were heard in nearby villages. At this time, the Alert Level at the volcano was Yellow. On the 19th, a lava dome was observed on the crater floor for the first time. It was incandescent, 60 m in diameter, and 4 m high. Explosions were heard as far as 6 km from the volcano and a plume composed of ash and lava fragments rose ~ 3 km above the volcano (or 28,450 ft a.s.l.). Plumes lasted for 6-7 hours and hazard statements suggested significant danger within 4 km of the crater. The Alert Level was raised to Orange. The Buenos Aires VAAC released volcanic ash advisory statements during the report period.
According to news reports, as of 19 April at least 1,000 people living N of the volcano suffered respiratory problems, dozens of livestock died and many more were ill after eating ash-covered grass, and water sources were polluted with ash. Dozens of people from Querapi, the town closest to the volcano, began to evacuate on 21 April. On 22 April, officials declared a state of emergency for the area near the volcano and sent aid for evacuees.
Sources: Agence France-Presse (AFP); Instituto Geológico Minero y Metalúrgico (INGEMMET); Buenos Aires Volcanic Ash Advisory Center (VAAC); Reuters; Associated Press
A significant meteorological forecast (SIGMET) was issued on 15 April for an ash cloud from Ubinas at a height of 6.1-7.3 km (20,000-24,000 ft) a.s.l., and later that day for a cloud at 6.1-9.1 km (20,000-30,000 ft) a.s.l. The Aviation Color Code was Red until 16 April when the Buenos Aires VAAC received a report that activity had ceased. According to a news report on 18 April, however, officials urged residents the town of Querapi ~5 km from the volcano to evacuate.
Sources: Buenos Aires Volcanic Ash Advisory Center (VAAC); Reuters
Based on information from the Perúvian Volcanologic Observatory, the Buenos Aires VAAC reported that ash emitted from Ubinas reached 6.1-9.1 km (20,000-30,000 ft) a.s.l. on 6 April around 1220. No ash was visible on satellite imagery. The Aviation Color Code for the volcano was at Red, the highest level. At 1900 on the 6th a plume was observed at 6.1-7.3 km (20,000-24,000 ft) a.s.l. and drifting NE. The Aviation Color Code was subsequently reduced to Orange. On 8 April the VAAC received a report that volcanic activity had ceased, so the Aviation Color Code was reduced to Green, the lowest level. On the 9th, a significant meteorological forecast (SIGMET) was issued for an ash cloud at a height of 6.1-7.3 km (20,000-24,000 ft) a.s.l. that was drifting SW. The Aviation Color Code was increased to Red until 11 April. On the 11th volcanic activity reportedly ceased, so the code was again decreased to Green.
Source: Buenos Aires Volcanic Ash Advisory Center (VAAC)
Increased fumarolic activity occurred at Ubinas during the end of March. A Universidad de San Agustin scientist who visited the volcano on 31 March found strong steam-and-ash emissions occurring. Also, leaves of nearby crops were burned and a sound similar to a jet engine emanated from the vent area.
Sources: Victor Aguilar, Universidad de San Agustin, Perú; US Geological Survey Volcano Disaster Assistance Program (VDAP)
Reports are organized chronologically and indexed below by Month/Year (Publication Volume:Number), and include a one-line summary. Click on the index link or scroll down to read the reports.
Intensified fumarolic activity and minor ash emissions
Card 0585 (10 June 1969) Strong SO2 emissions from large fumaroles
The following is from El Comercio on 1 June 1969. "The Ubinas Volcano, in the Province of Moquegua, has begun to throw off gases from large fumaroles. Passengers arriving from the town of Ubinas have reported that sulfurous gases are being thrown off . . . . the dense smoke later reached the crops, thus causing damages of several hundred thousand soles. It is possible that it may result in serious damages if it should erupt."
Card 0599 (18 June 1969) Normal emissions have slightly increased, with some ash
"Ubinas volcano reported normally emitting gas and steam though fumaroles and activity slightly more intense now that normal and includes some ashes. While local peasants apprehensive, volcano does not appear dangerous at present. No lava flows reported."
Information Contacts:
Card 0585 (10 June 1969) El Comercio news, Lima, Perú; Ralph Sherrit, Lima, Perú.
Card 0599 (18 June 1969) American Embassy, Lima, Perú.
Continuous ash emissions in early July
Card 0640 (01 July 1969) Persistent ash and gas emissions
The following is from El Comercio on 28 June 1969. "The Ubinas volcano . . . continues to throw off smoke and sulfurous gases . . . . It is reported that this is the first time in a long while that such a prolonged spewing forth of material has been observed. The townspeople say that before, the smoke and gases were thrown forth only two or three times a year, but now the persistence of the phenomena is quite pronounced. At times the smoke and fumes block off the light to the town of Ubinas."
Card 0659 (11 July 1969) Continuous ash emission since 3 July causing crop damage
The following is from El Comercio on 7 July 1969. "For more than a month now, the inhabitants of the town of Ubinas have been enduring the consequences of emanations of sulfurous gas from the Ubinas volcano. News received during the last 12 hours indicates that the volcano has been throwing off ashes, almost uninterruptedly since 3 July. This very fine ash is burying the fields of adjoining areas and might result in losses to the extent of tens of thousands of soles. The smoke and sulfurous gases, as well as the ashes, may well cause considerable damage."
Information Contacts:
Card 0640 (01 July 1969) El Comercio news, Lima, Perú; Ralph Sherrit, Lima, Perú.
Card 0659 (11 July 1969) El Comercio news, Lima, Perú; Ralph Sherrit, Lima, Perú.
Weak fumarolic activity
When geologists visited Ubinas on 12 August, fumarolic activity was weak and emissions were dilute. Some noise was coming from a pit about 300 m in diameter in the N side of the 1-km summit crater. . . .
Information Contacts: M. Decobecq Dominique, Univ. Paris Sud, Orsay, France.
Increased fumarolic activity prompts seismic and other monitoring
Ubinas stratovolcano (figure 1) is known for persistent weak fumarolic activity; this appeared to increase after December 1995 and was vigorous during April 1996. During April five steam vents were located along a ~N40°W-trending fault cutting across the crater's floor and walls. White steam from the fumaroles commonly rose 100-500 m above the crater and occasionally rose 1-1.5 km above the caldera rim. Seismic monitoring during April detected ~50-70 events/day, a suggestion of increased seismicity.
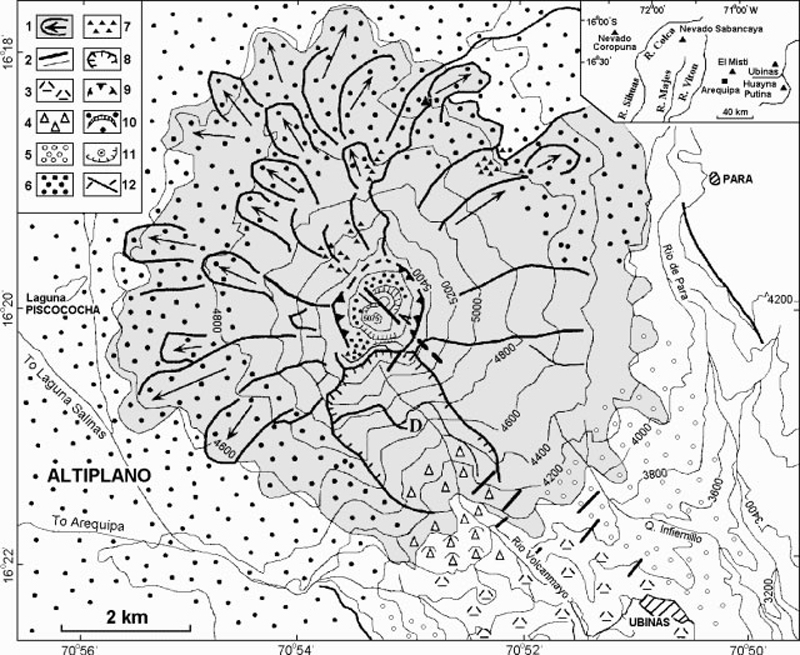 |
Figure 1. Geologic and topographic map of the Ubinas stratovolcano (regional location shown on inset). Symbols in key are as follows: 1) Ubinas volcano, mainly constructed of Pleistocene andesite lava flows; 2) lava flow cliffs >200 m high and scarps of glaciated lava flows; 3) "old" debris-avalanche deposits; 4) hummocks of recent debris-avalanche deposits; 5) Plinian fallout deposits related to the summit-caldera-forming eruption of Late-glacial age; 6) tephra-fall deposits from the 1600 AD eruption of Huaynaputina volcano; 7) channeled scoria-flow deposits; 8) headwall of caldera or rockslide avalanche; 9) summit caldera; 10) youthful ash cone and ashfall deposits mantling the caldera floor; 11) pit crater and >500-m-high walls cut in hydrothermally altered lava flows; 12) ~N40°W trending strike-slip fault and N45°E trending fractures; and D) lava dome. Drafted by F. Amathe and provided courtesy of J-C. Thouret. |
These observations led to designation of the hazard level as "Yellow," and this information was sent to local civil authorities. Scientists installed seismic instruments (three digital PDR-1 Kinemetrics and one visual MEQ-600) on the volcano's W, N, and SE flanks at ~4,800 m elevation.
Continued field work was aimed at assessing hazards and outlining preliminary hazard-zone maps. Potential hazards include debris avalanches, Plinian tephra, phreatic outbursts, and pyroclastic flows and lahars. Debris-avalanche deposits crop out in the Rio Ubinas as far as 10 km downstream. Future debris avalanches could occur if the caldera headwall, which is only 120-400 m thick, failed due to dome extrusion or seismic loading.
Widespread Plinian pumice-fall deposits include some of Holocene age. The eruption that formed the summit caldera left a conspicuous 3-m-thick Plinian tephra chiefly distributed towards the SSE, in the direction of the village of Ubinas (6 km from the vent). At least three Ubinas tephra-fall layers postdate the 1600 AD eruption of Huaynaputina (a center located 25 km S, figure 1). In contrast to the Plinian fall deposits, the intra-caldera deposits are nearly all ash and lapilli fallout of phreatomagmatic and phreatic origin.
Snowfields on the S-facing summit area above 5,000 m elevation remain during December through July and thus could be melted to generate S- and SE-flank debris flows. Pyroclastic flows could follow the same routes. Recent scoria-flow deposits remaining on the steep NW and N flanks suggest that pyroclastic flows may spill over the lower breaches of the caldera rim and down these slopes.
A 27 June news report in the Lima paper El Comercio briefly mentioned ongoing deformation and seismic studies; it included a panoramic view of the summit's nested craters with the inner pit crater emitting steam. The article also pointed out that the district of Ubinas has ~5,000 inhabitants.
Ubinas (also known as Uvinas and Uvillas) is Perú's most active volcano. Holocene lava flows cover its flanks, but the historical record, which extends back to the mid-1500's, contains evidence of minor explosive eruptions. Ubinas rises about 1,300 m above the altiplano of the Cordillera Occidental. Its summit crater is 200-400 m deep, ~1.5 km in diameter, and hosts a smaller inner crater.
Information Contacts: J-C. Thouret and J-L. Le Pennec, ORSTOM (UR14)-Instituto Geofísico del Perú (IGP), Calle Calatrava 216, Urbinizacion Camino Real, La Molina, Lima 100, Perú; R. Woodman, IGP Lima, and O. Macedo, IGP Volcano and Geophysics Observatory, Cayma-Arequipa, Perú.
Ash eruption beginning 25 March 2006; heightened seismicity since November 2004
Ubinas began erupting ash on 25 March 2006. Since mid-2005 a small increase in fumarolic activity had been seen during visits to the crater by personnel from the Instituto Geofísico del Perú (IGP), UNSA local university, and the Instituto Geologico, Minero y Metalurgico (INGEMMET); it was also reported by local authorities. Increased fumarolic emissions described by INGEMMET were reported on 18 January 2006 by Diario Digital Sur Noticias. Fumaroles started to make strong jet noises, and seismic activity increased, in February 2006. The eruption that began on 25 March, described below, has continued through at least late April.
On 25 March farmers from Querapi village, 4 km from the crater, noted ash deposits on crops. A few millimeters of ash was deposited and quickly removed by rain. The volcano had been mostly cloud-covered during the previous few weeks, but on 27 March residents of Querapi noted a column of ash at 1430. On 30 and 31 March teams from IGP, UNSA, and INGEMMET visited the volcano (figure 2). Although there had been constant snow over the previous days, the summit was completely gray from ashfall. The ash thickness on rocks 2 km NW of the crater was 3 mm, just inside the summit crater there was about 1 cm, and at the inner pit crater edge there was 2 cm. Thick ash surrounded a new 30-m-wide vent in the crater base. This crater was emitting constant ash and gas with larger pulses approximately every 15 minutes. Near the edge of the pit crater were large numbers of flat circular mud discs up to 15 cm in diameter, many with central solid cores. These grew smaller and less frequent with distance. It is thought these are either huge accretionary lapilli, generated in storm clouds above Ubinas, or products of wet eruptions from the new vent. The crater area is dangerous and frequently smothered in ash clouds, so observations remain sketchy.
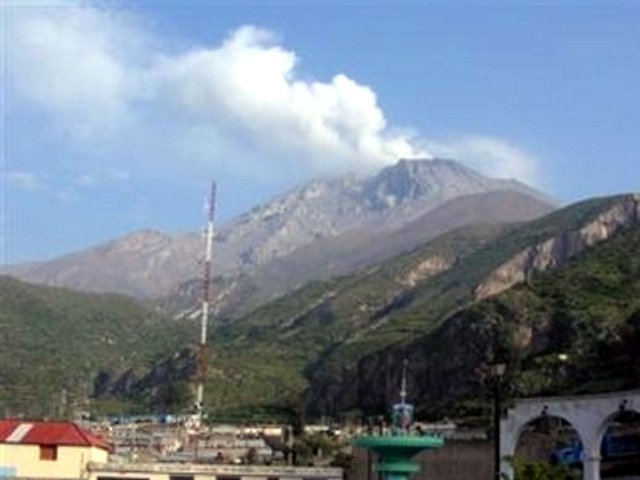 |
Figure 2. Photo of Ubinas on 31 March 2006 showing an eruption plume rising from the summit crater. Photo by the Perúvian Civil Defense taken from Moquegua city, provided courtesy of the Associated Press. |
Ash emissions through 10 April covered local villages and damaged crops. Clear crop damage was visible around the village of Querapi, with potato and alfalfa leaves and flowers blemished in spots. This is the critical growing time for the crop, and thus any damage is serious for the local farmers. Cattle have been seen suffering from diarrhea.
Short periods of seismic recordings have been made at a site 2,500 m NW of the crater rim. On 20 November 2004 only 16 local events were recorded over 12 hours. In February 2005 there where 96 events over the same time period. Over 12 hours on 27 March 2006 there were 115 events. During this last interval, low-amplitude tremor events lasting 3 minutes on average were recorded, as well as long-period (LP) events. Over the 12 hours of observation the following events were recorded: 62 LP, 18 LP with precursors, 10 volcano-tectonic (VT), five VT with precursors, and 20 tremor events.
Information Contacts: Orlando Macedo, Observatorio de Cayma-Arequipa, Instituto Geofísico del Perú at Arequipa city (IGP-Arequipa), Urb. La Marina B-19, Cayma, Arequipa, Perú; Jersy Marino, Instituto Geologico, Minero y Metalurgico (INGEMMET), Perú; Benjamin van Wyk, Laboratoire Magmas et Volcans (LMV), OPGC, France; Jean-Philippe Métaxian, Laboratire de Geophysique Interne et Tectonophysique-Univ de Savoie, France; Perúvian Civil Defense (URL: http://www.indeci.gob.pe/); Diario Digital Sur Noticias, Tacna, Perú (URL: http://www.surnoticias.com/); Associated Press (URL: http://www.ap.org/).
Ash and steam emissions stir hazard and environmental concerns
Ubinas began erupting ash on 25 March 2006 (BGVN 31:03). Randall White from the U.S. Geological Survey (USGS) reported on 1 April that increased fumarolic activity occurred during the end of March. Victor Aguilar from the Universidad de San Agustint, visited the volcano on 31 March. He found strong steam-and-ash emissions occurring. Also, leaves of nearby crops were burned and a sound similar to a jet engine emanated from the vent area. Table 1 gives a summary of some recent plumes. Figure 3 contains an ASTER image of the volcano and surroundings on 8 May 2006.
Table 1. Summary of some recent plume activity from Ubinas. Courtesy of the Buenos Aires VAAC and INGEMMET; satellite imagery courtesy of NASA Earth Observatory.
| Date (time) | Altitude | Drift direction | Comments |
| 06 Apr (1220) | 6.1-9.1 km | -- | Ash absent on satellite imagery |
| 06 Apr (1900) | 6.1-7.3 km | NE | -- |
| 08 Apr | -- | -- | Volcanic activity ceased |
| 09 Apr | 6.1-7.3 km | SW | -- |
| 11 Apr | -- | -- | Volcanic activity ceased |
| 13 Apr | -- | -- | Ash emissions increased, ashfall reached 7 km from volcano |
| 15 Apr | 6.1-9.1 km | -- | Ash cloud |
| 16 Apr | -- | -- | Volcanic activity ceased |
| 18 Apr (0715-1600) | 1-3 km | -- | Continuous emissions of ash and gas |
| 19 Apr | ~3 km | -- | Plume containing ash/lava fragments lasted 6-7 hours |
| 20 Apr-22 Apr | -- | NW, W, SW | Plume reached 60 km from the volcano; traces of ash reached the Arequipa airport. |
| 25 Apr-26 Apr | 0.2-0.7 km | -- | -- |
| 04 May-08 May | ~6.7 km | -- | See fig. 15 |
| 9-11, 13-14 May | 7.3 km (max) | -- | -- |
| 20 May-25 May | 7.3 km (max) | -- | -- |
| 24 May | 6.7 km | E | Plume reported by pilot |
| 25 May | 7 km | NW | -- |
| 30 May | 7.9 km | E | Ash plume seen on satellite imagery |
| 31 May-05 Jun | 7.9 km | N, NE, SE, S | -- |
| 09 Jun-11 Jun | 6.7 km | E, SW | Ash clouds reported by pilots |
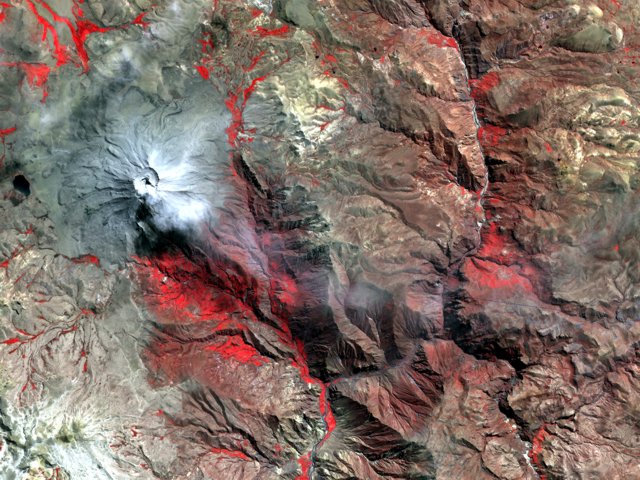 |
Figure 3. A faint white plume rose from the summit of Ubinas on 8 May 2006, when the Advanced Spaceborne Thermal Emission and Reflection Radiometer (ASTER) on NASA's Terra satellite captured this image. Courtesy NASA Earth Observatory. |
The Perú Instituto Geológico Minero y Metalúrgico (INGEMMET) reported that gas and ash were emitted from Ubinas from 27 March to at least 19 April. On 13 April, ash emissions increased noticeably in comparison to the previous days, with ashfall in the villages of Ubinas, Querapi, and Sacuaya, and as far as 7 km from the volcano. Acid rain was also noted in these villages, particularly between 1400 and 1600 hours on 14 April. Explosions on 13 and 14 April were heard in nearby villages. According to a news report on 18 April, however, officials urged residents of the town of Querapi ~ 5 km from the volcano to evacuate.
On 19 April, a lava dome was observed on the crater floor for the first time. It was incandescent, 60 m in diameter, and 4 m high. Explosions were heard as far as 6 km from the volcano and a plume composed of ash and lava fragments rose ~ 3 km above the volcano. Plumes lasted for 6-7 hours and hazard statements suggested significant danger within 4 km of the crater. The Buenos Aires Volcanic Ash Advisory Center (VAAC) released volcanic ash advisory statements during the report period.
According to news reports, as of 19 April at least 1,000 people living N of the volcano suffered respiratory problems, dozens of livestock died and many more were ill after eating ash-covered grass, and water sources were polluted with ash. Dozens of people from Querapi, the town closest to the volcano, began to evacuate on 21 April. On 22 April, officials declared a state of emergency for the area near the volcano and sent aid for evacuees.
During 25 and 26 April, the volume of ash emitted from the volcano decreased significantly. Gas plumes rose between 200 and 700 m above the volcano's caldera. Seismicity during 22-26 April was higher than normal. The Buenos Aires VAAC posted volcanic ash advisories during the report period.
Several thermal anomalies were observed by MODIS/MODVOLC in 2006 at the following local times: 0105 hours, 27 May; 2220 hours, 31 May; 2225 hours, 7 June; 2210 hours, 18 June; and 2235 hours, 30 June. On 3 June, the Alert Level for Ubinas was increased to Orange due to heightened explosive activity. According to a news report, on 5 June, officials in S Perú prepared to evacuate approximately 480 families; approximately 550 families were evacuated on 10 and 11 June. Ubinas emitted a plume of ash and/or steam on 24 June 2006. The Moderate Resolution Imaging Spectroradiometer (MODIS) flying onboard NASA's Aqua satellite showed the plume moving E.
Information Contacts: Randall A. White, USGS/OFDA Volcano Disaster Assistance Program; Victor Aguilar, Universidad de San Agustin, Perú; Buenos Aires Volcanic Ash Advisory Center; Instituto Geológico Minero y Metalúrgico (INGEMMET ? Institution of Mining and Metallurgical Geology); National Aeronautics and Space Administration (NASA) Earth Observer (URL: http://earthobservatory.nasa.gov/NaturalHarards/).
New reporting reveals ashfalls, large ballistic blocks, lahar hazards, and evacuations
Ubinas began erupting ash on 25 March 2006 (BGVN 31:03 and 31:05); ash eruptions and steam emissions continued through at least 31 October 2006. Eruptive benchmarks during that period included a lava dome in the crater on 19 April. Ashfall in late April forced the evacuation of Querapi residents, who resided ~ 4.5 km SE of the crater's active vent, to Anascapa (S of the summit). Ash columns rose to almost 8 km altitude during May.
This report discusses ongoing eruptions through 31 October 2006 as drawn from Buenos Aires Volcanic Ash Advisory Center (VAAC) reports and especially from an enlightening 26-page report published in Péru during September 2006 by the Institutio Geológico Minero y Metalúrgico?INGEMMET (Salazar and others, 2006). It includes a detailed digital elevation map with hazard zones.
Background. Ubinas lies 90 km N of the city of Moquegua and 65 km E of the city of Arequipa (figure 4). The bulk of adjacent settlements reside to the SE, and generally at more distance, towards the E. Figure 5 shows a shaded region where airfall deposits took place during the span 1550-1969. The zone of deposits includes some modern settlements.
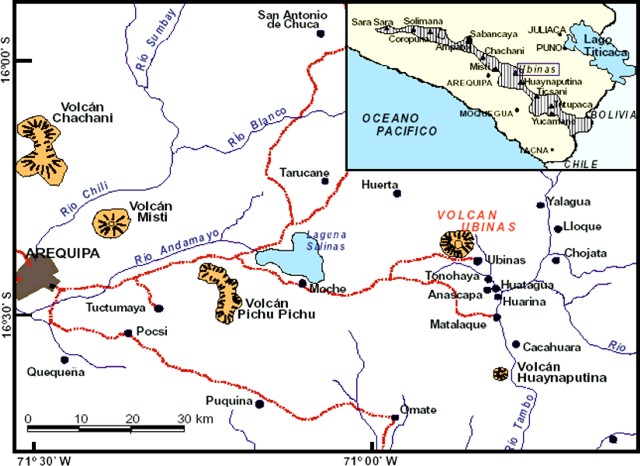 |
Figure 4. Map indicating the geographic setting of the Perúvian volcanic front (inset) and the area around Ubinas. From Salazar and others (2006). |
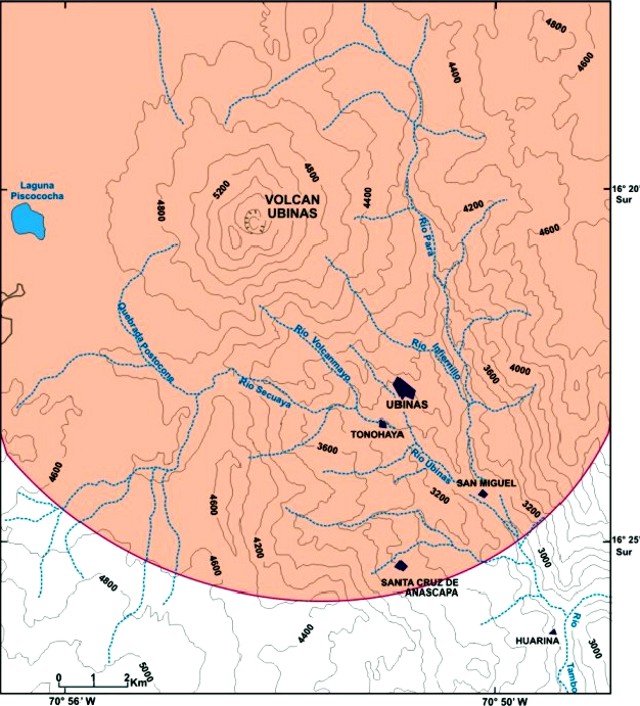 |
Figure 5. The boundary of identified Ubinas ashfall from the years 1550 to 1969 appears as a curve across the S portion of this map, 10-12 km from the summit crater. Note the SE-sector settlements (and their respective distances from the summit crater) for the district capital Ubinas (6.5 km), Tonohaya (7 km), San Miguel (10 km), and Santa Cruz de Anascapa (~ 11 km), and Huarina (15 km). Map taken from Rivera (1998). |
The geologic map on figure 6 shows the area of the settlements SE of the summit includes large Holocene deposits, including those from debris avalanche(s) at ~ 3.7 ka, and units containing pyroclastic flows. The map also indicates deposits of volcaniclasics, glacial moraines, airfall-ash layers, and lava flows. Extensive Miocene deposits envelope both the NE flanks (Pampa de Para) and SW flanks.
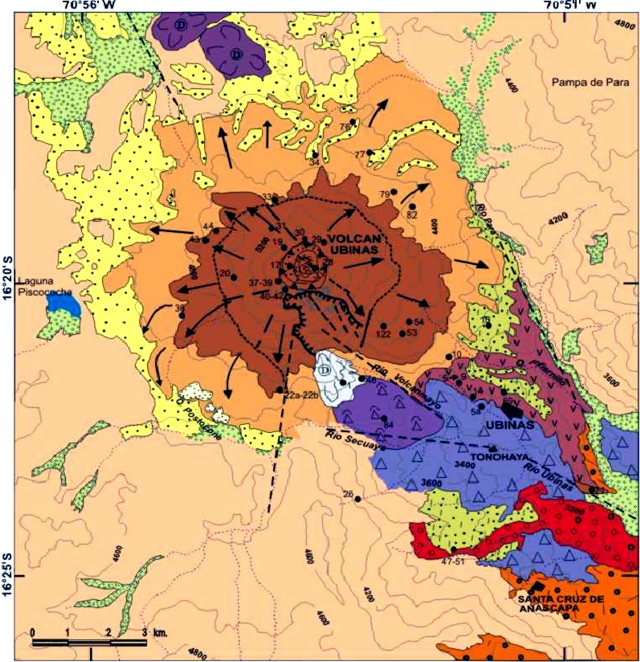 |
Figure 6. Geologic map of Ubinas shown here without the key, which is available in the original report. From Salazar and others (2006). |
The map of hazard zones (figure 7) indicates a nested, tear-drop shaped set of zones, with comparatively lower inferred hazard to the NE and NW. The SE-trending, elongate area of hazards follows the key drainage in that direction. Elevated hazard zones also follow many of the roads passing through the region.
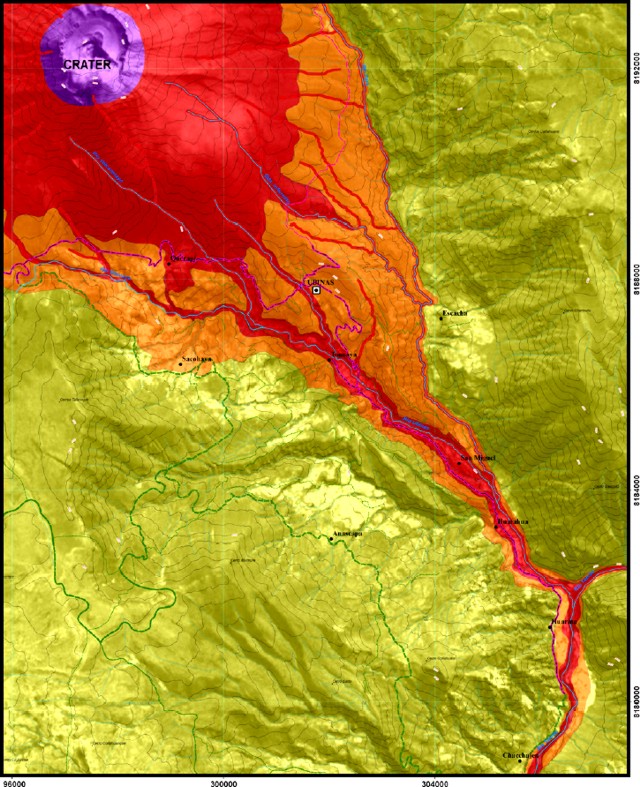 |
Figure 7. The SE corner of the Ubinas hazard map, showing the central crater, and the hazard zones that follow the main drainage (Rio Ubinas) leading SE through the most populated region close to the volcano. Map key is omitted. Margins of the map note that its construction was a partnership of numerous groups, including French collaborators at Blaise Pascal University and IRD. Taken from Salazar and others (2006). |
Eruptions during 2006. Salazar and others (2006) reported that the current eruptive crisis could be divided into three stages. During July 2005-27 March 2006, the eruption was primarily gas discharge rising 100-300 m above the crater. During 27 March-8 April the eruptions consisted of ash emissions and gas produced by phreatic activity (figure 8). After a moderate explosion on 19 April, Ubinas produced ash and gas, and explosions ejected volcanic bombs. Several views into the crater appear on figure 9.
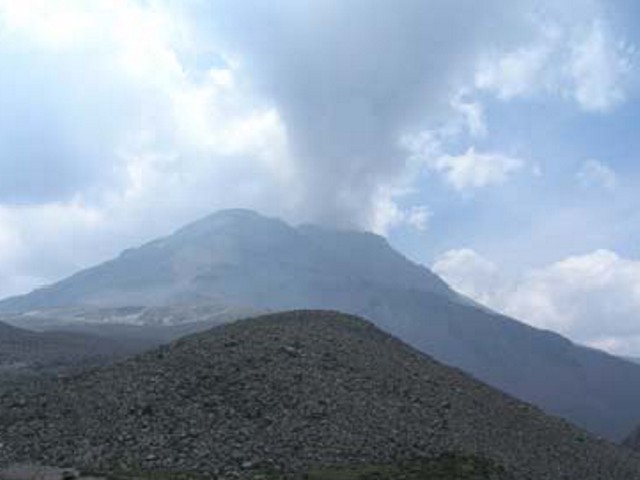 |
Figure 8. Ubinas gas emissions as seen from unstated direction on 4 April 2006. From Salazar and others (2006). |
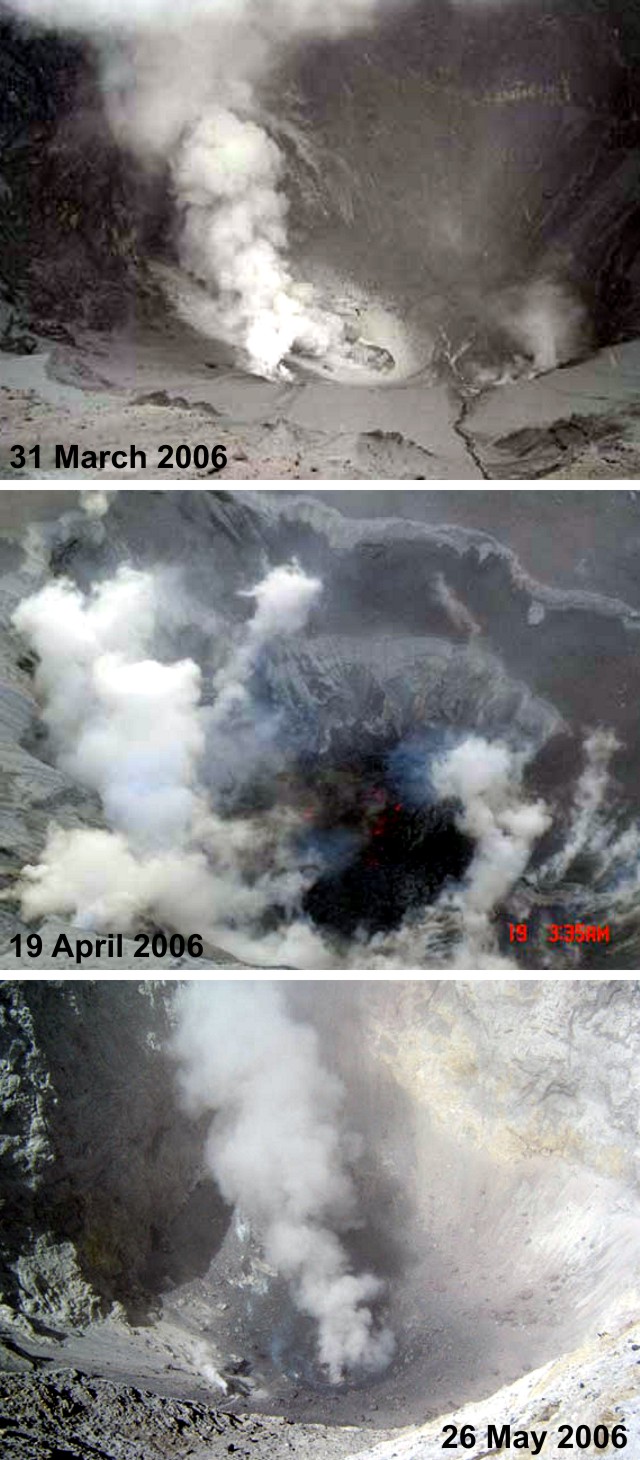 |
Figure 9. Views looking down into the Ubinas crater on 31 March, 19 April, and 26 May 2006. The former was taken in comparatively mild conditions. The 19 April photo was taken when a 60-m-diameter lava body was first seen on the crater floor (the color version of this photo shows faint red incandescence penetrating the steamy scene). The 26 May captured a relatively clear view of the steaming dome on the crater floor. March and April photos from and Salazar and others (2006); May photo from the INGEMMET website. |
On 7 May 2006 a moderate explosion sent ash to ~ 3 km above the summit. Although the situation calmed in the following days, an impressive bomb fell 200 m from the crater on 24 May 2006 (figure 10). Larger outbursts occurred on 29 May and 2 June, prompting the civil defense decision to evacuate residents in the S-flank Ubinas valley, including the settlements of Ubinas, Tonohaya, San Miguel, Huatahua, and Escacha. Residents evacuated were lodged in refugee camps (figure 11).
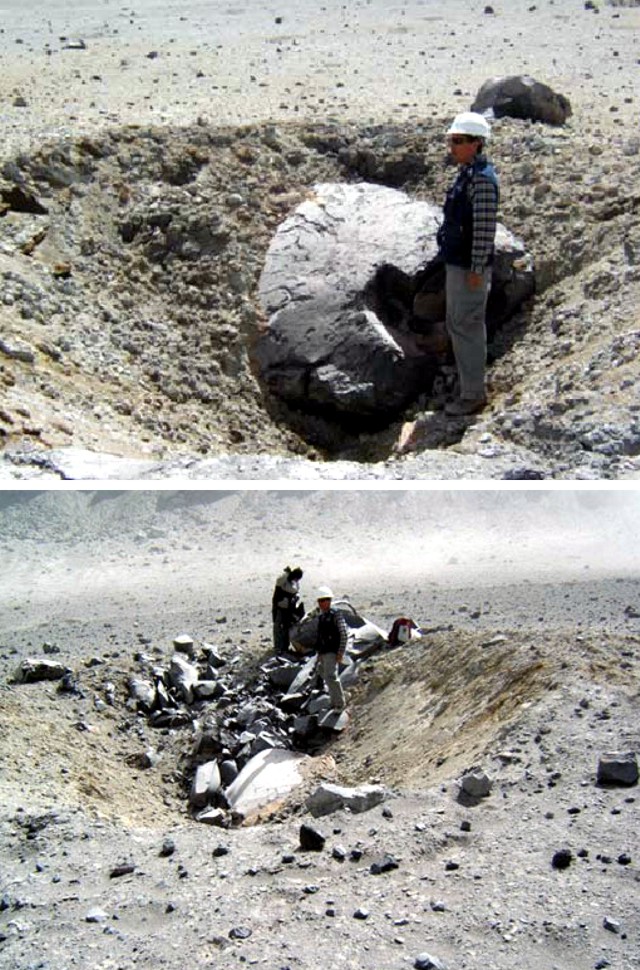 |
Figure 10. Ubinas eruptions in May 2006 ejected volcanic bombs, seen here in their impact craters. A 2-m-diameter bomb (top), struck ~ 200 m from the crater. A crater containing a large, partly buried, smooth-faced bomb is seen in the bottom photo. Numerous bucket-sized angular blocks appear on the far side of the impact crater. Two geologists stand adjacent a ~ 2-m-long block that ended up on the impact crater's rim. The bomb fragments were of andesitic composition. Top photo from Salazar and others (2006); bottom photo from INGEMMET website. |
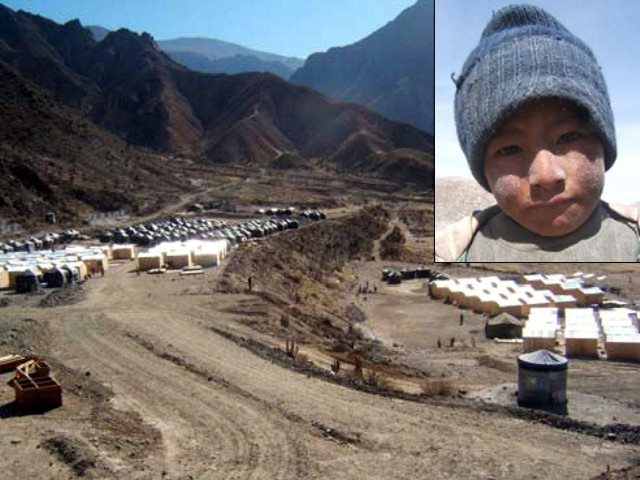 |
Figure 11. Settlement camp housing families taking refuge from Ubinas ash. This camp, named Chacchagen, housed people from the S-flank settlements of Ubinas, Tonohaya, San Miguel, Huatahua, and Escacha. Inset shows the ash-dusted face of a local child. Courtesy of Salazar and others (2006). |
On 18 June instruments recorded two explosions. Ash clouds discharged; the second one also ejected incandescent blocks ~ 1 km SE of the crater. The early stages of a rising plume seen at 0822 on 18 July appears on figure 12. Similar magnitude ash emissions were noted on 23, 24, and 30 June 2006, and incandescent rocks fell up to 1.2 km from the summit crater. During 10, 17-19, 22, 27 July, and 7 August 2006 there were various explosions (figure 12). Resulting ash clouds extended more than 70 km SE or SW.
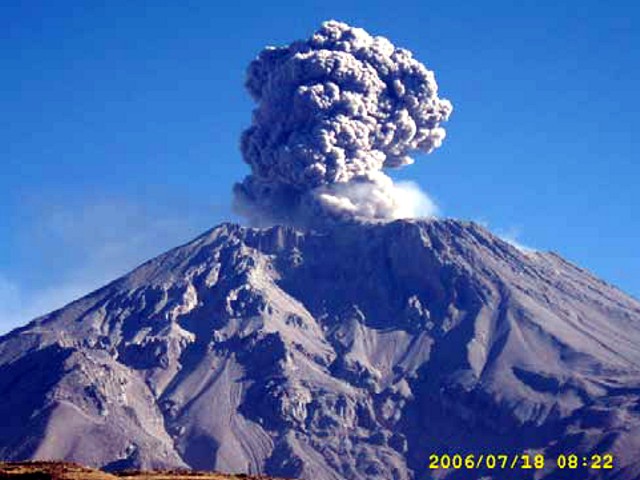 |
Figure 12. A moderate Ubinas explosion on 18 July 2006 generated this rising ash plume. Courtesy of Salazar and others (2006). |
In August 2006, ash plumes reached 4.6-7.6 km altitude and were occasionally visible on satellite imagery. The direction of drift of the ash varied widely. On 12 August, ash dispersed more than 100 km to the SE and S. On 14 August an astronaut on the International Space Station took a picture of the ash plume from Ubinas (figure 13).
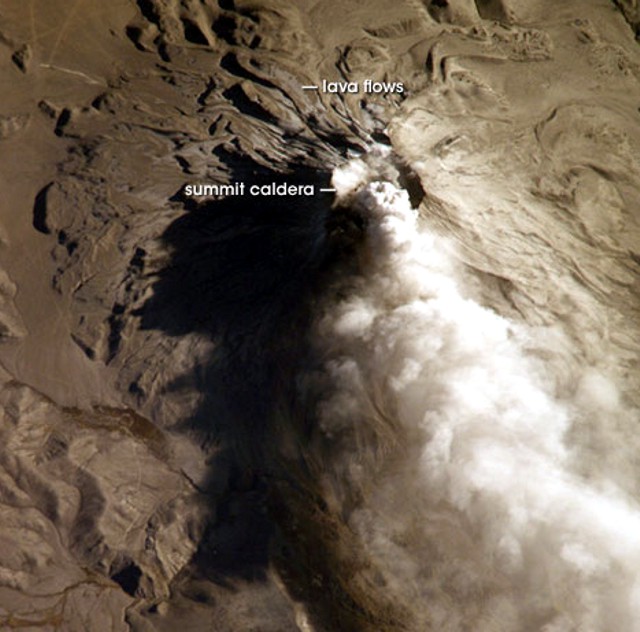 |
Figure 13. This image taken from the International Space Station (ISS) captures Ubinas discharging a light-colored ash cloud roughly to the S (N is up on this photo). The cloud had been observed earlier on satellite imagery at 0600 local (1100 UTC) on 14 August 2006. One-hour and 45-minutes later (at 1245 UTC), an ISS astronaut took this picture at non-vertical (oblique) angle to the Earth. Pumice and ash blanket the volcanic cone and surrounding area, giving this image an overall gray appearance. Shadows on the N flank throw several older lava flows into sharp relief. (Photograph ISS013-E-66488 acquired with a Kodak 760C digital camera using an 800 mm lens). Photo provided by the ISS Crew. |
The most significant effect on people and the environment has come from ashfall (figure 14). GOES satellite images indicate visible airborne ash for distances greater than 60 km from the vent. Figure 14 indicates net ash accumulation through about August 2006, extrapolating sampling points with concentric circles. The report specifically noted ash thicknesses of 1.5 cm at ~ 4.5 km SE in Querapi, 0.1-0.8 cm in Sacoaya, 0.5-0.8 cm in Ubinas, 0.3-0.4 cm in Anascapa, 0.15 mm in Huatahua, and less than 0.1 cm in Chacchagén. The accumulation has apparently been due to ongoing ashfalls On 13 April, several millimeters of ash dusted all surfaces in Querapi, ~ 4.5 km from the center of the summit crater.
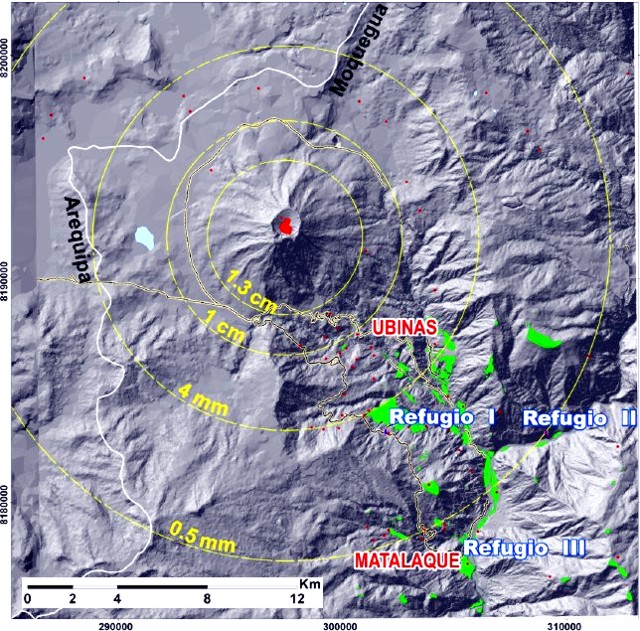 |
Figure 14. Net ash accumulation around Ubinas from start of eruption in March through about August 2006. Ash has covered agricultural fields in the valley and pastures in the highlands, seriously affecting the two main economic activities in the area, agriculture and cattle ranching; and has caused respiratory and skin problems. Courtesy of Salazar and others (2006). |
Aviation reports of ash plumes. As summarized in table 2, ash clouds were reported by the Buenos Aires Volcanic Ash Advisory Center (VAAC) on 2 May and then during 2 August through October on a nearly daily basis. The observation sources were usually pilot's reports (AIREPs) and/or satellite images (GOES 12). After 8 August, ash emissions were essentially continuous to 31 October. During the later interval, the aviation color code was generally Red. Plumes rose to 10 km and higher during 23-26 October.
Table 2.Compilation of aviation reports (specifically, 195 Volcanic Ash Advisories, VAAs) on Ubinas and its plumes during May through 31 October. The second column shows some contractions used in the table (eg., "VA CLD FL 160" means "Volcanic ash cloud at Flight Level 160"). Flight Level is an aviation term for altitude in feet divided by 100 (eg., FL 200 = 20,000 feet = ~ 7 km altitude). Courtesy of the Buenos Aires VAAC.
| Observation date (2006) | Eruption details: VA (Volcanic Ash), CLD (Cloud), OBS (Observed), FL (Flight Level) |
| 02 May | VA CLD FL180/200 MOV SE |
| 02 Aug | VA CLD DENSE ASH CLD FL160/230 MOV NE. ASH POORLY DEFINED VISIBLE GOES-12 SATELLITE IMAGE |
| 03 Aug-04 Aug | VA CLD FL220/240 MOV SW |
| 05 Aug | VA CLD OBS FL370 MOV NE |
| 06 Aug-07 Aug | VA CLD OBS. ACTIVITY REPORTED CONTINUOUS AND INCREASING EMISSION FL160/260 SNTR OVER PEAK SPREAD FROM THE SUMMIT IN ALL DIRECTIONS UP TO A DISTANCE OF 20 KM |
| 07 Aug-08 Aug | VA CLD OBS FL200 MOV E/NE |
| 10 Aug-14 Aug | VA CLD OBS FL180/245 MOV SE. ASH OBS IN SATELLITE IMAGE |
| 17 Aug-18 Aug | VA CLD FL 160-200 MOV SE/ESE APROX. 60NM |
| 19 Aug | VA CLD FL180/250 MOV SW |
| 20 Aug-21 Aug | VA CLD FL180/230 MOV ESE/SE APROX. 20NM |
| 22 Aug | VA CLD OBS FL180/300 STNR ~ MOV SE |
| 25 Aug-26 Aug | VA CLD OBS FL230/235 MOV S. ASH NOT IDENTIFIABLE ON SATELLITE IMAGERY |
| 28 Aug-30 Aug | VA CLD OBS FL160/250 MOV SE. SATELLITE IMAGERY REVEALED A LIGHT TRACE OF ASH EXTENDING TO SE OF THE SUMMIT |
| 31 Aug | VA CLD OBS FL 160/250 APROX MOV NE~E |
| 01 Sep-23 Sep | VA CLD OBS FL 160/250 MOV NE~E |
| 24 Sep | VA CLD FL300 MOV SSE |
| 27 Sep | VA CLD OBS FL180/230 and up to FL280 |
| 01 Oct-11 Oct | VA CLD OBS FL160/180 MOV E~ S |
| 12 Oct-14 Oct | Emissions intermittent. VA CLD OBS FL160/220 MOV SE~NE~N |
| 15 Oct-21 Oct | VA CLD FL160~ 240 MOV S~ SE |
| 23 Oct-26 Oct | VA CLD FL180/350 (Unusually high altitude) MOV N~E~W |
| 26 Oct-29 Oct | VA CLD FL180/240 MOV N~NW swing to S |
| 30 Oct-31 Oct | VA CLD FL 280/300 MOV SW |
References. Rivera, M., 1998, El volcán Ubinas (sur del Perú): geología, historia eruptiva y evaluación de las amenazas volcánicas actuales: Tesis Geólogo, UNMSM, 132 p.
Rivera, M., Thouret, J.C., Gourgaud, A., 1998, Ubinas, el volcán mas activo del sur del Perú desde 1550: Geología y evaluación de las amenazas volcánicas. Boletin de la Sociedad Geológica del Perú, v. 88, p. 53-71.
Salazar, J.M., Porras, M.R., Lourdes, C.D., and Pauccara, V.C., 2006, Evaluación de seguridad físca de áreas aledañas al volcán Ubinas: INGEMMET (Instituto Geológico Minero y Metalúrgico Dirección de Geología Ambiental, September 2006), 26 p.
Thouret, J.C., Rivera, M., Worner, G., Gerbe, M.C., Finizola, A., Fornari, M., and Gonzales, K., 2005, Ubinas: the evolution of the historically most active volcano in southern Perú: Bull. Volc., v. 67, p. 557-589.
Information Contacts: Jersy Mariño Salazar, Marco Rivera Porras, Lourdes Cacya Dueñas, Vicentina Cruz Pauccara, Instituto Geológico Minero y Metalúrgico (INGEMMET), Av. Canadá No 1470, Lima, Perú (URL: http://www.ingemmet.gob.pe/); Buenos Aires Volcanic Ash Advisory Center, Servicio Meteorológico Nacional, Argentina (URL: http://www.smn.gov.ar/vaac/buenosaires/productos.php); ISS Crew, Earth Observations Experiment and the Image Science & Analysis Group, NASA Johnson Space Center, 2101 NASA Parkway Houston, TX 77058, USA (URL: http://www.nasa.gov/centers/johnson/home/); National Aeronautics and Space Administration (NASA) Earth Observatory (URL: http://earthobservatory.nasa.gov/NaturalHazards/).
Continuing ashfall during 2006-2007
Ubinas began erupting ash on 25 March 2006 (BGVN 31:03 and 31:05). As reported in BGVN 31:10, ash eruptions and steam emissions continued through 31 October 2006. This report discusses ongoing eruptions through December 2007 as drawn from Buenos Aires Volcanic Ash Advisory Center (VAAC) reports and the Instituto Geológical Minero y Metalúrgico (INGEMMET).
From November 2006 through December 2007, emissions of volcanic ash, rocks, and gases with water and steam were essentially continuous. INGEMMET authorities indicated that during March 2007 the volcano generated increased ashfall behavior that significantly affected people and the environment. At the beginning of the month, small explosions occurred every 6-8 days but the rate of activity increased toward the end. On 30 March 2007, nearby residents felt a strong explosion. A large ash plume vented from the volcano's summit and local communities were blanketed beneath falling ash. According to INGEMMET authorities, most of Querapi, a town ~ 4.5 km SE of the crater's active vent, was covered in volcanic ash, and the town of Anascapa, 6 km E, also experienced ashfall.
Volcanic ash clouds blown into the atmosphere also presented a hazard to aviation. As summarized in table 3, ash clouds were nearly continuously reported by the Buenos Aires VAAC and the INGEMMET. Plume heights reached as high as 9.1 km in May and again in November 2007. The aviation warning color code was generally Red through the period. The reports were based on satellite imagery and pilot reports. No thermal alerts were noted from the University of Hawaii's Institute of Geophysics and Planetology (HIGP) MODIS satellite-based thermal alert system during 2006 or 2007.
Table 3. Compilation of Volcanic Ash Advisories for aviation from Ubinas during November 2006 through December 2007. Courtesy of the Buenos Aires Volcanic Ash Advisory Center (VAAC) and the Instituto Geológical Minero y Metalúrgico (INGEMMET).
| Date | Altitude of Plume (km) | Flight Level (thousands of feet) | Direction of Plume |
| 3-16 Nov 2006 | 5.5-7.3 | 190-260 | SW, S, SW |
| 25 Nov 2006 | 5.5 | 180 | NE |
| 2 Dec 2006 | 5.5 | 180 | N |
| 27-30 Dec 2006 | 4.9-8.5 | 160-280 | E |
| 28 Jan 2007 | 5.5-6.9 | 180-220 | SE |
| 2-5 Feb 2007 | 5.5 | 180 | S, SW |
| 18-21 Feb 2007 | 5.5-7.0 | 180-230 | E, SW |
| 11, 14 Mar 2007 | 5.5-6.4 | 180-210 | N, SW |
| 30 Mar 2007 | 5.5 | 180 | E |
| 5, 7-9, 10-11 Apr 2007 | 5.5-7.8 | 180-270 | E, SE, S, SW, W |
| 17-18, 22, 24 Apr 2007 | 5.5-7.2 | 180-280 | NW, SW, SE |
| 2-5 May 2007 | 5.5-9.1 | 180/300 | N, S, SE, SW |
| 12, 15-16 May 2007 | 5.5-8.2 | 180-270 | SE, N, SW |
| 17, 19-22 May 2007 | 5.5-9.1 | 180-300 | E, SE |
| 22-28 May 2007 | 5.5-7.3 | 180-240 | NE, SE |
| 30 May-6 Jun 2007 | 3.7-7.6 | 120-250 | NE, SE |
| 12-17 Jun 2007 | 5.5-6.7 | 180-230 | NE, E, SW, W |
| 27-28 Jun 2007 | 5.5-6.7 | 180-230 | SW, NW, E |
| 4 Jul 2007 | 5.5-6.1 | 180-200 | S |
| 23-25 Jul 2007 | 5.9-6.1 | 190-200 | SE, S |
| 9 Aug 2007 | 6.1 | 200 | SE |
| 11-14 Sep 2007 | 5.5-7.6 | 180-250 | E, SE |
| 20 Sep 2007 | 5.5-6.4 | 180-210 | E |
| 5-7 Oct 2007 | 5.5-6.4 | 180-210 | N, S |
| 11-13, 15 Oct 2007 | 5.5-7.6 | 180-250 | N, SE |
| 19-27 Oct 2007 | 5.5-8.5 | 180-280 | NW, NE |
| 1, 3-6 Nov 2007 | 5.5-7.6 | 180-250 | NE, SE |
| 11-12 Nov 2007 | 5.5-6.7 | 180-220 | NE |
| 16, 18, 20 Nov 2007 | 5.5-7.9 | 180-260 | NE |
| 24-27 Nov 2007 | 6.1-9.1 | 200-300 | SE, E, SW |
| 28-29 Nov 2007 | 6.7-7.6 | 220-250 | SW, NE |
| 4-7, 10 Dec 2007 | 5.5-8.5 | 180-280 | NE |
| 17 Dec 2007 | 5.5-6.7 | 180-220 | N |
Information Contacts: Instituto Geológical Minero y Metalúrgico (INGEMMET), Av. Canadá 1470, San Borja, Lima 41, Perú (URL: http://www.ingemmet.gob.pe/); Buenos Aires Volcanic Ash Advisory Center (VAAC), Argentina (URL: http://www.smn.gov.ar/vaac/buenosaires/productos.php).
Frequent ash plumes pose risk to aviation and residents
Our most recent report on Ubinas (BGVN 33:01) discussed ongoing eruptions with continuous emissions of volcanic ash, rock, and gases during 2006-2007. During that previously discussed interval, ash plumes sometimes reached ~ 9 km altitudes at times, posing a hazard to aviation, ashfall was heavy. The current report discusses activity from the end of the previous report (17 December 2007) through 15 July 2008. During this period, ash plumes were frequent, as indicated in table 4. No thermal alerts have been detected by the University of Hawaii's Institute of Geophysics and Planetology (HIGP) MODIS satellite-based thermal alert system since 27 December 2006.
Table 4. Compilation of Volcanic Ash Advisories for aviation from Ubinas during 19 December 2007 through July 1, 2008. Courtesy of the Buenos Aires Volcanic Ash Advisory Center (VAAC) and the Instituto Geológical Minero y Metalúrgico (INGEMMET).
| Date | Plume altitude (km) | Plume direction |
| 19-25 Dec 2007 | 5.5-7 | NE, SW |
| 23 Feb 2008 | 5.5-8.5 | SE |
| 02 Mar 2008 | 5.5-6.1 | SE |
| 09 Mar 2008 | 7 | W, SW |
| 17 Mar 2008 | 5.5-6.1 | N |
| 26 Mar 2008 | 3.7-6.7 | SW |
| 01 Apr 2008 | 3.7-6.7 | NW |
| 06 Apr 2008 | 5.5-6.7 | E |
| 15 Apr 2008 | 5.5-7 | ENE |
| 19-22 Apr 2008 | 5.5-7.6 | ESE, NE |
| 23 Apr 2008 | 5.5-9.1 | SE, S |
| 30 Apr-03 May 2008 | 5.5-9.1 | NE, E, SE |
| 09 May 2008 | 5.5-7 | E |
| 12 May 2008 | 5.5-7 | SE |
| 15 May 2008 | 5.5 | E, SW |
| 19 May 2008 | 8.5 | E, SW |
| 22-24 May 2008 | 4.9-7.9 | S, E, NE, SE |
| 26 May 2008 | 5.4 | SSE |
| 28-29 May 2008 | 5.5-6.1 | NE, SE |
| 03 Jun 2008 | 4.6 | SSW |
| 07 Jun 2008 | 7.3 | S |
| 13 Jun 2008 | 6.7 | S |
| 18 Jun 2008 | 5.5-5.8 | S, SE, and NE |
| 22 Jun 2008 | 5.5-7.6 | S, SE, NE |
| 26 Jun 2008 | 5.5-6.1 | NE |
| 07 Jul 2008 | 5.5-5.8 | NE |
| 09-10 Jul 2008 | 5.5-5.8 | E |
| 15 Jul 2008 | 5.5-5.8 | E |
According to the ash advisories issued from the Buenos Aires VAAC, the aviation warning color code for Ubinas during the reporting period was variously orange or red. In terms of hazard status on the ground, a news article on 30 June 2008 indicated that local civil defense officials had maintained the Alert level at Yellow. They noted that small explosions and ash-and-gas emissions had continued during the previous two months. Families at immediate risk from the village of San Pedro de Querapi in the vicinity of the volcano have been relocated but have returned to their fields to pursue their agacultural activities. The population of local communities and their livestock had suffered the effects of gas and ash emissions, and local authorities had begun to discuss the possible relocation of about 650 affected families from six towns (Escacha, Tonoaya, San Migues, San Pedro de Querapi, Huataga and Ubinas). The article noted that officials recognized that the relocation process could take several years and should be the villager's decision and not one forced on them.
Information Contacts: Instituto Geológical Minero y Metalúrgico (INGEMMET), Av. Canadá 1470, San Borja, Lima 41, Perú (URL: http://www.ingemmet.gob.pe/); Buenos Aires Volcanic Ash Advisory Center (VAAC), Argentina (URL: http://www.smn.gov.ar/vaac/buenosaires/productos.php); La República Online (URL: http://www.larepublica.com.pe).
Frequent ash plumes between July 2008 and August 2009
Eruptions at Ubinas between March 2006 and July 2008 caused ashfall in local villages and damaged crops (BGVN 31:03, 31:05, 31:10, 33:01, 33:06). Families from the village of San Pedro de Querapi had been relocated, however they returned to their fields to pursue their agricultural activities. Local authorities have discussed the possible relocation, over several years, of about 650 families from six towns (Escacha, Tonoaya, San Migues, San Pedro de Querapi, Huataga and Ubinas).
Persistent fumarolic plumes continued through 2008 (figure 15) along with intermittent ash explosions (figure 16). Pilot reports and satellite imagery resulted in frequent aviation warnings of ash plumes (table 5) during July-November 2008, January-March 2009, and May-August 2009. It is likely that additional explosion plumes were not observed; for example, a dark ash plume on 8 January 2008 (figure 16) was not previously reported. Most plumes rose a short distance above the summit, although a few went to about 10 km altitude (4.4 km above the summit), including one on 15 March 2009 (figure 17).
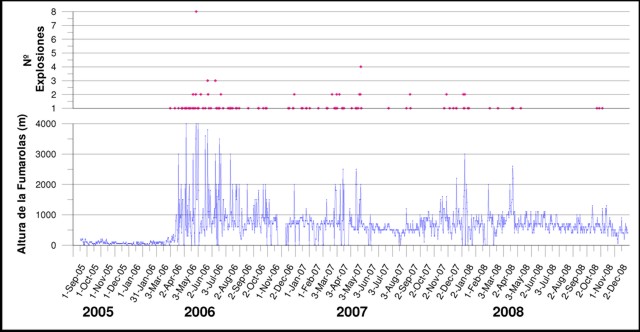 |
Figure 15. Volcanic activity at Ubinas, September 2005 through 2 December 2008. Courtesy of Instituto Geologico Minero y Metalurgico (INGEMMET) report of June 2009. |
Table 5. Compilation of Volcanic Ash Advisories for aviation from Ubinas during 23 July 2008 through 23 August 2009. All reported plumes were reported as ash-bearing unless otherwise noted. Altitudes are approximate; note that the summit is above 5.6 km elevation. Courtesy of the Buenos Aires Volcanic Ash Advisory Center (VAAC) and the Instituto Geológical Minero y Metalúrgico (INGEMMET).
| Date | Plume altitude (km) | Plume direction | Remarks |
| 23 Jul 2008 | 5.5-5.8 | SE | -- |
| 18 Aug 2008 | 5.5-6.4 | W | Pilot report |
| 26-27 Aug 2008 | 5.5-6.1 | N | Satellite imagery, pilot report |
| 02 Sep 2008 | 5.5-6.1 | S | Satellite imagery, pilot report |
| 05-06 Sep 2008 | 5.5-6.4 | NE, SE | -- |
| 10, 13-15 Sep 2008 | 5.5-10.1 | SW, S, SE,NE | -- |
| 17 Sep 2008 | 10.1 | NE | -- |
| 18 Sep 2008 | 5.5-6.4 | -- | -- |
| 30 Sep 2008 | 5.5-8.8 | SSE | -- |
| 01-03 Oct 2008 | 5.5-6.1 | N, NE | -- |
| 11-13 Oct 2008 | 5.5-7.0 | SE, W | -- |
| 15-21 Oct 2008 | 4.9-7.0 | SE, NW | -- |
| 22 Oct 2008 | 5.5-6.7 | S | -- |
| 31 Oct 2008 | 5.5-6.7 | E | -- |
| 30 Nov 2008 | 5.5-6.1 | SW | -- |
| 05 Jan 2009 | 5.5 | SE | -- |
| 11 Jan 2009 | 7.3 | NE | -- |
| 31 Jan 2009 | 6.7 | SW | -- |
| 11-16 Feb 2009 | 5.7-6.5 | NE, N, W, SW | Steam, steam-and-ash |
| 23 Feb 2009 | 6.2-7.6 | S | -- |
| 04 Mar 2009 | 5.8 | SW | -- |
| 11-12 Mar 2009 | 5.5-7.3 | NE | -- |
| 15 Mar 2009 | 9.1-9.8 | -- | -- |
| 18 Mar 2009 | 7.9 | -- | Pilot report |
| 15-19 May 2009 | 5.5-7.6 | SW, NW, SSE | Pilot report |
| 20 May 2009 | 5.3 | NE | -- |
| 25 May 2009 | -- | -- | Two explosions (news report) |
| 29, 31 May 2009 | 5.5-6.7 | NE, SW | -- |
| 01 Jun 2009 | -- | -- | Blue gas plume with some ash |
| 02 Jun 2009 | 0.9-1.5 | E | Explosion, gas-and-ash plume |
| 05-06 Jun 2009 | 6.1-7.9 | W, SW, S | Satellite imagery, pilot report |
| 09 Jun 2009 | 6.1-7.6 | NE | Satellite imagery |
| 11 Jun 2009 | 5.5-7.9 | NE, E, SE | Satellite imagery |
| 13 Jun 2009 | 6.7 | SE | No satellite confirmation |
| 14 Jun 2009 | 7.6 | E | GOES-12 satellite imagery |
| 15 Jun 2009 | 7.9 | NE | Satellite imagery |
| 04 Jul 2009 | 6.7-9.1 | NE | -- |
| 06, 15, 23 Aug 2009 | -- | -- | No satellite confirmation |
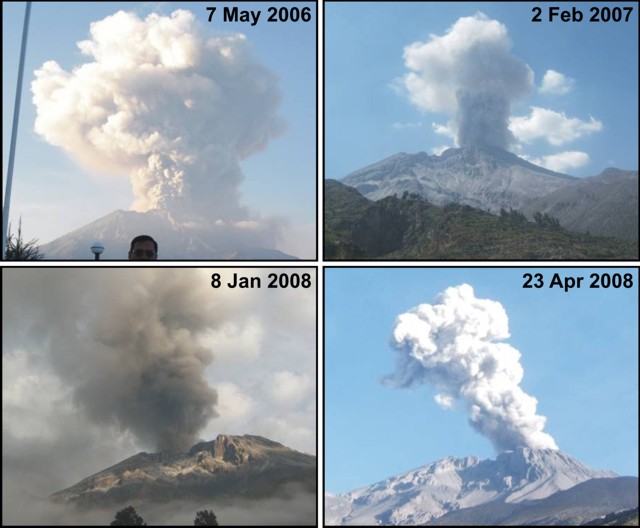 |
Figure 16. Photographs of explosions at Ubinas, 2006-2008. Courtesy of INGEMMET. |
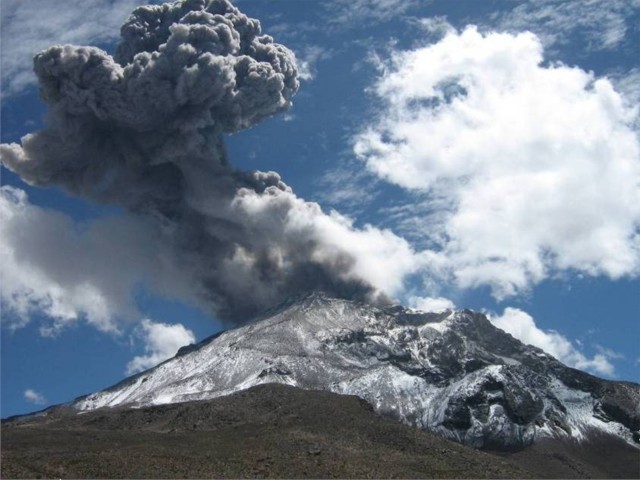 |
Figure 17. Photograph of an ash explosion on 15 March 2009 at 1156. Photo taken by R. Amache, courtesy of INGEMMET. |
Information Contacts: Instituto Geológical Minero y Metalúrgico (INGEMMET), Av. Canadá 1470, San Borja, Lima 41, Perú (URL: http://www.ingemmet.gob.pe/); Buenos Aires Volcanic Ash Advisory Center (VAAC), Argentina (URL: http://www.smn.gov.ar/vaac/buenosaires/productos.php); La República Online (URL: http://www.larepublica.com.pe/).
Explosions during 1-7 September 2013 produce ash plumes
During 2008 through August 2009 Ubinas emitted persistent fumarolic plumes and had intermittent ash explosions (BGVN 35:04). This activity led to frequent aviation warnings. The current report discusses a phreatic eruption during 1-7 September 2013 that included nine explosions. The location of Ubinas, the most active volcano in Peru, is shown in figure 18.
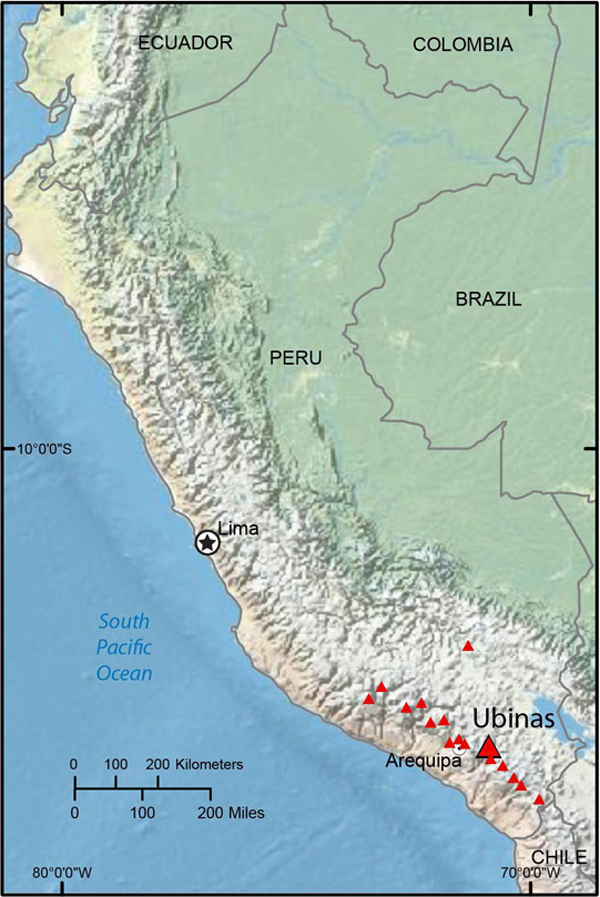 |
Figure 18. Map of Peru showing the location of Ubinas. Courtesy of USGS. |
Between the beginning of September 2009 and the end of August 2013, the Buenos Aires Volcanic Ash Advisory Center (VAAC) reported two additional ash plumes in aviation warnings on 18 July 2010 and [11 July 2013]. According to a pilot report, the [11 July 2013] plume rose to an altitude of 5.5 km and drifted W; however, no ash was detected in satellite images amid clear conditions. The IGP did not report any increase in the earthquake number on 4 July, but indicated that the seismic energy liberated increased significantly on that date, from about 24-58 megajoules during 1-3 July to 74 megajoules before decreasing to 37 on 5 July and remained between 5 and 22 megajoules through 15 July 2013.
The Instituto Geofísico del Perú (IGP) and the Observatorio Volcanológico del INGEMMET (OVI-INGEMMET) reported that a phreatic eruption at Ubinas beginning 1 September 2013 included nine explosions (figure 19). According to a news account (The Raw Story) seismologist Victor Aguilar of the Geophysical Institute of the University of San Agustin de Arequipa told the Agence France-Presse that the first explosion was strong and was followed by a series of lesser blasts. Most of the explosions generated ash plumes that rose 1.5 2 km above the crater. A brief description of the explosions is presented in table 6. IGP monitors Ubinas continuously with a network of four telemetered stations. Figure 20 shows the fourth explosion, seen on 3 September 2013.
Table 6. Description of the explosions at Ubinas during 1-7 September 2013, and another ash emission on 22 October 2013. MJ is megajoules. ND is not determined as of 27 September. Courtesy of IGP and OVI INGEMMET.
| Explosion | Date and local time | Energy (MJ) | Duration (sec) | Comments |
| 1 | 1 Sep, 2246 | 1765 | 110 | Ballistics up to 2 m in diameter ejected, minor ashfall 2 km ENE. |
| 2 | 2 Sep, 1552 | 666 | 292 | Fewer ballistics than first explosion. Large gas and ash plume to 2 km above crater. |
| 3 | 2 Sep, 2350 | 122 | 279 | Ash plume |
| 4 | 3 Sep, 0809 | 139 | 296 | Gas and ash plume up to 2 km above crater; minor ashfall >40 km NW affected small towns. |
| 5 | 3 Sep, 1021 | 58 | 288 | Gas and ash plume to 1.6 km above crater |
| 6 | 3 Sep, 1029 | 313 | 74 | Gas and ash plume to 1.6 km above crater |
| 7 | 4 Sep, 1807 | 505 | 350 | -- |
| 8 | 5 Sep, 1620 | 191 | 321 | -- |
| 9 | 7 Sep, 1036 | ND | ND | -- |
| 10 | 22 Oct | ND | ND | Non-explosive gas-and-ash emissions |
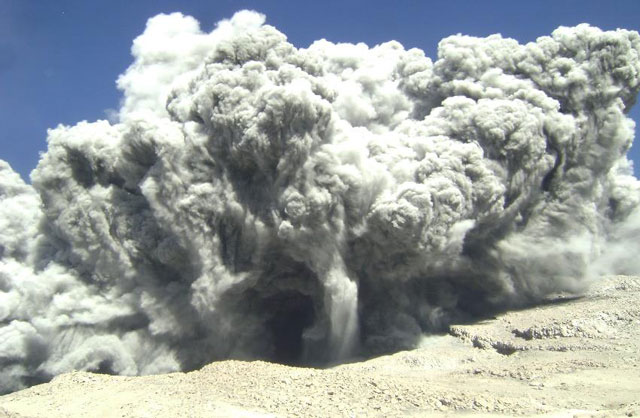 |
Figure 19. Photo showing the gas and ash plume from Explosion 2 of the phreatic eruption at Ubinas, which was taken on 2 September 2013. Courtesy of IGP and OVI-INGEMMET. |
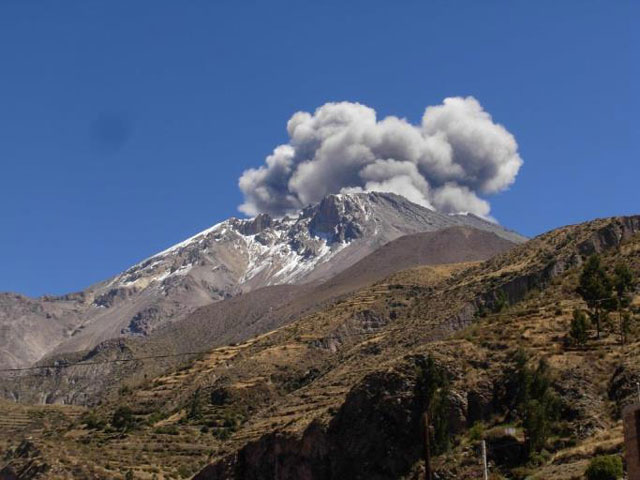 |
Figure 20. Photo of Explosion 4 of the phreatic eruption at Ubinas, taken on 3 September 2013. Courtesy of IGP and OVI INGEMMET. |
Sulfur dioxide (SO2) concentrations were measured with a mini-DOAS spectrometer, shortly after Explosion 4; the average SO2 concentration was 155 metric tons/day.
According to a news account (Phys.org), on 12 September 2013, Peru declared a state of emergency in nine districts threatened by the toxic gases and ash spewing from Ubinas. Authorities were distributing masks and have given themselves a 60 day period to relocate villagers from areas where ash is damaging crops and polluting water sources.
Information Contacts: Buenos Aires Volcanic Ash Advisory Center (VAAC), Servicio Meteorológico Nacional Fuerza Aérea Argentina, 25 de mayo 658, Buenos Aires, Argentina (URL: http://www.smn.gov.ar/vaac/buenosaires/productos.php); Instituto Geofísico del Perú (IGP) (URL: http://www.igp.gob.pe); Instituto Geológical Minero y Metalúrgico (INGEMMET), Av. Canadá 1470, San Borja, Lima 41, Perú (URL: http://www.ingemmet.gob.pe/);
USAID USGS Volcano Disaster Assistance Program (VDAP) (URL: http://volcanoes.usgs.gov/vdap/); phys.org (URL: phys.org); and The Raw Story (URL: www.rawstory.com).
Intermittent explosions through November 2014; ashfall causes evacuations April-June 2014
Ubinas is an active stratovolcano in southern Peru about 70 km E of the city of Arequipa. Although Holocene lava flows cover its flanks, the historical record, which extends back to the mid-1500's, contains evidence of about 20 minor explosive eruptions. In March 2006 ash eruptions began that continued through August 2009. Numerous explosions produced ash plumes rising to 6-9 km in altitude, along with volcanic bombs ejected up to 200 m from the crater (BGVN 31:10). Around 2,000 residents were evacuated from nearby communities in the valley SE of the volcano where most of the ash and debris was directed (figure 21).
Phreatic explosions were again reported by Instituto Geofísico del Perú, Observatoria Vulcanologico del Sur (IGP-OVS) and the Observatorio Volcanológico del INGEMMET (Instituto Geológical Minero y Metalúrgico) (OVI-INGEMMET) beginning 1 September 2013. A series of nine explosions between 1 and 7 September 2013 sent ash plumes to 2 km above the crater and ejected volcanic bombs up to 2 m in diameter. This report details activity at Ubinas from October 2013 through the end of 2014 with information provided by IGP-OVS, OVI-INGEMMET and the Buenos Aires VAAC (Volcanic Ash Advisory Center).
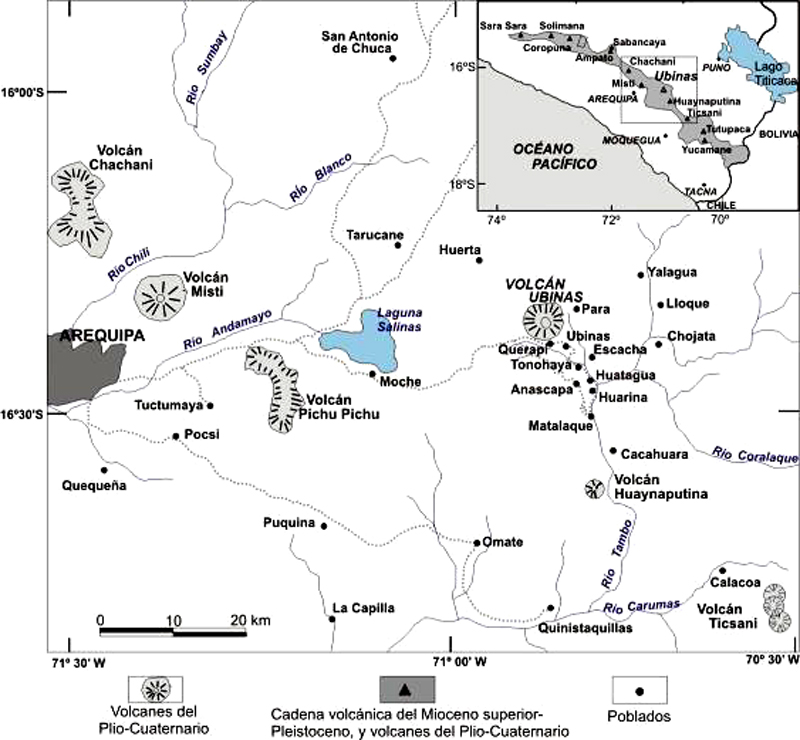 |
Figure 21. Location of Volcan Ubinas and communities around the volcano. The communities SE of the volcano in the Ubinas Valley are the ones most often affected by ashfall from the ash explosions. Courtesy of OVI-INGEMMET and IGP-OVS (2013 Ubinas Report 16). |
Elevated seismic signals continued in October 2013 and January 2014. Explosion and ashfall frequency began to increase in February and March; explosions in April and May sent ash plumes as high as 5,000 m above the crater (altitudes up to 10.6 km). Extrusion of lava was witnessed by geologists in March, and thermal anomalies and seismic evidence in April suggested hot material still at the surface. Ashfall, up to several millimeters thick, was deposited across the region numerous times between April and September 2014, generally S and E of the volcano in villages up to 15 km away, and as far as 40 km on one occasion. Volcanic bombs were ejected as far as 2.5 km from the crater on a few occasions, but did not cause damage in neighboring communities. Activity noticeably declined in October 2014 and the final explosion on 23 November 2014 sent ash plumes to 2,500 m above the crater.
Activity during October 2013-March 2014. After the explosive events of early September 2013, Ubinas was relatively quiet except for a minor 2-minute-long non-explosive seismic signal that likely produced gas-and-ash emissions on 21 October 2013. Activity decreased noticeably through December 2013 but then picked up again in January 2014 with an abrupt increase in the number of LP (long-period) seismic events to 44 in the first days of January and an increase in "tornillo"-type seismic events with an emission on 23 January. Swarms of several tens of earthquakes were recorded on 8, 9, 17 and 25 January leading up to three ash-emission events on 1 and 2 February. IGP-OVS reported that the ash plumes on 1 and 2 February rose to 2 km above the crater (7.6 km altitude) and drifted E and SE. The towns of Querapi and Ubinas (4-6 km SE) received very light ashfall from these events. The number of LP earthquakes increased dramatically to more than 1,200 events in the first seven days of February. IGP reported that exhalation was nearly continuous until 8 February, after which seismic activity decreased significantly. Bluish gas emissions were sporadic during 8-11 February, and a phreatic explosion on 14 February generated a water vapor, gas, and ash plume that rose 1 km above the crater.
Volcanologists visited the crater during 1-2 March and observed a new 30-40 m elongated body of incandescent lava emitting bluish gas. On another visit on 19 March 2014, the lava was photographed covering the 120 m wide crater floor (figure 22).
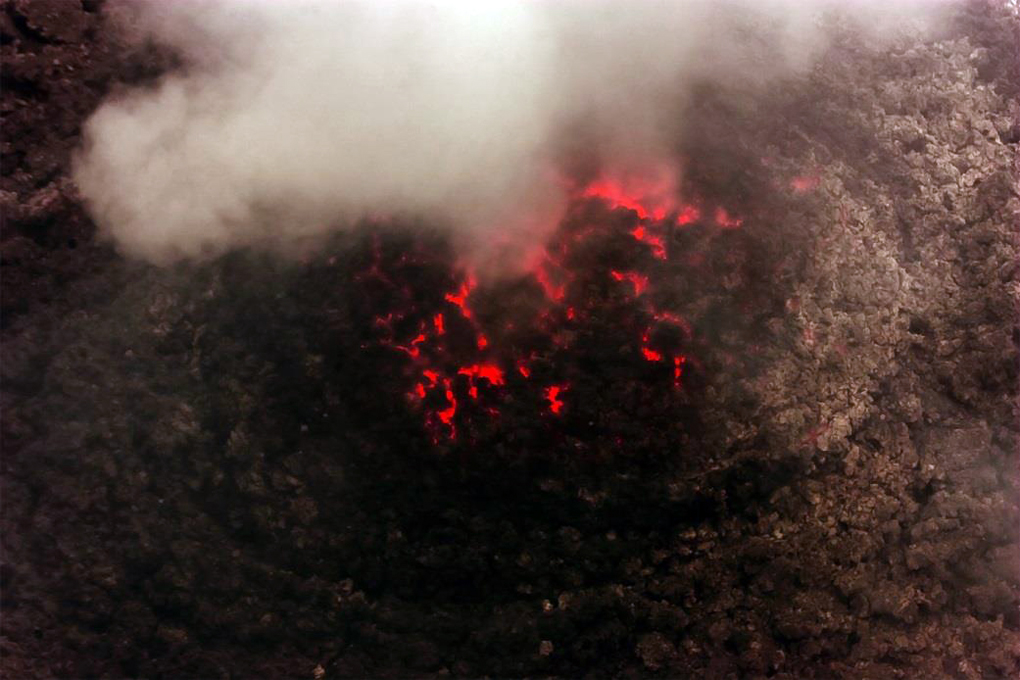 |
Figure 22. Newly erupting lava covering the 120-m-wide floor of the inner crater atop Ubinas on 19 March 2014. Courtesy of IGP-OVS (2014 Ubinas Annual Report). |
Buenos Aires VAAC reports of ash emissions increased significantly in March 2014, with reports of emissions on 13 different days. Diffuse plumes were repeatedly observed drifting in many directions up to 1.7 km above the crater. Ashfall was reported on 25, 27, and 31 March in nearby villages including Ubinas, Querapi, and Tonohaya (7 km SSE), and noises from the volcano were audible around the community of Ubinas. Seismic signals of "hybrid" type, associated with the flow of magma inside the volcano, increased in late March. IGP-OVS also reported MIROVA thermal anomalies that indicated the presence of lava at the surface continuing into early April 2014.
Activity during April 2014-September 2014. Nearly continuous explosive activity characterized events during April 2014, with tens of explosions reported daily and increasing amounts of energy released from seismic events. Early in the month ash plumes were rising almost daily 2-3 km above the volcano, but the height increased to 4.5 km by 15 April and then 5 km above the crater (10.6 km altitude) in the largest explosion on 19 April. Variations in different kinds of seismic activity throughout the month reflected the large amount of energy released during both explosive activity and the eruption of lava (figure 23). Thermal anomalies were captured from MODIS satellite data and reported by the MODVOLC thermal alert system seven times during the first two weeks of April.
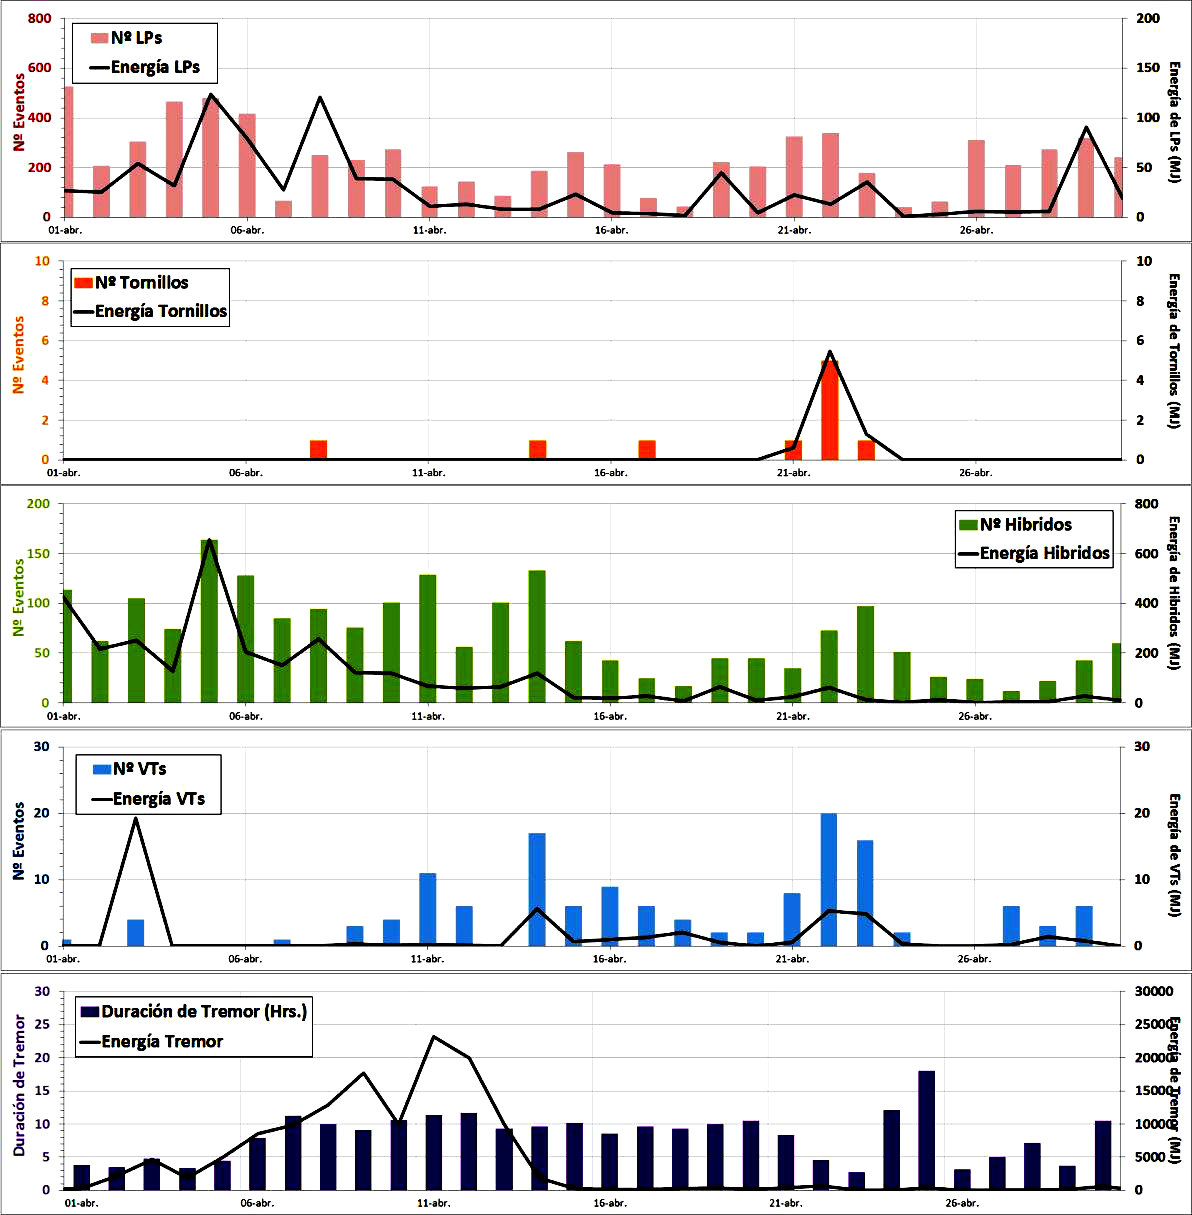 |
Figure 23. Increases in different types of seismicity were observed at different times throughout April 2014 at Ubinas, when vigorous explosive activity occurred. LP events (top graph) are generally interpreted as associated with increased ash emissions. "Tornillo" events (second graph) are associated with a buildup of pressure, and can correlate with subsequent high explosive activity. Hybrid events (third graph) are interpreted as related to the rise of magma inside the volcano, and thus often reflect subsequent extrusive lava flow activity. VT events (fourth graph) are associated with subsurface rock fracturing. Long stretches of time with lengthy durations of tremors (fifth graph) tend to release much of the internal energy built up inside the volcano. Courtesy of IGP-OVS (2014 Ubinas Annual Report). |
Ashfall occurred in local communities many times in April. The towns of Ubinas and Querapi (4-6 km SE) reported ash every week. During the largest explosions from 15-22 April, ash in Querapi was reported up to 1 mm thick, and a trace was recorded in Ubinas. Ash also fell in multiple areas in almost all directions, but was most concentrated to the SE, S, and SW; additional towns affected included Escacha (7 km SE), Tonohaya (8 km SE), San Miguel (10 km SE), Huatagua (14 km SE), Matalaque (17 km SE), Chojata (19 km ESE), Omate, (37 km SSW) and even Quinistaquillas (44 km S).
On 18 April a significant gas-and-ash emission was accompanied by the ejection of incandescent bombs that landed up to 2 km from the crater. Explosions on 19 and 22 April also ejected incandescent tephra, 20-30 cm in diameter, up to 2.5 km away from the crater. Residents and livestock in Tonohaya and Querapi were evacuated during the month. After 21 April, the size of the explosions began to decrease, although significant explosions still deposited ash in villages within about 8 km of the volcano during the rest of the month.
Sulfur dioxide emissions were notable in Aura/OMI satellite data between 15 and 18 April 2014 (figure 24). A maximum value of 4.3 kT was captured on 17 April. They continued at levels approaching 1,000 tons per day intermittently through September; villages downwind reported strong sulfur odors. On 26 April a team of IGP-OVS scientists mapped the sites of the volcanic bombs from the eruptions on 19 April and observed craters 2-4 m in diameter.
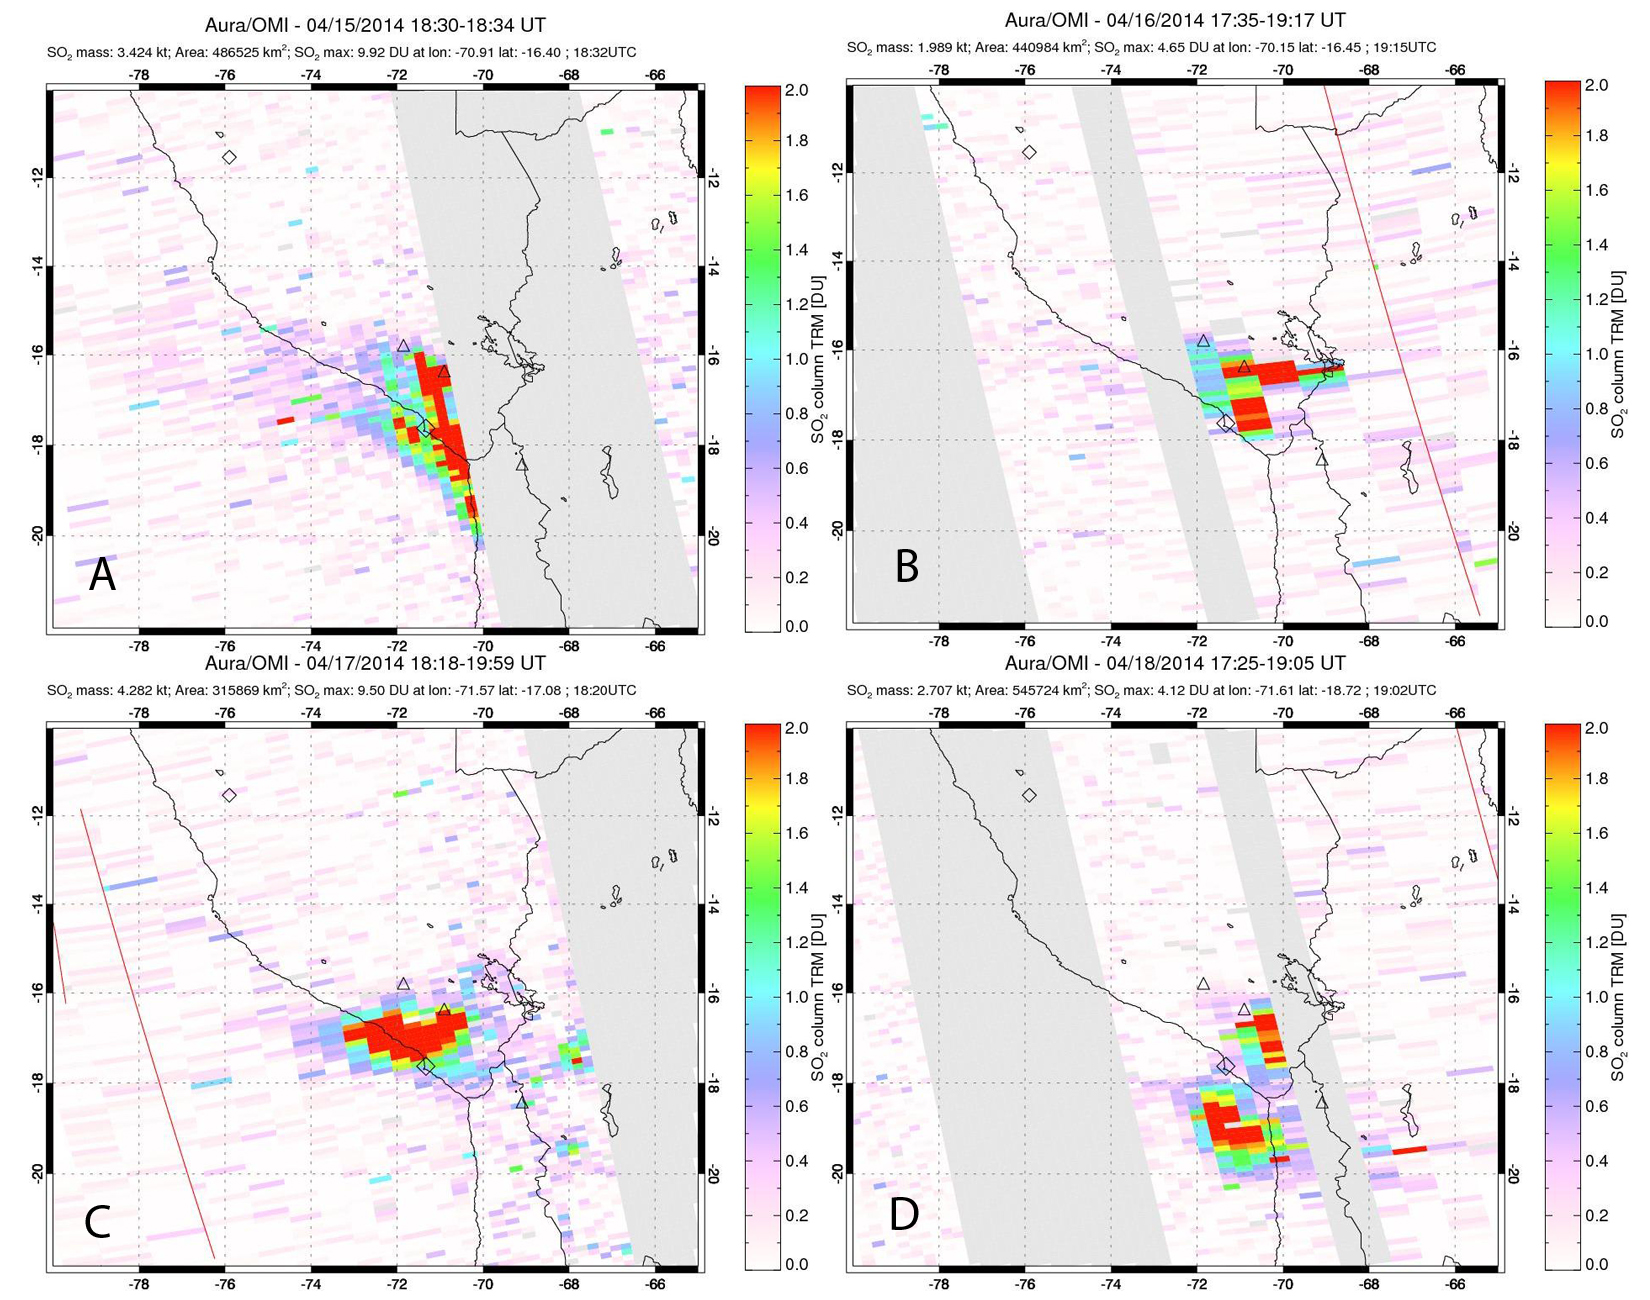 |
Figure 24. Images of SO2 emissions at Ubinas from the OMI instrument on the NASA Aura satellite between 15 and 18 April 2014. Ubinas is the triangle closest to Lake Titicaca. Emission dates and masses shown are as follows: A) 15 April, 3.42 kT; B) 16 April, 1.99 kT; C) 17 April, 4.28 kT; D) 18 April, 2.71 kT. Courtesy of NASA GSFC. |
Early May explosions had ash plumes rising to 3 km or less above the volcano and drifting S and E to Querapi (4 km S), Ubinas (6.5 km SSE), Escacha (7 km SE), Anascapa (10 km SE), San Miguel (10 km SE), and Lloque (17 km E). Explosions with ashfall continued throughout May. Plumes generally rose to 3 km or less above the crater (up to 8.5 km altitude). The ashfall was generally reported within 10 km of the volcano. The wind scattered the ash in almost all directions; however, the largest deposits were located in the E and SSW, which measured up to 3-4 mm of ash in some areas, up to 6 km from the crater.
While the energy released was lower overall in June, frequent explosive events continued, with numerous ash emissions lasting from tens of minutes to hours. During 2-3 June large plume heights up to 5 km above the summit were again reported based on webcam images and pilot reports. Ashfall continued to affect areas around the volcano several days per week, especially within 6 km E and SSW. On 30 June an explosive event sent incandescent lava fragments 1,500 m NW from the crater. This was preceded by an increase in intensity of 'hybrid' earthquakes.
The most significant event in July was an explosion on 17 July that sent an ash column 5,000 m above the crater to 10.7 km altitude (figure 25), drifting SE and scattering fine ash in the villages of Ubinas and Escacha (6-8 km SE). Incandescent blocks were also ejected onto the flanks. Numerous other smaller explosions regularly sent ash plumes to 2-3 km above the summit, with ashfall in the Ubinas valley to the SE.
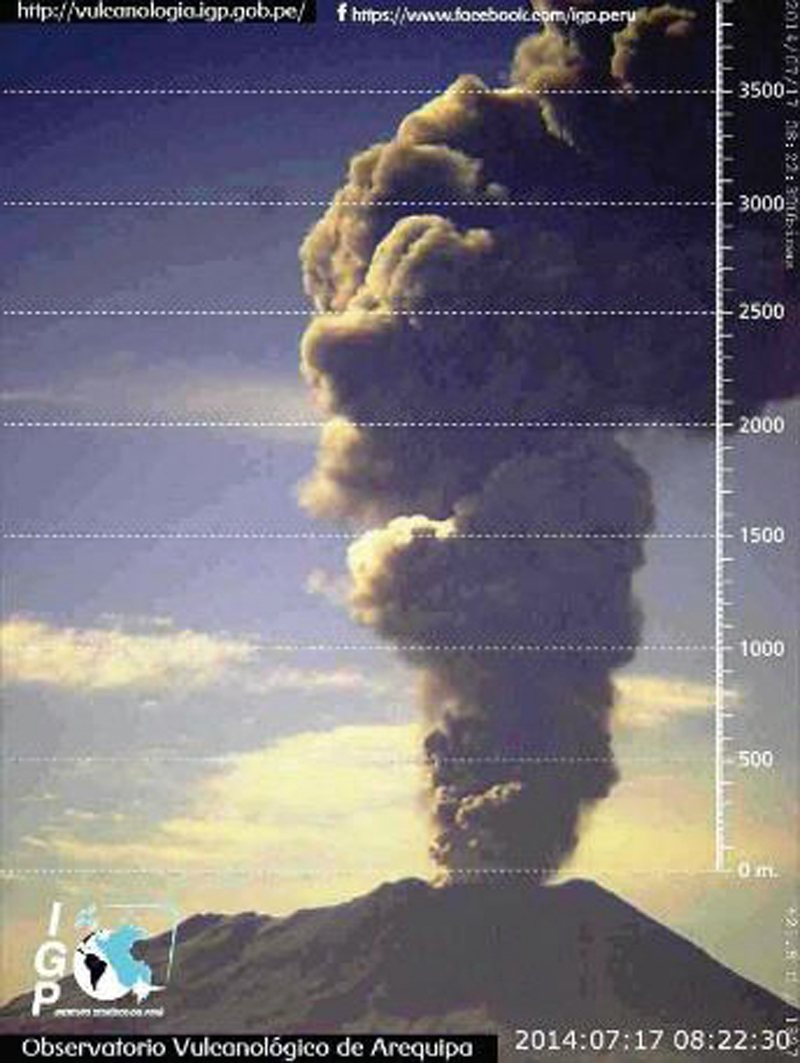 |
Figure 25. An explosion at Ubinas on 17 July 2014 at 0814 local time sent an ash plume 5,000 m above the summit, releasing an energy of 55.3 Megajoules. Courtesy of IGP-OVS (2014 Ubinas Annual Report). |
Sharp declines in seismic tremors were observed in early August 2014; fewer explosions were recorded than in previous months. The largest explosion sent a plume to 4,200 m above the crater, drifting S and SE on 21 August, and sent bombs 2 km onto the S flank. It was heard 10 km from the volcano and caused minor ashfall up to 10 km S and E. Other ash emissions during the month rarely exceed 1,200 m above the crater. Tremor activity increased between 22 and 29 August, associated with persistent ash emissions. Explosions of lesser energy were typical in early September with the highest plume reported on 11 September at 3,000 m above the crater. As ash emissions decreased in late September, steam plumes rising 300 m above the crater were regularly observed. Explosions on 21 and 22 September sent ash columns to 1,300 m above the crater. In the last week of September, small intermittent ash-and-gas emissions rose less than 400 m above the crater.
Activity during October 2014-December 2014. With the exception of an event on 23 October 2014 where a small amount of ash was observed rising to 800 m, emissions were primarily steam rising 300 m or less this month. Between 31 October and 11 November IGP-OVS reported an increase in emissions of steam and ash, some rising to 3,000 m above the crater and drifting S, N, and NE. VT seismic events also increased during this period. The highest steam and ash emissions in mid-November were recorded at 1,600 m above the crater, and drifted both N and S. On 23 November two explosive events released ash plumes that rose 2.5 and 2.2 km above the crater and drifted S and SE. These were the first explosions since 21 September, and were observed by IGP-OVS geophysical staff doing fieldwork. They were also the last explosions of 2014.
An increase in the number of hybrid-type seismic events was noted in December 2014, and also a brief spike in "tornillo" events, but no explosive ash-bearing emissions were reported; however, hybrid seismic event counts were lower compared to earlier in the year (figure 26). When the crater was inspected by IGP-OVS scientists on 15 December, there was no visible magma on the surface. A large increase in LP seismic events was recorded on 26 December.
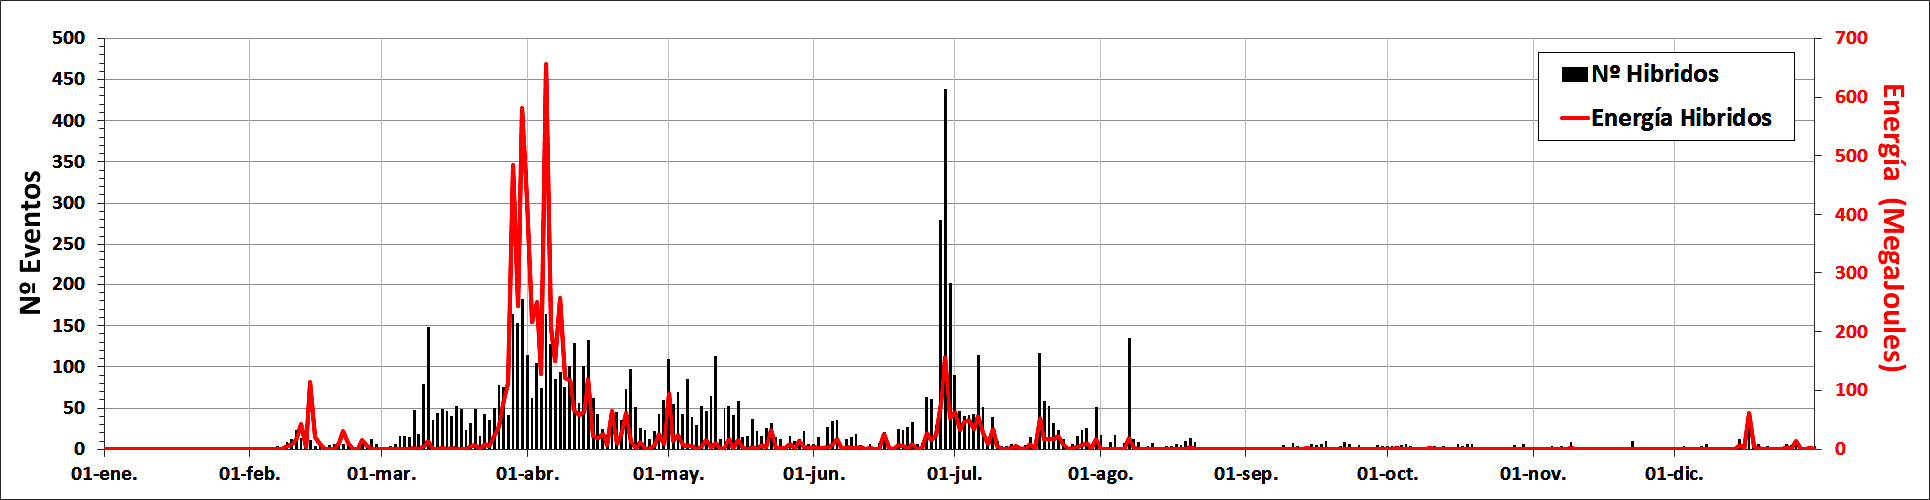 |
Figure 26. Evolution of hybrid-type seismic events in 2014 at Ubinas. The graph clearly shows that the largest episode of activity in the current eruptive cycle occurred during April 2014. Several thermal anomalies were also recorded during early April suggesting the rise of magma to the surface. Courtesy of IGP-OVS (2014 Ubinas Annual Report). |
Information Contacts: Instituto Geofisico del Peru, Observatoria Vulcanologico del Sur (IGP-OVS), Arequipa Regional Office, Urb La Marina B-19, Cayma, Arequipa, Peru (URL: http://ovs.igp.gob.pe/); Observatorio Volcanologico, Instituto Geológical Minero y Metalúrgico (OVI-INGEMMET), Barrio Magisterial Nro. 2 B-16 Umacollo - Yanahuara Arequipa (URL: http://ovi.ingemmet.gob.pe); Buenos Aires Volcanic Ash Advisory Center (VAAC), Servicio Meteorológico Nacional-Fuerza Aérea Argentina, 25 de mayo 658, Buenos Aires, Argentina (URL: http://www.smn.gov.ar/vaac/buenosaires/productos.php); MIROVA, a collaborative project between the Universities of Turin and Florence (Italy) supported by the Centre for Volcanic Risk of the Italian Civil Protection Department (URL: http://www.mirovaweb.it/); Hawai'i Institute of Geophysics and Planetology (HIGP), MODVOLC Thermal Alerts System, School of Ocean and Earth Science and Technology (SOEST), Univ. of Hawai'i, 2525 Correa Road, Honolulu, HI 96822, USA (URL: http://modis.higp.hawaii.edu/); NASA Goddard Space Flight Center, Global Sulfur Dioxide Monitoring Page, Atmospheric Chemistry and Dynamics Laboratory, Goddard, Maryland, USA (URL: https://so2.gsfc.nasa.gov/).
Ash plumes to 8 km during April-October 2015; activity ends in February 2016
Ubinas is an active stratovolcano in southern Peru about 70 km E of the city of Arequipa. Although Holocene lava flows cover its flanks, the historical record, which extends back to the mid-1500's, contains evidence of minor explosive eruptions, debris avalanches, tephra deposits, phreatic outbursts, and pyroclastic flows and lahars. Recently, an extended series of ash eruptions occurred between March 2006 and August 2009. Phreatic explosions were again reported between September 2013 and November 2014 (BGVN 40:12), including large explosions between April and June 2014 that caused ash plumes to rise above 10 km altitude, large SO2 anomalies, evacuations, and several millimeters of ashfall in surrounding villages. This report details subsequent activity from January 2015 through April 2016 with information provided largely by Instituto Geofísico del Perú, Observatoria Vulcanologico del Sur (IGP-OVS), the Observatorio Volcanológico del INGEMMET (Instituto Geológical Minero y Metalúrgico) (OVI-INGEMMET), and the Buenos Aires VAAC (Volcanic Ash Advisory Center).
Minor ash emissions were reported on 15 January, 18-19 February, and 17 March 2015. A more substantial explosion with an ash plume on 8 April was followed by an extensive series of seismic tremors with ongoing ash emissions for several days; several millimeters of ash were deposited in the surrounding villages to the SE, up to 10 km away. Persistent ash emissions continued in May and June 2015, with ashfall in surrounding villages. A large explosion on 25 July ejected ash, lapilli, and bombs, and affected communities 20 km away. Continuous ash emissions in August and September accompanied heightened seismicity. Emissions began to decrease in October, and the last ash emission of the year was reported on 18 November.
Significant MIROVA thermal anomalies were first observed in mid-June and were sporadic through mid-November when they increased and persisted through January 2016. The last explosion was reported on 15 January, although a minor ash emission was reported on 27 February 2016. The seismic energy decreased substantially after 1 March 2016, and IGP-OVS and OVI-INGEMMET reduced the Alert level from Orange to Yellow (on a 4 level scale) on 30 April 2016.
Activity during January-March 2015. Low- to medium-density steam emissions rising to between 500 and 1,100 m above the summit crater floor were typical in January 2015, along with intermittent bluish magmatic gas emissions. OVI-INGEMMET reported blue SO2 emissions on 15 January in their weekly report. In their monthly summary, they referred to 'two light gray emissions with slight ash content' on that day, and a plume height of 1,500 m above the crater. The background level of seismic energy increased after 6 January from about 3 MJ (megajoules) to 25 MJ, according to IGP-OVS weekly reports. OVI-INGEMMET reported three small lahars, one on 21 January in Chiflon ravine and two on 31 January in Volcánmayo creek (SE of the volcano), which caused damage to the road linking the towns of Querapi and Ubinas, a few kilometers SE.
In February 2015, seismicity decreased somewhat according to IGP-OVS weekly reports. Cloudy skies for much of the month prevented detailed observations of emissions which generally rose to heights of 200 to 500 m. Diffuse emissions consisted primarily of water vapor with an occasional bluish SO2 component according to IGP-OVS. The highest emission was 1,000 m on 6 February according to the OVI-INGEMMET monthly report for February; they also reported minor amounts of ash in the emissions from the volcano on 18 and 19 February, but no ashfall in neighboring communities. Two lahars descended drainages on the SE side of the volcano on 6 February and caused damage near Tonohaya (10 km SE) and to the access road to the village; another lahar reported on 13 February in Volcánmayo creek was reported by villagers as 1.6 m deep.
OVI-INGEMMET noted that a villager in Ubinas (6.5 km SSE) reported another lahar on Volcánmayo creek on 7 March 2015. Emissions during March rose to between 400 and 1,500 m above the summit crater, and were low- to medium-density, consisting primarily of water vapor. IGP-OVS reported sporadic ash emissions on the morning of 17 March. There was no associated ashfall in the vicinity. Volcano-tectonic (VT) earthquakes showed an upward trend from the beginning of February into the first week of March. Two main foci were observed, the first located 2 km NW of the crater at depths between 1 and 5 km, the second 1 km W of the crater between 1 and 3 km deep. In the last week of March, the numbers of LP and Hybrid earthquakes each increased 10-fold from the previous week's measurements, and bluish magmatic gas emissions were observed on 30 and 31 March.
Activity during April-June 2015. Strong SO2 odors were reported in Phara (5 km E) at the very beginning of April 2015. The number of LP and Hybrid-type seismic events continued a steady increase that began the third week in March. Pulsing emissions of water vapor and magmatic gases rose to between 500 and 900 m above the summit during the first week in April. On 8 April at 0332 local time IGP-OVS reported a small explosion that initiated a sequence of constant seismic tremors and ash emissions that lasted for 41 hours (figure 27). This was followed by four days (11-14 April) of pulsing ash emissions and seismic tremors. OVI-INGEMMET reported 12 minor explosions between 8 and 12 April during the constant tremors. Very little wind caused the ash column to rise nearly vertically to 2,500 m above the crater. Ash deposits up to 1.5 cm thick were noted in Ubinas (6 km SE), Escacha (10 km SE), and elsewhere in the Ubinas valley (figure 28).
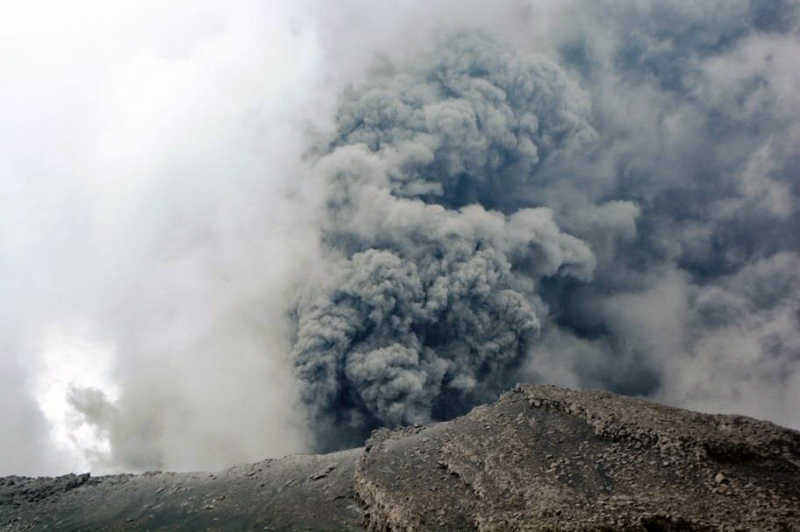 |
Figure 27. IGP-OVS scientists were in the area of Ubinas on the morning of 8 April 2015 when the volcano erupted with a dense ash plume rising over 2,000 m. Courtesy of IGP-OVS (Ubinas Report 16, 8 April 2015). |
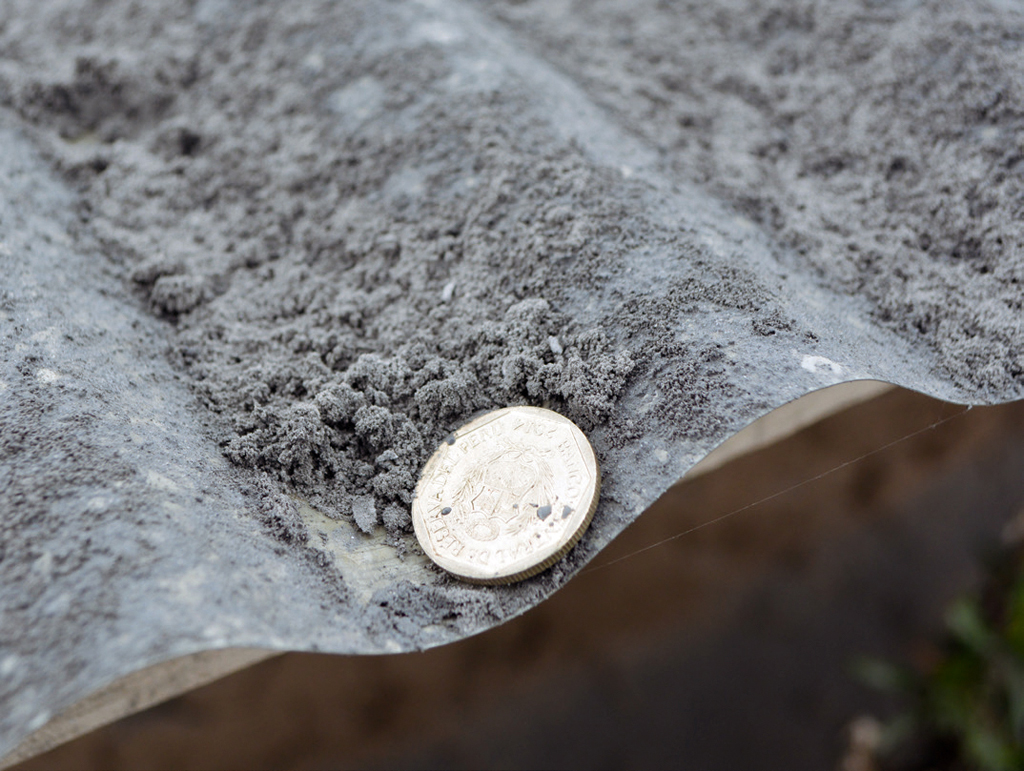 |
Figure 28. Photo of a tin roof in the town of Ubinas (6 km SE of crater), with ash deposits approximately 1.5 mm thick from the 8 April 2015 explosion. Courtesy of IGP-OVS (Ubinas 2015 Annual Report). |
An isopach map of ash thickness from explosions beginning on 8 April was generated by IGP-OVS scientists between 9 and 10 April; they estimated the ashfall at 650,000 m3. In a joint announcement on 10 April, IGP-OVS and OVI-INGEMMET reported that field observations on 8 and 9 April revealed pyroclastic fragments 20-40 cm in diameter in areas 200 m N of the crater. In addition, ash deposit thicknesses were more than 5 cm inside the crater, 3 cm at the edge of the crater, 1 cm above elevations of 4,800 m, and 1 mm in areas 6 km away in Ubinas. Trace ash deposits were observed as far away as Anascapa (10 km SE) (figure 29).
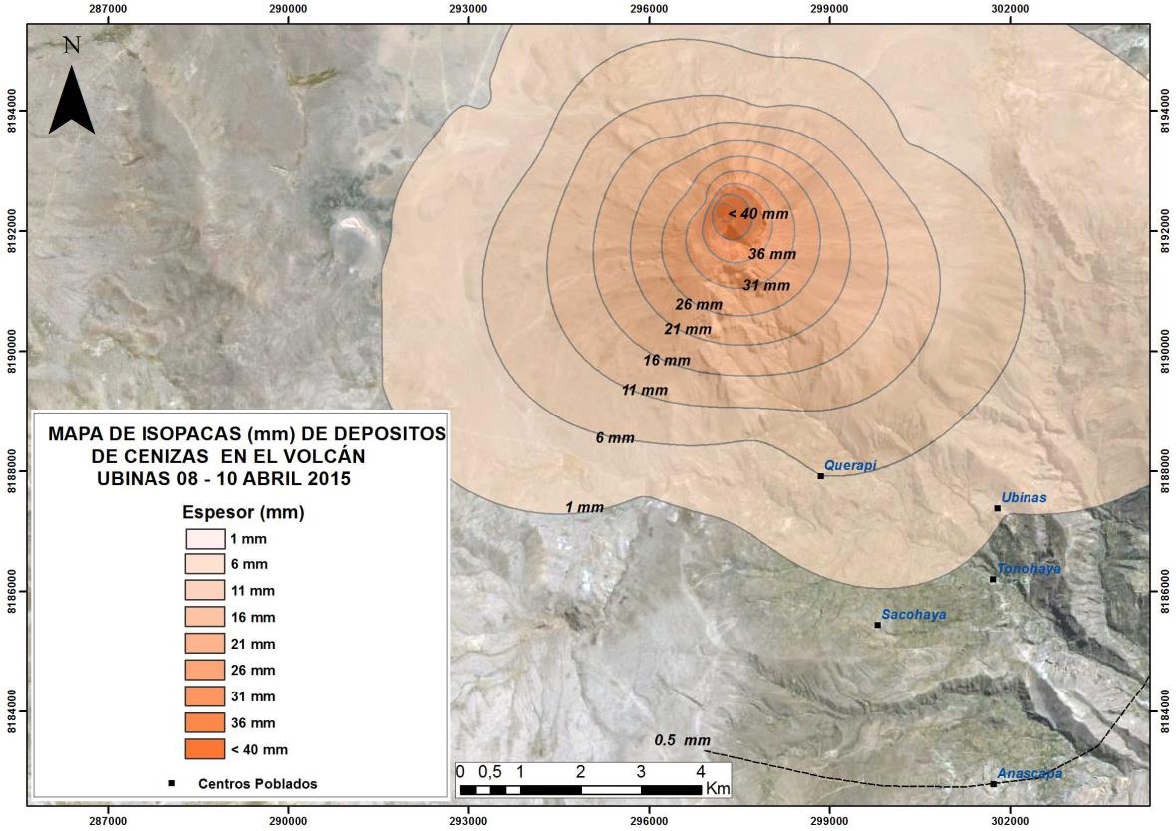 |
Figure 29. Isopach map of ashfall deposit thickness from Ubinas, with information gathered between 9 and 10 April 2015 after an initial explosion on 8 April. The total volume of ash was calculated as 650,000 m3. Courtesy of IGP-OVS (Ubinas Report 17, 14 April 2015). |
In a joint announcement on 17 April, IGP-OVS and OVI-INGEMMET reported six explosions between 12 and 17 April with nearly-constant ash emissions between 1,000 and 3,500 m above the summit crater, and ashfall in the local villages within 15 km. The Buenos Aires VAAC (Volcanic Ash Advisory Center) reported an ash plume on 14 April extending 35-40 km E from the summit at an altitude of 6.4 km, and another plume on 17 April rising to 7.6 km and drifting SE. The largest explosion on 15 April released 24.5 MJ of energy and sent an ash plume 3.5 km above the summit. This series of explosions led the authorities to raise the Alert Level at the volcano to Orange (second highest on a 4-color scale). Ash emissions continued at decreased levels during the third week of April according to both OVI-INGEMMET and IGP-OVS, with plumes not rising beyond 1,000 m above the summit crater; minor ashfall was still reported in nearby villages. Even though no explosions were reported after 20 April, persistent tremors continued at a lower level according to IGP-OVS, while other types of seismicity declined significantly (figure 30) from earlier in April.
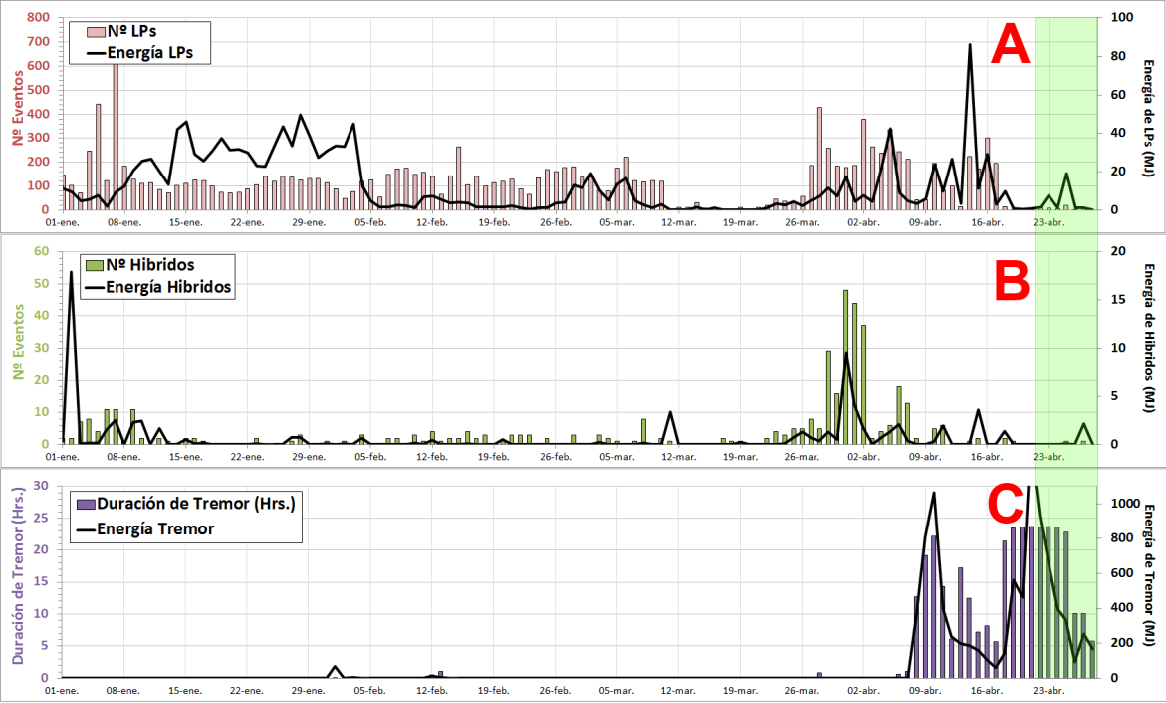 |
Figure 30. Earthquake numbers (color bars) and energy (black line) for major volcanic events recorded by the telemetric station UB1 between 1 January and 28 April 2015 at Ubinas. Courtesy of IGP-OVS (Ubinas Report 19-28 April 2015). |
New lahars descended the Volcanmayo drainage on the S flank during 12-13 April to a distance of 10 km, affecting agricultural land, irrigation canals, and roads as a result of the large volumes of ashfall and abundant snowfall followed by plentiful solar radiation. A video of the 13 April lahar was recorded (www.youtube.com/watch?v=kDdguKyKr4Q) by IGP-OVS.
According to IGP-OVS, ash emissions increased on 1 May 2015, rising to 800 m above the summit. Frequent seismic tremors with increasingly dense, intermittent ash-and-water-vapor plumes rising to between 1,100 and 1,800 m continued into the third week of May. OVI-INGEMMET reported a 1,100 m plume on 11 May that drifted E and NE, causing ashfall in Ubinas, Santa Rosa de Phara, and Eschacha (5-10 km E and S). IGP-OVS scientists visited between 20 and 22 May to conduct geophysical measurements and hold an educational workshop for local authorities. They observed water vapor, gas, and 400-m-high ash emissions during this time (figure 31).
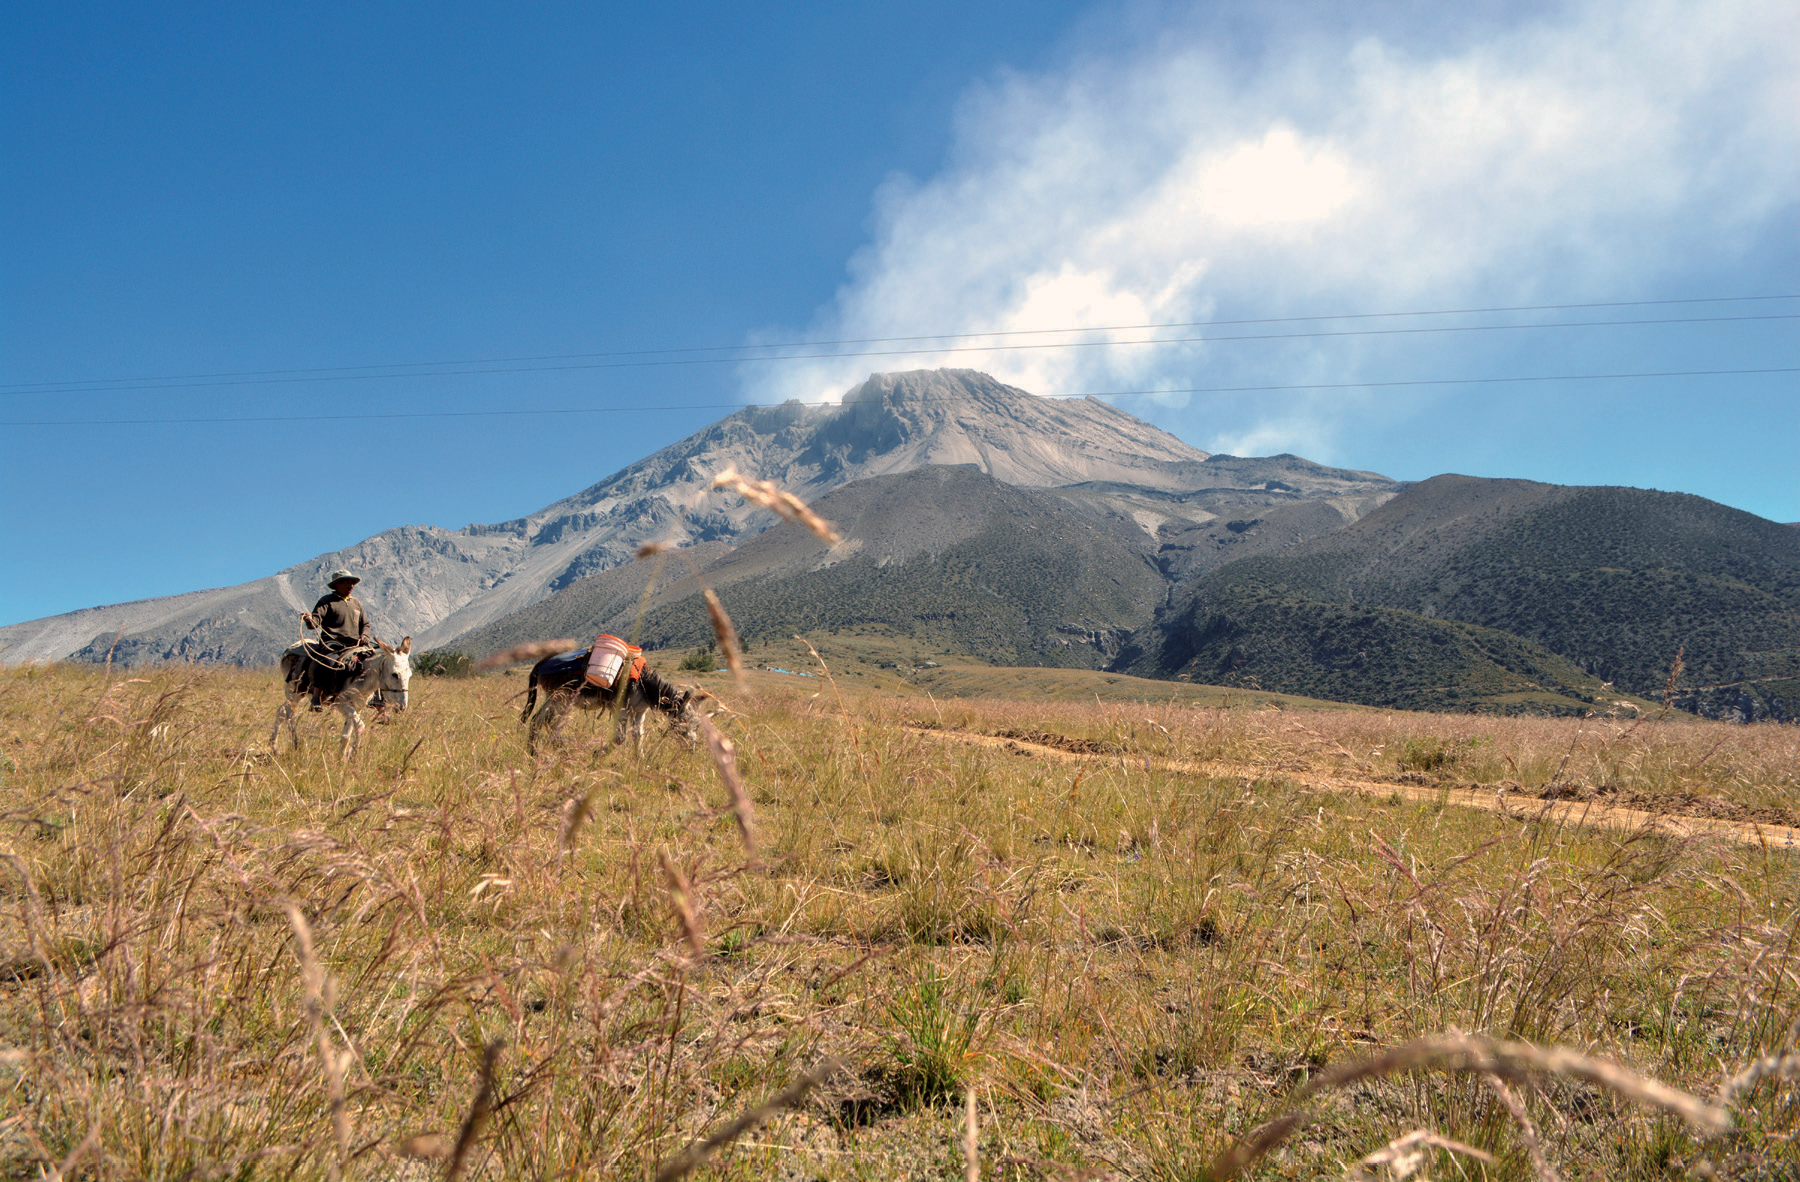 |
Figure 31. Steam-and-gas emissions from Ubinas during an IGP-OVS visit during 20-22 May 2015. Courtesy of IGP-OVS (Ubinas 2015 Annual Report). |
IGP-OVS reported two emissions on 24 May, and a significant increase in VT seismic events on 25 May. The Buenos Aires VAAC reported continuous emissions of steam with diffuse ash rising to an altitude of 6 km (400 m above the summit) and drifting 100 km ENE on 23 May, and emissions to 6.4 km drifting 30 km SE the next day. Additional emissions with bursts of fine ash and bluish gases on 29 and 30 May led to a greater volume of total ash emission than the previous week, although the plumes only rose to 400 m (figure 32).
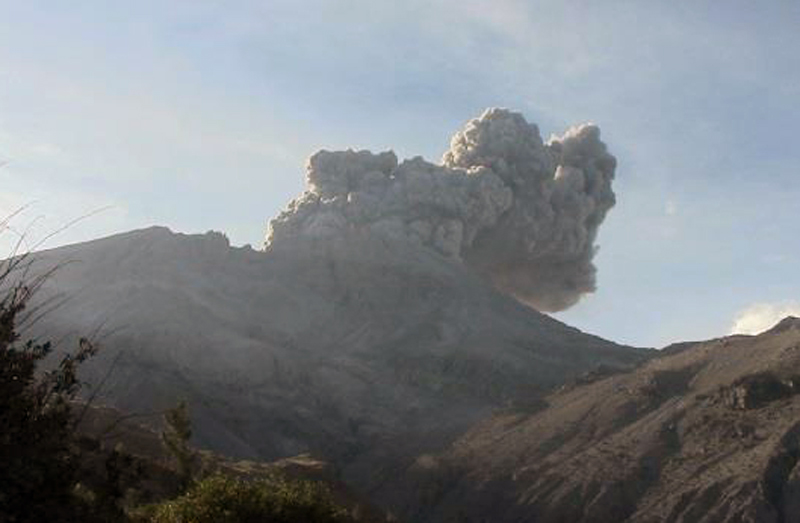 |
Figure 32. Emission of a dense ash plume from Ubinas on 29 May 2015. Courtesy of IGP-OVS (2015 Ubinas Report 24, 2 June 2015). |
Pulsing ash emissions and a sudden increase to 748 LP seismic events were recorded by IGP-OVS on 1 June 2015. VT seismic event frequency was also very high during the first week in June. IGP-OVS reported five ash emission events between 3 and 5 June with plume heights to 1,200 m above the summit. These events were reported by the Buenos Aires VAAC as continuous emissions rising to 7 km and drifting 30 km E. IGP-OVS noted that LP seismic events decreased dramatically from an average of 778 per day in the first week to 62 per day in the second week. In their annual report, IGP-OVS pointed out that a spike in hybrid-type seismic events on 14 June occurred a few hours prior to a thermal anomaly that was recorded by the MIROVA system (figure 33).
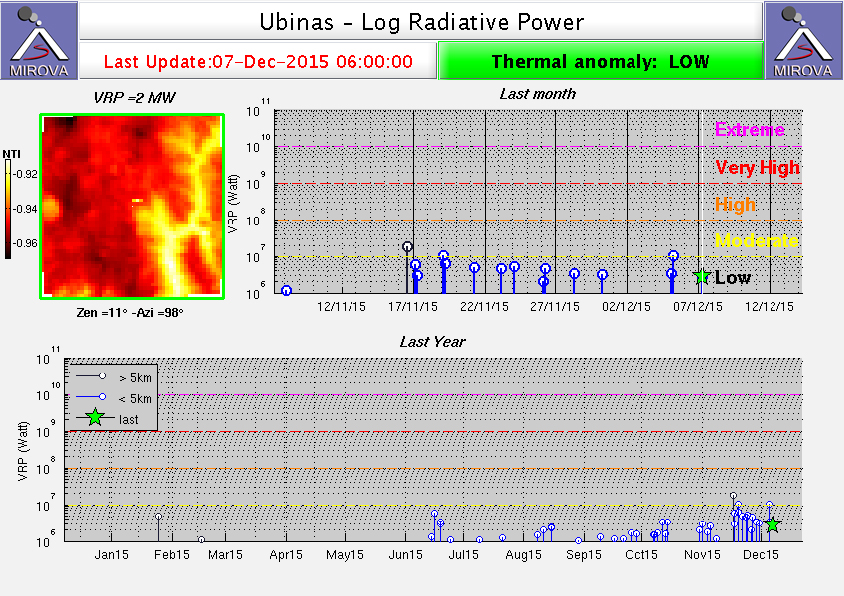 |
Figure 33. MIROVA Log Radiative Power thermal anomaly data for Ubinas. Upper graph shows 7 November through 7 December 2015, lower graph is from 8 December 2014 through 7 December 2015 and shows the first thermal anomaly reported by IGP-OVS on 14 June 2015. Courtesy of MIROVA (Taken from OVI-INGEMMET 2015 Weekly Report 49, 30 November-6 December). |
During the second week of June, OVI-INGEMMET noted that ash emissions were minor and continuous with fine, light gray or white ash, and bluish magmatic gases; the plumes rose from 300 to 1,300 m above the summit. Constant ash emissions from 9 to 11 June rose to 1,400 m above the summit. The Buenos Aires VAAC reported a brief emission on 17 June of olcanic ash that rose to 6.1 km. OVI-INGEMMET reported that large quantities of ash were emitted during 20-22 June in plumes rising to 1,800 m; ashfall was reported in the villages in the Ubinas Valley to the SE. Eight ash-emission events were recorded on 22 June by IGP-OVS, rising to 2,000 m above the summit (7,670 m altitude). The Buenos Aires VAAC also reported continuous and sporadic emissions during 20-22 June to 6.7 km altitude. During the last week of June, IGP-OVS noted that four explosions occurred between 24 and 27 June with emissions rising to 3,000 m above the summit (8,670 m altitude), and that 13 emission events occurred on 28 June. The Buenos Aires VAAC reported an explosive eruption on 28 June with a plume to 7 km altitude, and continuous emissions over the next few days rising to 6.7 km and drifting E.
Activity during July-September 2015. During early July 2015, decreasing tremors and ash emissions with plumes to 2,500 m were typical according to OVI-INGEMMET. On 1 July the Buenos Aires VAAC reported ongoing emissions rising to an altitude of 6.7 km and drifting SE. An explosion on 3 July caused ashfall in Ubinas to the SE. Larger events on 9 and 11 July emitted denser plumes that were observed by the Buenos Aires VAAC rising to 6.7 and 7.6 km. Increasing amounts of SO2 were also measured in the first half of July rising to between 2,500 and 4,900 metric tonnes per day (t/d), an increase from previous background levels of a few hundred t/d. A dense ash plume from an explosion observed by OVI-INGEMMET on 16 July caused ashfall in Ubinas; the Buenos Aires VAAC reported its plume to nearly 8 km altitude and drifting E (figure 34).
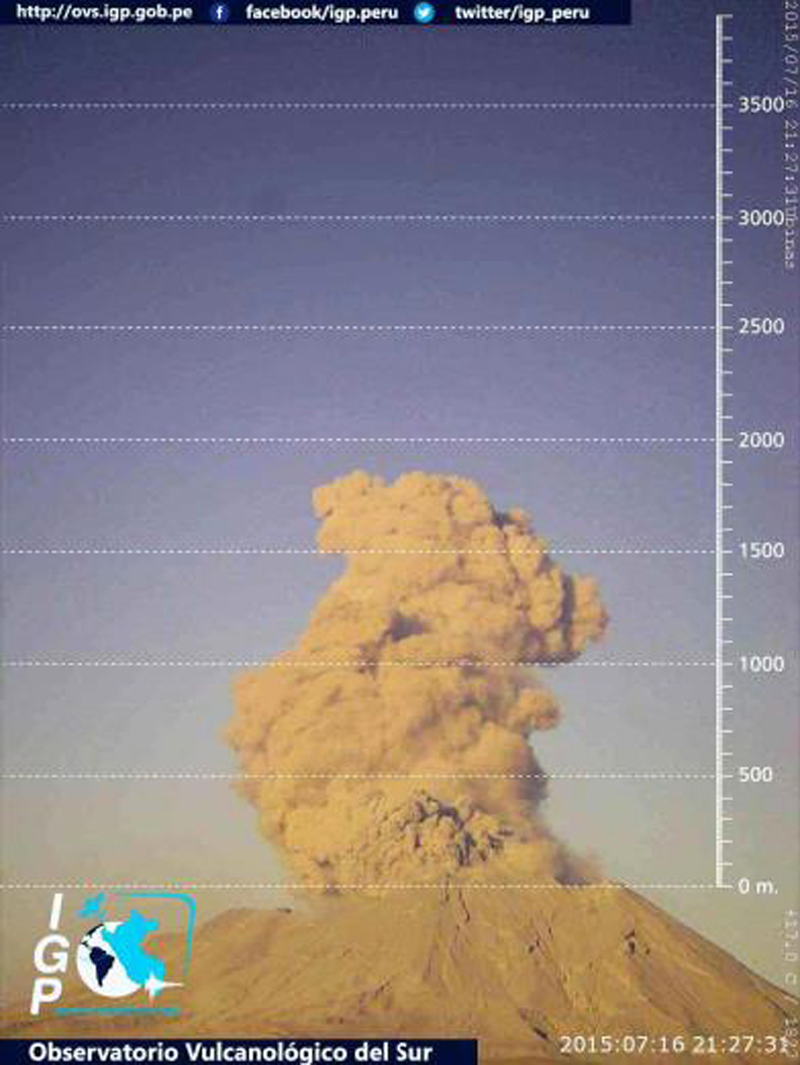 |
Figure 34. Explosion at Ubinas captured by the IGP-OVS Webcam on 16 July 2016. The ash plume was reported by Buenos Aires VAAC as eventually rising to over 8 km altitude. Courtesy of IGP-OVS (2015 Weekly Report 31, 21 July 2015). |
Seismic activity decreased for the first two weeks of July before a sudden and large increase in LP, hybrid, and VT events during 19-20 July. They also noted a sharp decrease in RSAM values for 14 hours prior to a significant explosion that occurred at 1903 local time on 25 July. The explosion registered at 507 MJ of energy, the largest of 2015, and ejected ash, lapilli, and bombs to the SE. Fragments of incandescent rocks were observed S and E of the crater (figure 35), and ashfall was reported up to 20 km away. Ash deposits 3 mm thick were observed in Ubinas and Escacha, along with lapilli fragments as large as 1.5 cm. The explosion was heard and felt in Querapi and Ubinas. It was followed by a second smaller explosion one hour later. The plume from the second event was reported to rise 4,000 m above the crater by OVI-INGEMMET (9,670 m altitude). Continuous bluish gas emissions were reported by IGP-OVS for the 48 hours following the 25 July explosions, after which intermittent bluish gases were frequently observed with plume heights rising to 1,000 m above the crater.
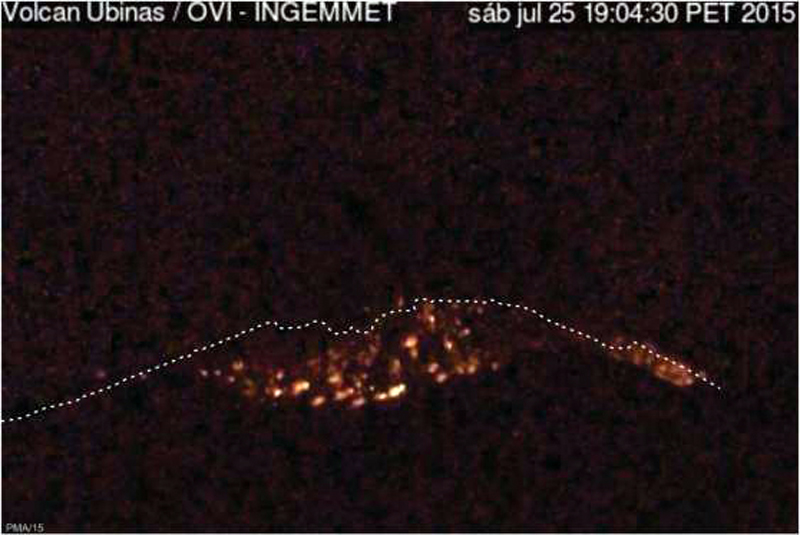 |
Figure 35. Incandescent bombs ejected S and E from the crater at Ubinas on 25 July 2015 at 1903 local time. Courtesy of OVI-INGEMMET (Weekly Report 31, 20 July -2 August 2015). |
IGP-OVS scientists conducted a field visit during 5-7 August 2015 and observed impact craters from volcanic bombs ejected during the 25 July explosion that were up to 2 m in diameter as far as 1.4 km from the crater. A moderate ash plume on 6 August that drifted NNE at 6.7 km altitude was the only plume reported by the Buenos Aires VAAC in August. IGP-OVS noted continuous tremors for 36 hours beginning on 10 August with minor ash emissions and a significant increase in VT and hybrid-type earthquakes during the second week. OVI-INGEMMET reported dense and continuous emissions of ash, steam, and gases throughout the month. The highest ash plumes of 2,300 m above the crater were observed on 27 August.
The first three weeks of September 2015 saw intermittent ash emissions to 1,500 m reported by IGP-OVS. The Buenos Aires VAAC reported a narrow, diffuse ash plume on 6 September at 6.1 km altitude extending 25 km ENE. The pulsing ash emissions observed by IGP-OVS on 9 and 10 September were recorded by the Buenos Aires VAAC as an irregular puff rising to 6.1 km. They also noted an explosive puff to 6.7 km on 21 September. This event correlated with an increase in hybrid, VT, and LP-type seismic events recorded by IGP-OVS which began on 20 September. This was followed by a large (53 MJ) explosion on 28 September that emitted a significant amount of ash and gas to 4,000 m (figure 36). Ashfall from this explosion was reported in Querapi (4.5 km SE), Ubinas, Tonohaya (7 km SSE), Anascapa (11 km SE), Sacohaya, and San Miguel (10 km SE). The Buenos Aires VAAC reported a plume drifting NE that rose to 8.2 km from this event, followed by another explosive eruption on 29 September with a plume that rose to 7.3 km. IGP-OVS reported another explosion on 30 September with an ash plume that rose to 1,400 m above the crater.
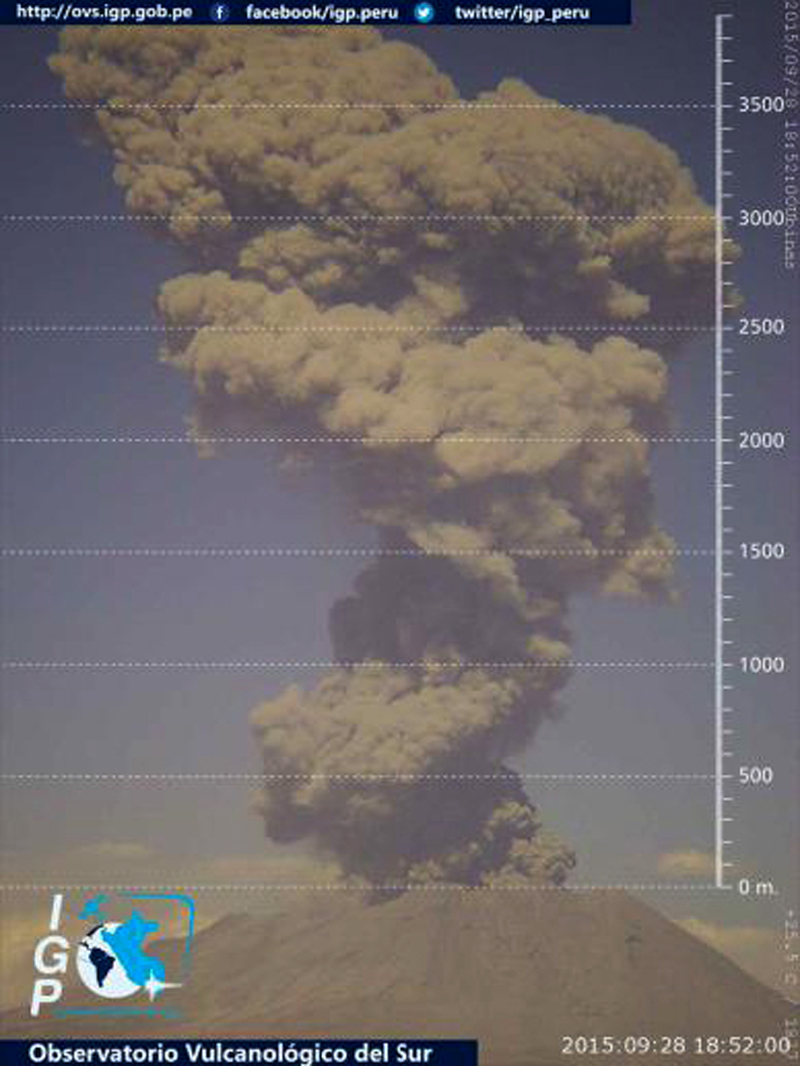 |
Figura 36. Webcam image of the explosion at Ubinas that occurred on 28 September 2015 beginning at 1345 local time. The plume height exceeded 3,500 m. Courtesy of IGP-OVS (2015 Weekly Report 41, 29 September 2015. |
Activity during October-December 2015. Both seismicity and ash emissions decreased during October 2015. The largest ash emissions (reported by IGP-OVS) were caused by five explosions with plumes to 2,000 m above the crater on 15 October. Pulsing ash emissions were also observed by OVI-INGEMMET on 21 October to 1,000 m, drifting NE and E. The Buenos Aires VAAC reported an ash plume to 6.1 km altitude from this event. Bluish magmatic gases and water vapor were emitted to 1,100 m above the summit frequently during the month. Six thermal anomalies were recorded by the MIROVA system (figure 33) in October. Seismicity of LP seismic events increased to 664 events on 30 October. OVI-INGEMMET reported large amounts of ash and gas emissions on 29 and 31 October (figure 37).
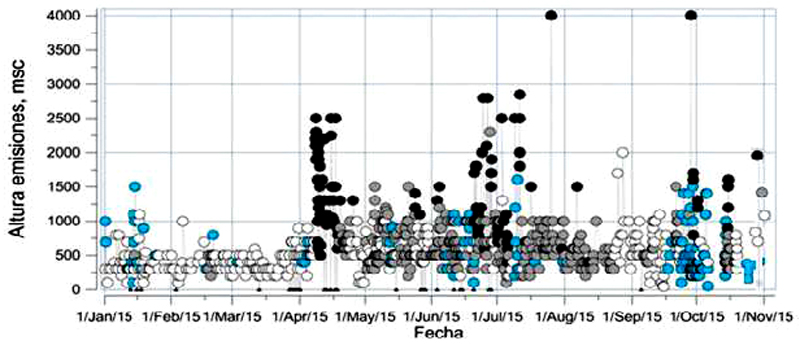 |
Figure 37. Emission heights and content at Ubinas from 1 January to 1 November 2015. Heights are measured above the crater in meters. White circles signify water vapor, blue circles are magmatic gases, gray circles are diffuse ash, and black circles are dense ash emissions. The 25 July and 28 September emissions produced the tallest plumes at 4,000 m. Courtesy of OVI-INGEMMET (Ubinas 2015 Weekly Report 45, 2-8 November 2015). |
The numbers of daily LP and hybrid seismic events were high at the beginning of November 2015 until a moderate 12 MJ explosion on 5 November that sent an ash plume to 2,200 m above the crater. The Buenos Aires VAAC recorded the explosive eruption on 5 November with a 7.3 km plume that drifted SE. This was followed by pulses of ash emissions until 8 November according to IGP-OVS. Sporadic ash emissions were again observed on 13, 14, and 18 November with the highest plume rising to 1,500 m and drifting S and SW on 13 November. They reported steady declines in the numbers of LP seismic events after 18 November, and emissions of only blue magmatic gases and water vapor. OVI-INGEMMET reported continuous plumes to 1,100 m in the last week of November comprised of gases, water vapor, and possible ash. More frequent MIROVA thermal anomalies appeared in mid-November to stronger levels than previously seen, suggesting to IGP-OVS the possible presence of a magma body near or at the base of the crater (figure 33).
No ash emissions were reported in December 2015. Instead, mild continuous emissions to 1,200 m of bluish magmatic gases and water vapor were reported by IGP-OVS and OVI-INGEMMET. IGP-OVS noted a large number of VT seismic events in December. They were located on the NW side of the crater, 1-3 km deep. Their scientists visited the crater on 23 December and remotely recorded temperatures of 454°C at the base of the crater. They observed intense emissions of magmatic gases from the bottom and side walls of the crater (figure 38). MIROVA thermal anomalies increased in mid-November and remained elevated through December (figure 39).
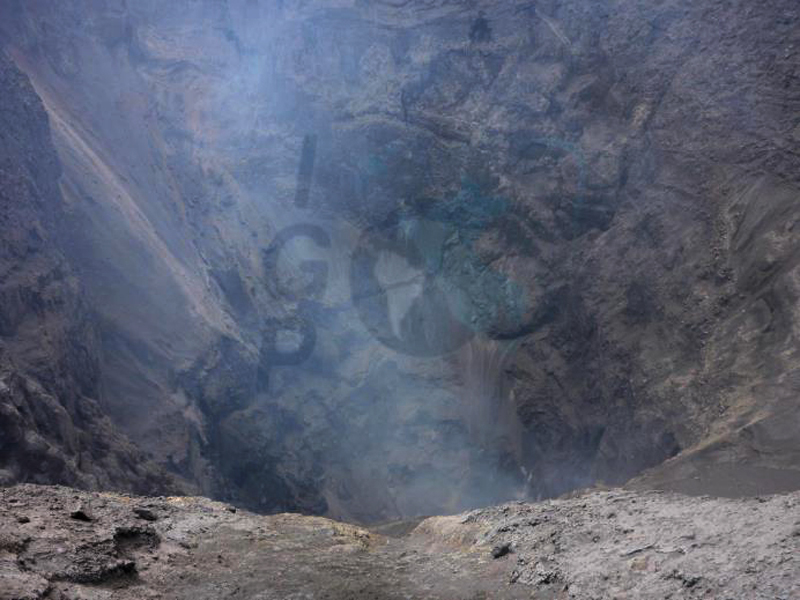 |
Figure 38. Emissions of magmatic gases from the base and walls of the crater at Ubinas on 23 December 2015. Courtesy of IGP-OVS (Weekly Report 54, 29 December 2015). |
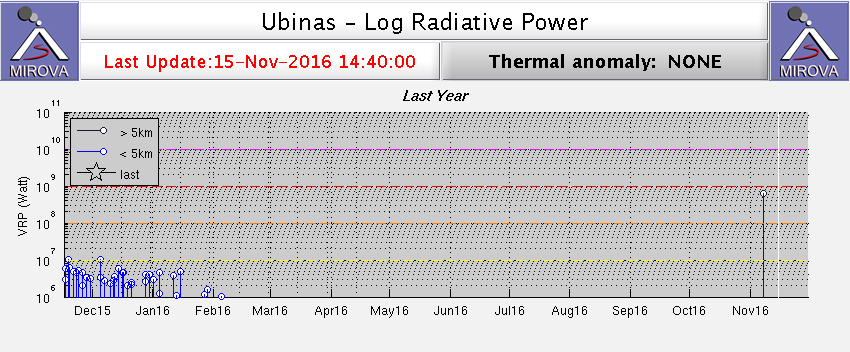 |
Figure 39. Log Radiative Power of MIROVA thermal anomalies at Ubinas from 16 November 2015 to 15 November 2016. The thermal anomaly signature persisted through mid-January before tapering off in the first week of February 2016. Courtesy of MIROVA. |
Activity during January-April 2016. Emissions of bluish magmatic gases to 1,800 m above the crater continued into January 2016 along with thermal anomalies recorded by the MIROVA system (figure 39). LP seismic events increased in the second week of January followed by an 11 MJ explosion on 15 January that sent an ash plume to 3,000 m above the crater, drifting S and SW. This explosion was preceded by ash emissions to 500 m a few hours earlier in the day. After the explosion, seismicity decreased, and emissions consisted of water vapor and bluish magmatic gases which rose no higher than 1,000 m for the remainder of the month.
Low seismicity, and water vapor and bluish magmatic gas plumes no higher than 1,100 m were typical behavior for February 2016. On 27 February small pulses of seismic tremor were recorded and small emissions of ash were observed, according to the IPG-OVS weekly report. OVI-INGEMMET reported a lahar on 12 February, and IGP-OVS reported several in the third week of the month that descended the Volcanmayo ravine on the S flank of the volcano.
Seismicity was very low, with only sporadic water vapor emissions, small quantities of bluish magmatic gases, and plume heights below a few hundred meters in March and April 2016. This led IGP-OVS and OVI-INGEMMET to jointly reduce the Alert Level from Orange to Yellow (3 to 2 on a 4-level scale) on 30 April 2016. The energy released by the volcano was in steady decline from the beginning of March 2016 (figure 40).
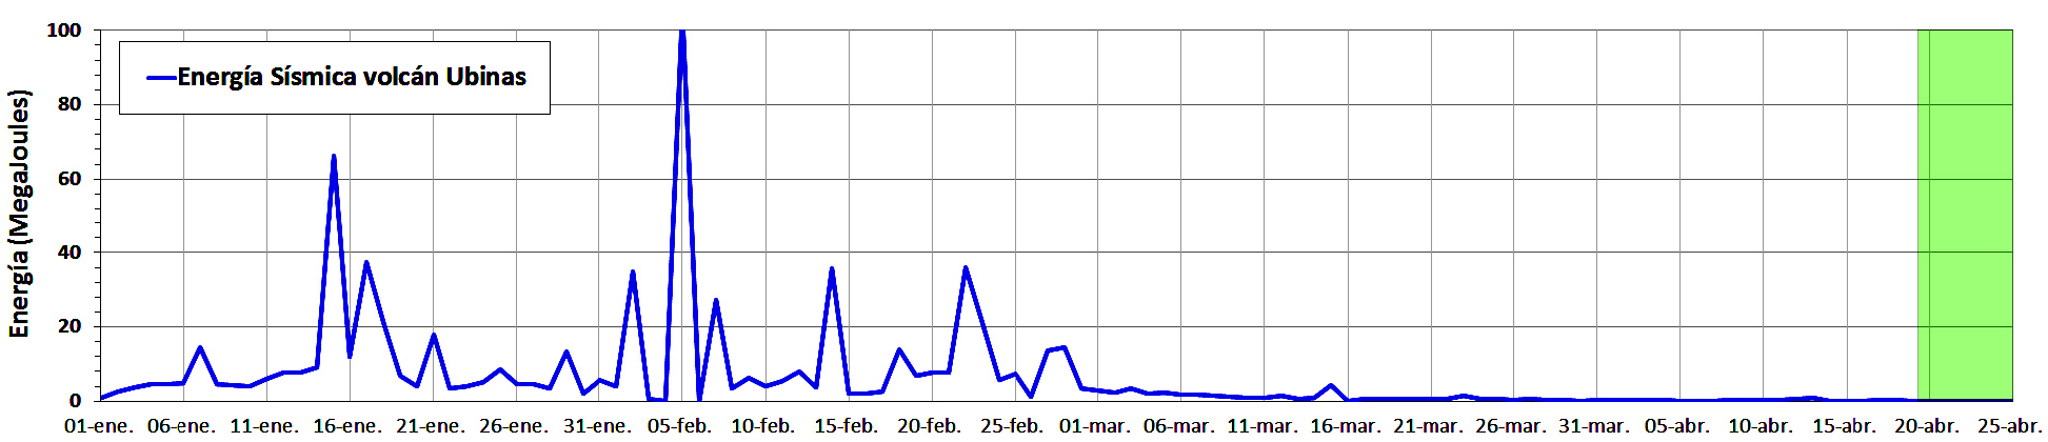 |
Figure 40. Total Seismic Energy (blue line) calculated for Ubinas from 1 January to 25 April 2016. Courtesy of IGP-OVS (Ubinas 2016 Report 17, 26 April 2016). |
Information Contacts: Instituto Geofisico del Peru, Observatoria Vulcanologico del Sur (IGP-OVS), Arequipa Regional Office, Urb La Marina B-19, Cayma, Arequipa, Peru (URL: http://ovs.igp.gob.pe/); Observatorio Volcanologico del INGEMMET, (Instituto Geológical Minero y Metalúrgico)(OVI-INGEMMET), Barrio Magisterial Nro. 2 B-16 Umacollo - Yanahuara Arequipa (URL: http://ovi.ingemmet.gob.pe); Buenos Aires Volcanic Ash Advisory Center (VAAC), Servicio Meteorológico Nacional-Fuerza Aérea Argentina, 25 de mayo 658, Buenos Aires, Argentina (URL: http://www.smn.gov.ar/vaac/buenosaires/inicio.php?lang=es); MIROVA (Middle InfraRed Observation of Volcanic Activity), a collaborative project between the Universities of Turin and Florence (Italy) supported by the Centre for Volcanic Risk of the Italian Civil Protection Department (URL: http://www.mirovaweb.it/).
Intermittent ash explosions during September 2016-February 2017
Ubinas is an active stratovolcano in southern Peru about 70 km E of the city of Arequipa. Holocene lava flows cover its flanks, and the historical record since the mid-1500's contains evidence of minor explosive eruptions, debris avalanches, tephra deposits, phreatic outbursts, and pyroclastic flows and lahars. An eruptive episode that began with phreatic explosions on 1 September 2013 lasted through 27 February 2016, producing numerous small ash emissions, several large explosions with ash plumes that rose above 10 km altitude, large SO2 anomalies, evacuations, and several millimeters of ashfall in surrounding villages. Significant MIROVA thermal anomalies first appeared in mid-June 2015 and persisted through January 2016. A smaller eruptive episode described below began on 13 September 2016 and continued with intermittent explosive activity through 2 March 2017. Information is provided by the Instituto Geofísico del Perú, Observatoria Vulcanologico del Sur (IGP-OVS), the Observatorio Volcanológico del INGEMMET (Instituto Geológical Minero y Metalúrgico) (OVI-INGEMMET), and the Buenos Aires VAAC (Volcanic Ash Advisory Center).
After activity subsided at the end of February 2016, Ubinas remained quiet through August 2016, with only sporadic steam and gas emissions, and very low levels of seismicity. Seismicity increased again beginning on 9 September, and the first ash emission of a new episode was reported on 13 September 2016. An explosion on 3 October released a significant ash plume that rose 2 km above the 5,672-m-summit. Four additional explosions with minor ash emissions were reported in November, and one occurred on 6 December. Webcams captured images of sporadic low-density ash emissions throughout February 2017, with the last report of possible emissions on 2 March 2017. Emissions of steam and gas and seismicity decreased throughout April 2017, and IGP-OVS lowered the alert level to Green by the end of May. Ubinas remained quiet through September 2017.
Activity during April-December 2016. After the small ash emission of 27 February 2016, seismicity at Ubinas dropped to very low levels of a few events per day (BGVN 41:10, figure 40). Sporadic steam emissions with small quantities of bluish magmatic gases rose no more than a few hundred meters above the summit during March-August 2016; there were no reports of ash emissions. A small seismic swarm of about 100 earthquakes was recorded on 5 April. The first "tornillo" type earthquakes seen in several months appeared beginning on 4 June, indicating to IGP-OVS the beginning of a new eruptive cycle. The lagoon that had formed at the bottom of the summit crater due to rains earlier in the year began to disappear as the dry season approached (figure 41).
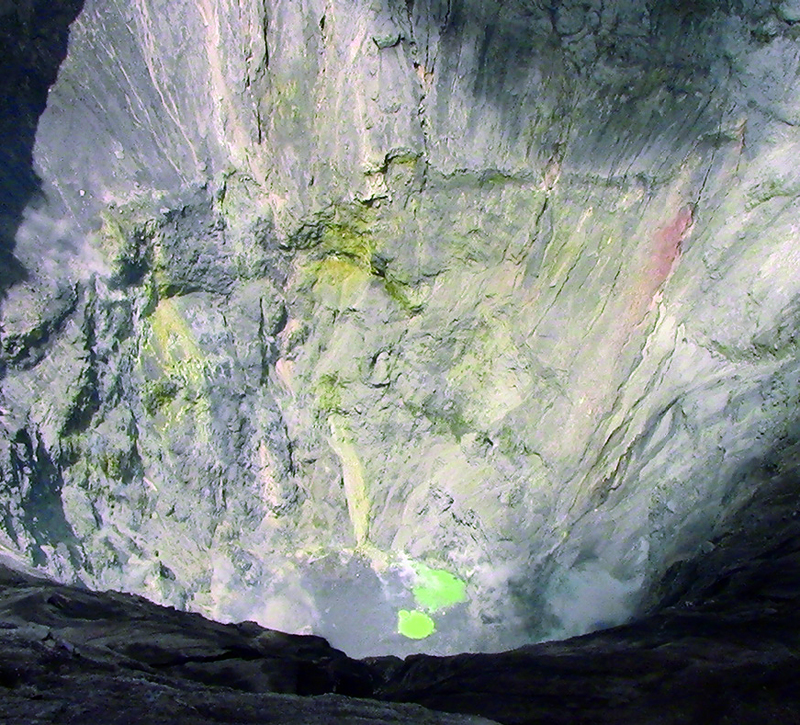 |
Figure 41. A view down into the steep-sided summit crater at Ubinas shows remnants of a disappearing lake after the rainy season, during the second quarter of 2016. Photo by Melquiades Álvarez; courtesy of OVS (Reporte Annual Volcan Ubinas, 2016). |
Beginning on 9 September 2016, both OVI and OVS noted an increase in seismic activity of LP, hybrid, and VT-type events (figure 42). On 13 September, OVS reported that steam plumes rose higher than 1,000 m above the summit for the first time in many months, and a minor ash emission was observed. OVI reported possible ash emissions in weekly reports on 12, 17, and 24 September. Emissions of bluish gas and steam were typical for the remainder of September (figure 43).
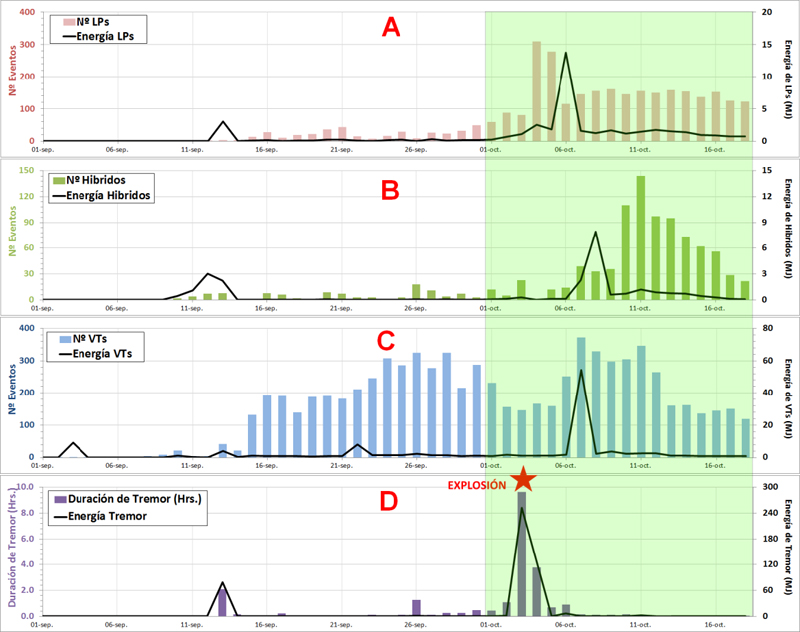 |
Figure 42. An increase in several types of seismicity at Ubinas first appeared on 9 September 2016 after several months of quiet. This was followed by an ash emission on 13 September, and an explosion with ash on 3 October. Courtesy of IGP-OVS (Reporte N°31-2016, Actividad del volcán Ubinas, Resumen actualizado de la principal actividad observada del 01 al 18 de octubre). |
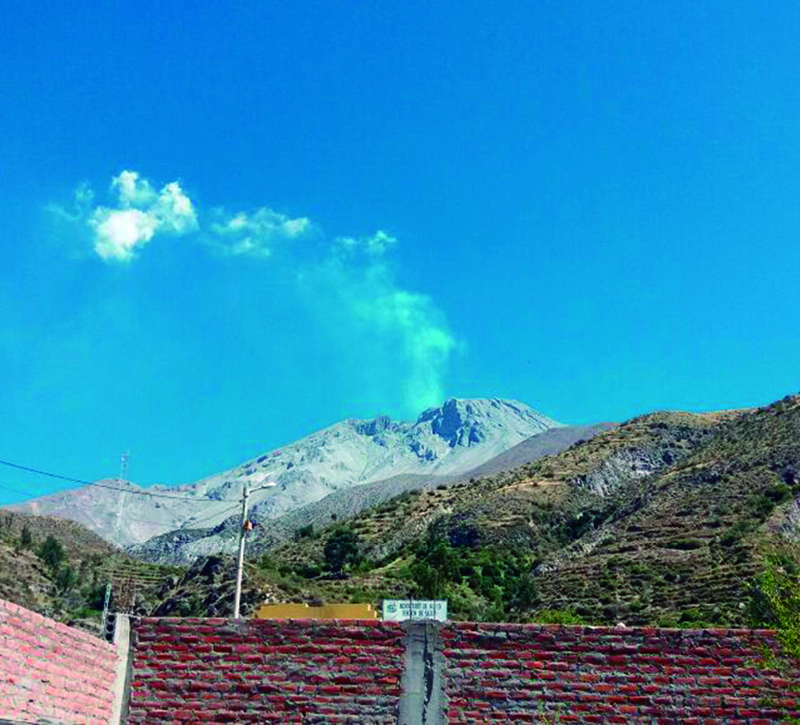 |
Figure 43. Bluish SO2-rich gas and steam emissions increased in frequency during the second half of September 2016 at Ubinas, as seen in this image taken from the village of Ubinas on 27 September 2016 by Melquiades Álvarez. Courtesy of IGP-OVS (Reporte Annual Volcan Ubinas, 2016). |
Both OVI and OVS reported ash emissions from explosions on 3 October 2016 (figure 44). Seismic tremor, associated with ash emissions, lasted for nine and a half hours. The ash plume drifted NE, E, SE, and SW up to 2 km above the summit, according to OVS. Fumarolic activity then returned, with steam and bluish gases rising no more than 1,500 m above the crater rim for the remainder of October. The Buenos Aires VAAC noted the eruption reported by IGP, but was not able to identify volcanic ash from satellite data under clear skies. After peaking in early October at several hundred events per day, seismicity declined to below 50 events on 21 October, and then rose slightly to around 200 events per day for the rest of the month. Steam and gas emissions remained less than 500 m above the summit.
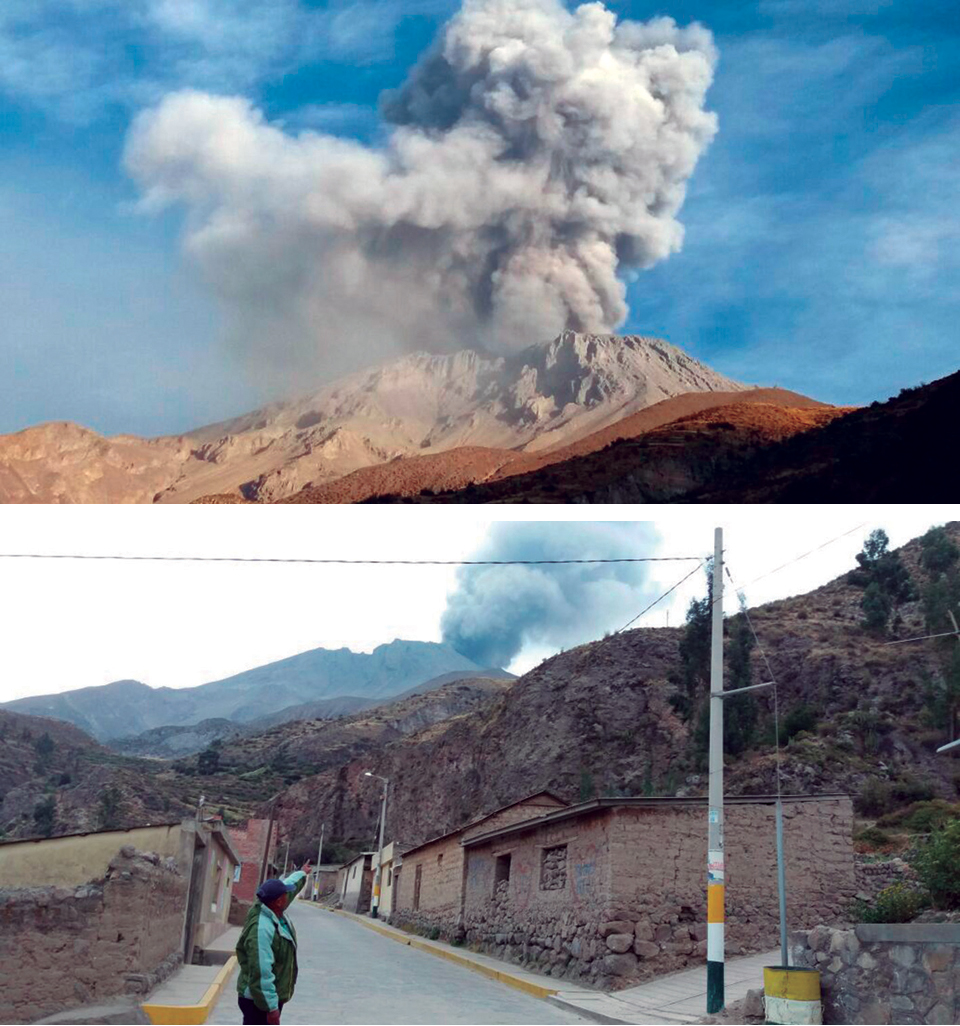 |
Figure 44. An explosion at Ubinas on 3 October 2016 created a significant ash plume that rose 2,000 m above the crater rim, and drifted NE, E, SE, and SW. Photos by Melquiades Álvarez, courtesy of IGP-OVS (Reporte Annual Volcan Ubinas, 2016). |
Three explosions with minor ash and gas (mostly SO2) were reported by IGP-OVS on 8 November (local time). NASA Goddard Space Flight Center reported a significant SO2 emission associated with this event. The ash plume rose to about 1,500 m above the crater rim (about 7.2 km altitude). Seismicity remained high, with 250-350 events per day for several days after the explosion before declining back to around 150 events per day by 15 November. Another explosion, with minor ash emissions that rose 500 m, was reported by both OVS and OVI on 17 November 2016. After a small spike in seismicity between 23 and 29 November, the number of seismic events dropped below 50 per day. OVS reported a small ash emission that rose 100 m above the summit and drifted NW on 6 December 2016. OVI noted a modest increase in seismicity between 6 and 15 December, but only sporadic emissions of water vapor and gas were detected for the remainder of the month.
Activity during January-September 2017. Gas and steam emissions remained below 500 m above the crater rim during January 2017. OVS reported an explosion at 0223 on 24 January, but could not confirm ash emissions due to darkness. Occasional emissions of steam and gas rose as high at 2 km above the summit crater, but they generally remained below 500 m. OVI observed five lahars during January, but no damage was reported. Seismicity remained below 60 events per day during the month, except for a few days during 8-12 January when the frequency increased to 100-150 events per day.
OVS reported sporadic low-density ash emissions throughout February 2017 (figure 45). They were accompanied, occasionally, by water vapor and bluish gas, and did not rise more than 1,500 m above the summit crater. Weather clouds obscured the summit for much of the month. OVI reported minor ash emissions on 4, 10, 14, and 18 February (figure 46). Seismicity fluctuated throughout the month from values as high as almost 70 events per day (8 February) to fewer than 10 events per day (10-19 February).
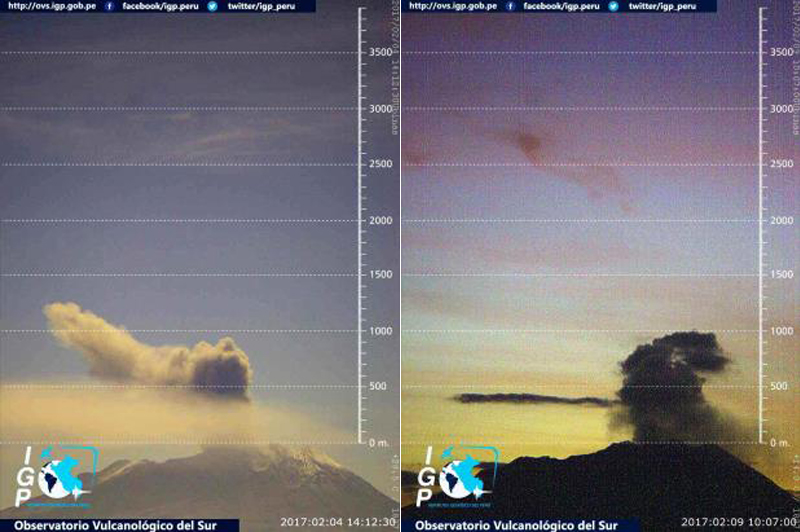 |
Figure 45. Sporadic emissions of ash along with steam and magmatic gases were recorded in the IGP-OVS webcams at Ubinas on 4 and 9 February 2017. Courtesy of IGP-OVS (Reporte 03-2017 - Actividad del volcán Ubinas, Resumen actualizado de la principal actividad observada del 01 al 15 de febrero de 2017). |
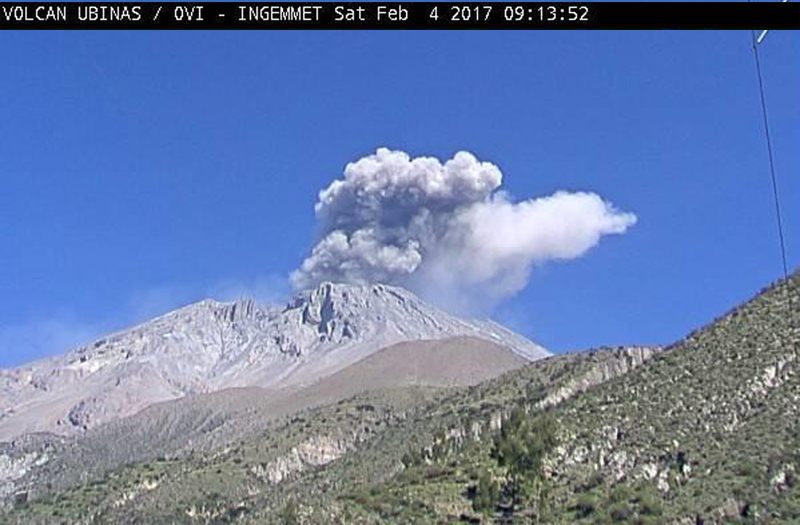 |
Figure 46. The OVI webcam captured a clear image of the 4 February 2017 ash emission. Courtesy of OVI (Reporte Semanal de Monitoreo: Volcan Ubinas, Reporte 06, Semana del 30 de enero al 05 febrero de 2017). |
OVS reported only magmatic gas and steam emissions (with no ash) during March 2017, with plumes rising to a maximum height of 300 m above the summit crater. OVI noted possible diffuse ash emissions on 1 and 2 March, but only steam and gas emissions for the remainder of the month. They reported variable seismicity with the frequency of daily events ranging from less than 10 per day to almost 70, averaging about 30 events per day.
Seismic energy decreased significantly during April 2017. Sporadic steam emissions reached maximum heights of only a few hundred meters above the crater. This relative quiet enabled OVS scientist Melquiades Álvarez to make a brief inspection of the summit crater on 14 April where he observed intermittent steam emissions rising from the base of the summit crater (figure 47). No ash emissions were reported during April. OVI reported that the number of seismic events dropped consistently during April from a high of 20 daily events on 1 April, to fewer than 5 events per day at the end of the month.
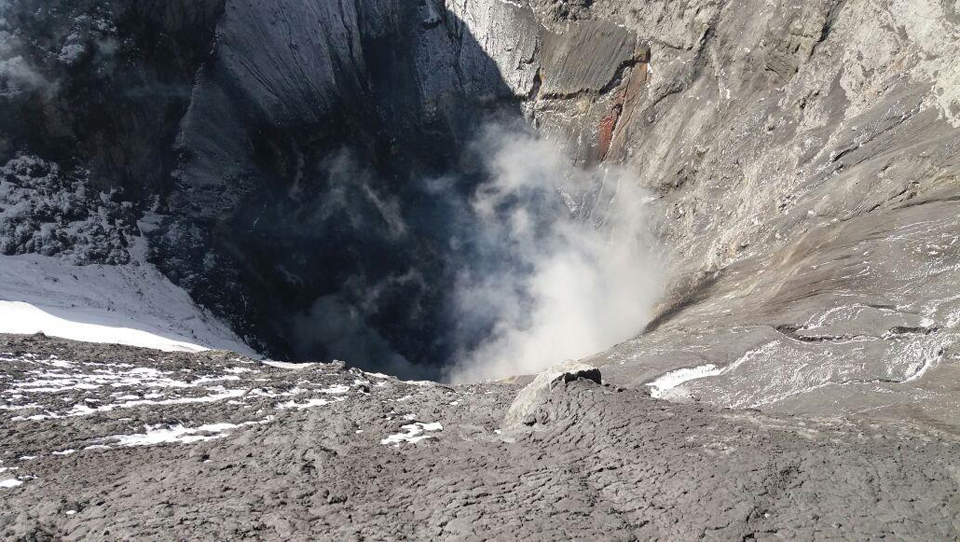 |
Figure 47. A view into the summit crater at Ubinas on 14 April 2017 revealed only sporadic steam emissions. Photo by Melquiades Álvarez; courtesy of IGP-OVS (Reporte 07-2017-Actividad del volcán Ubinas, Resumen actualizado de la principal actividad observada del 01 al 15 de abril de 2017). |
The reduction in activity continued during May 2017; steam and gas emissions became more sporadic and were rarely reported rising above 500 m over the summit crater. IGP-OVS reduced the alert level from Yellow to Green (2 to 1 on a 4-level scale) during the second half of the month. Seismicity reported by OVI fluctuated between 2 and 14 daily events. Ubinas remained quiet from June through September 2017, with only occasional minor fumarolic activity of steam or magmatic gas plumes that rose a few hundred meters above the summit crater (figure 48). Frequency of seismic events remained below 20 events per day through August and dropped to less than 10 per day in September.
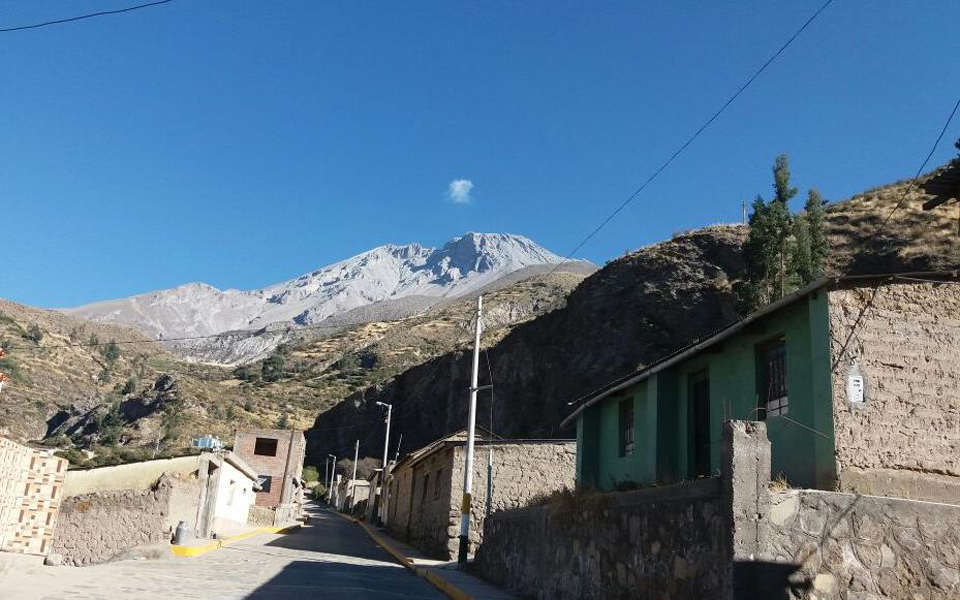 |
Figure 48. Virtually no emissions of any kind were reported from Ubinas after mid-July 2017, as seen in this image from the second half of August 2017. Courtesy of IGP-OVS (Reporte 16-2017-Actividad del volcán Ubinas, Resumen actualizado de la principal actividad observada del 16 al 31 de agosto de 2017). |
Information Contacts: Instituto Geofisico del Peru, Observatoria Vulcanologico del Sur (IGP-OVS), Arequipa Regional Office, Urb La Marina B-19, Cayma, Arequipa, Peru (URL: http://ovs.igp.gob.pe/); Observatorio Volcanologico del INGEMMET, (Instituto Geológical Minero y Metalúrgico), Barrio Magisterial Nro. 2 B-16 Umacollo - Yanahuara Arequipa (URL: http://ovi.ingemmet.gob.pe); Buenos Aires Volcanic Ash Advisory Center (VAAC), Servicio Meteorológico Nacional-Fuerza Aérea Argentina, 25 de mayo 658, Buenos Aires, Argentina (URL: http://www.smn.gov.ar/vaac/buenosaires/inicio.php?lang=es).
Intermittent ash explosions in June-August 2019
Prior to renewed activity in June 2019, the most recent eruptive episode at Ubinas occurred between 13 September 2016 and 2 March 2017, with ash explosions that generated plumes that rose up to 1.5-2 km above the summit crater (BGVN 42:10). The volcano remained relatively quiet between April 2017 and May 2019. This report discusses an eruption that began in June 2019 and continued through at least August 2019. Most of the Information was provided by the Instituto Geofísico del Perú (IGP), Observatoria Vulcanologico del Sur (IGP-OVS), the Observatorio Volcanológico del INGEMMET (Instituto Geológical Minero y Metalúrgico) (OVI-INGEMMET), and the Buenos Aires Volcanic Ash Advisory Center (VAAC).
Activity during June 2019. According to IGP, seismic activity increased suddenly on 18 June 2019 with signals indicating rock fracturing. During 21-24 June, signals indicating fluid movement emerged and, beginning at 0700 on 24 June, webcams recorded ash, gas, and steam plumes rising from the crater. Plumes were visible in satellite images rising to an altitude of 6.1 km and drifting N, NE, and E.
IGP and INGEMMET reported that seismic activity remained elevated during 24-30 June; volcano-tectonic (VT) events averaged 200 per day and signals indicating fluid movement averaged 38 events per day. Emissions of gas, water vapor, and ash rose from the crater and drifted N and NE, based on webcam views and corroborated with satellite data. According to a news article, a plume rose 400 m above the crater rim and drifted 10 km NE. Weather clouds often obscured views of the volcano, but an ash plume was visible in satellite imagery on 24 June 2019 (figure 49). On 27 June the Alert Level was raised to Yellow (second lowest on a 4-level scale).
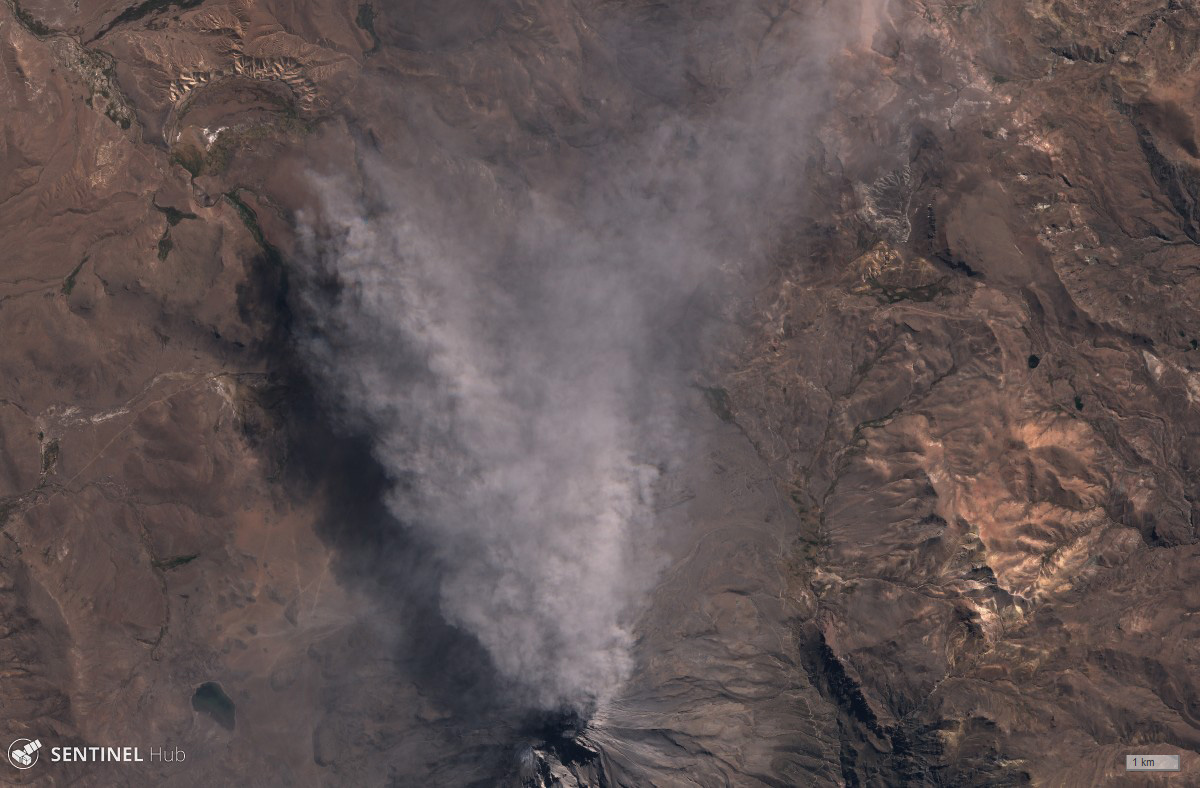 |
Figure 49. Sentinel-2 satellite image in natural color showing an ash plume blowing north from Ubinas on 24 June 2019. Courtesy of Sentinel Hub Playground. |
Activity during July 2019. IGP reported that seismic activity remained elevated during 1-15 July; VT events averaged 279 per day and long-period (LP) events (indicating fluid movement) averaged 116 events per day. Minor bluish emissions (magmatic gas) rose from the crater. Infrared imagery obtained by Sentinel-2 first showed a hotspot in the summit crater on 4 July.
According to IGP, during 17-19 July, gas-and-ash emissions occasionally rose from Ubinas's summit crater and drifted N, E, and SE. Beginning at 0227 on 19 July, as many as three explosions (two were recorded at 0227 and 0235) generated ash plumes that rose to 5.8 km above the crater rim. The Buenos Aires VAAC reported that, based on satellite images, ash plumes rose to an altitude as high as 12 km. The Alert Level was raised to Orange and the public were warned to stay beyond a 15-km radius. Ash plumes drifted as far as 250 km E and SE, reaching Bolivia. Ashfall was reported in areas downwind, including the towns of Ubinas (6.5 km SSE), Escacha, Anascapa (11 km SE), Tonohaya (7 km SSE), Sacohaya, San Miguel (10 km SE), Huarina, and Matalaque, causing some families to evacuate. The Buenos Aires VAAC reported that during 20-23 July ash plumes rose to an altitude of 7.3-9.5 km and drifted E, ESE, and SE.
IGP reported that activity remained elevated after the 19 July explosions. A total of 1,522 earthquakes, all with magnitudes under 2.2, were recorded during 20-24 July. Explosions were detected at 0718 and 2325 on 22 July, the last ones until 3 September. The Buenos Aires VAAC reported that an ash plume rising to an altitude of 9.4 km. and drifting SE was identified in satellite data at 0040 on 22 July (figure 50). Continuous steam-and-gas emissions with sporadic pulses of ash were visible in webcam views during the rest of the day. Ash emissions near the summit crater were periodically visible on 24 July though often partially hidden by weather clouds. Ash plumes were visible in satellite images rising to an altitude of 7 km. Diffuse ash emissions near the crater were visible on 25 July, and a thermal anomaly was identified in satellite images. During 26-28 July, there were 503 people evacuated from areas affected by ashfall.
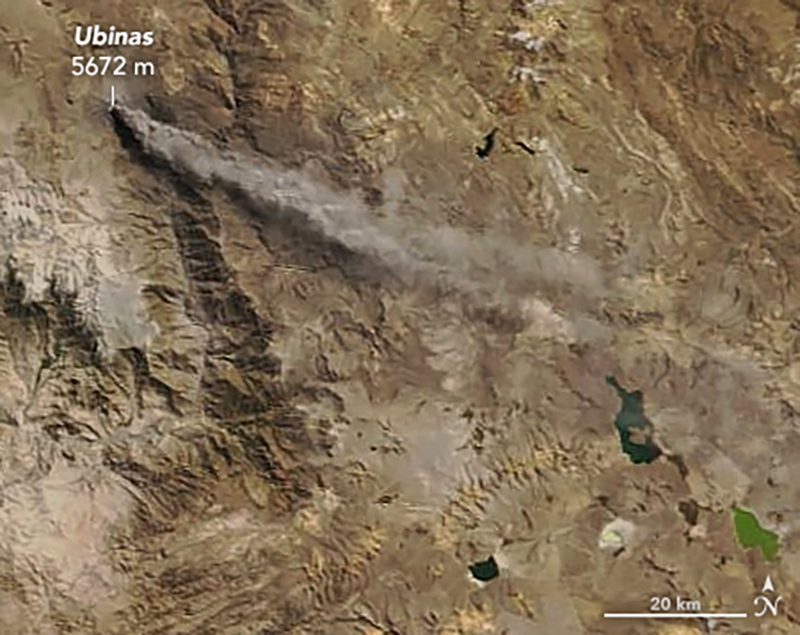 |
Figure 50. Image of ash streaming from the summit of Ubinas on 22 July 2019 captured by the Moderate Resolution Imaging Spectroradiometer (MODIS) on NASA's Terra satellite. Courtesy of NASA's Earth Observatory (Joshua Stevens and Kathryn Hansen). |
Activity during August 2019. IGP reported that during 13-19 August blue-colored gas plumes rose to heights of less than 1.5 km above the base of the crater. The number of seismic events was 1,716 (all under M 2.4), a decrease from the total recorded the previous week.
According to IGP, blue-colored gas plumes rose above the crater and eight thermal anomalies were recorded by the MIROVA system during 20-26 August. The number of seismic events was 1,736 (all under M 2.4), and there was an increase in the magnitude and number of hybrid and LP events. Around 1030 on 26 August an ash emission rose less than 2 km above the crater rim. Continuous ash emissions on 27 August were recorded by satellite and webcam images drifting S and SW.
IGP reported that during the week of 27 August, gas-and-water-vapor plumes rose to heights less than 1 km above the summit. The number of seismic events was 2,828 (all under M 2.3), with VT signals being the most numerous. There was a slight increase in the number of LP, hybrid, and VT events compared to the previous week. The Alert Level remained at Orange.
Thermal anomalies. The MIROVA (Middle InfraRed Observation of Volcanic Activity) system detected a large concentration of anomalies between 19 July until almost the end of August 2019, all of which were of low radiative power (figure 51). Infrared satellite imagery (figure 52) also showed the strong thermal anomaly associated with the explosive activity on 19 July and then the continuing hot spot inside the crater through the end of August.
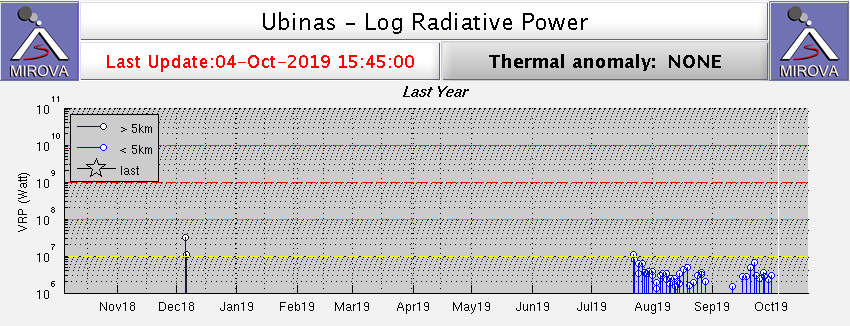 |
Figure 51. Log radiative power MIROVA plot of MODIS thermal anomalies at Ubinas for the year ending on 4 October 2019. Thermal activity began in the second half of July. Courtesy of MIROVA. |
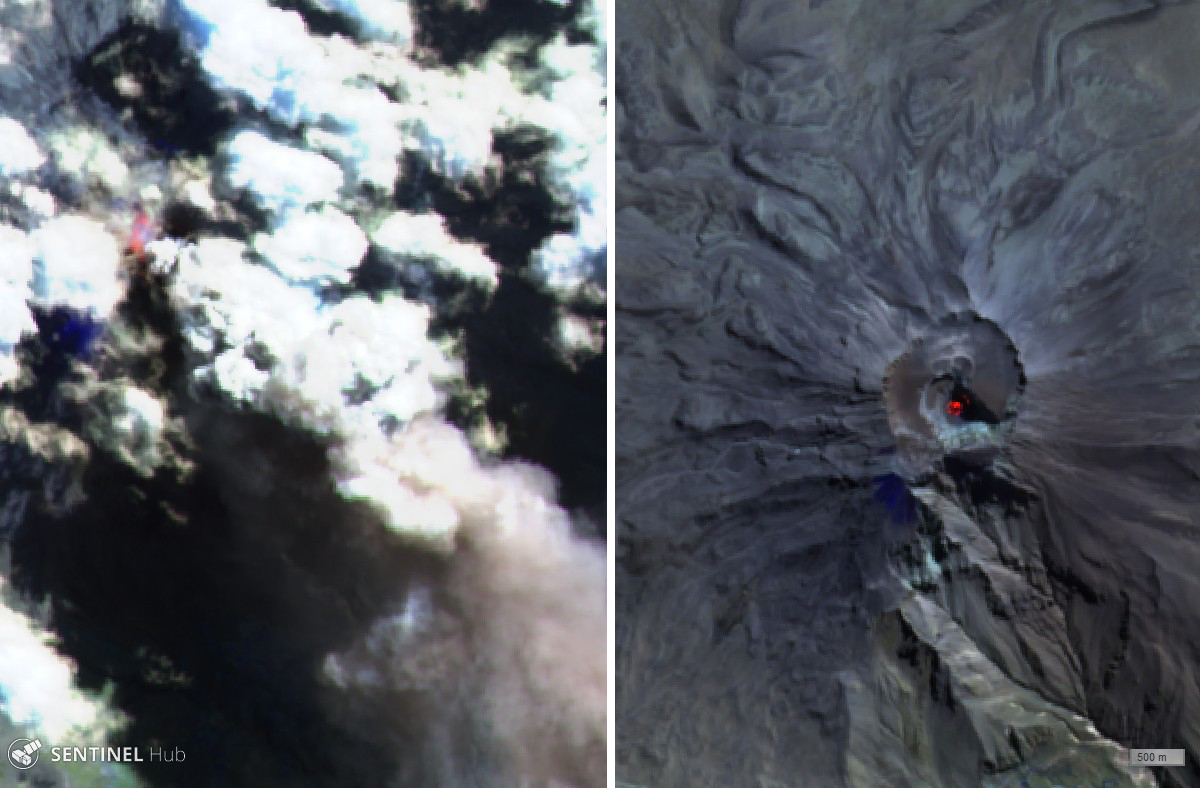 |
Figure 52. Sentinel-2 satellite images (Atmospheric penetration rendering, bands 12, 11, 8A) showing thermal anomalies during the eruption on 19 July (left) and inside the summit crater on 29 July 2019 (right). A hot spot inside the crater persisted through the end of August. Courtesy of Sentinel Hub Playground. |
Information Contacts: Instituto Geofisico del Peru (IGP), Observatoria Vulcanologico del Sur (IGP-OVS), Arequipa Regional Office, Urb La Marina B-19, Cayma, Arequipa, Peru (URL: http://ovs.igp.gob.pe/); Observatorio Volcanologico del INGEMMET (Instituto Geológical Minero y Metalúrgico), Barrio Magisterial Nro. 2 B-16 Umacollo - Yanahuara Arequipa (URL: http://ovi.ingemmet.gob.pe); Buenos Aires Volcanic Ash Advisory Center (VAAC), Servicio Meteorológico Nacional-Fuerza Aérea Argentina, 25 de mayo 658, Buenos Aires, Argentina (URL: http://www.smn.gov.ar/vaac/buenosaires/inicio.php?lang=es); MIROVA (Middle InfraRed Observation of Volcanic Activity), a collaborative project between the Universities of Turin and Florence (Italy) supported by the Centre for Volcanic Risk of the Italian Civil Protection Department (URL: http://www.mirovaweb.it/); Sentinel Hub Playground (URL: https://www.sentinel-hub.com/explore/sentinel-playground); Instituto Nacional de Defensa Civil Perú (INDECI) (URL: https://www.indeci.gob.pe/); Gobierno Regional de Moquegua (URL: http://www.regionmoquegua.gob.pe/web13/); La Republica (URL: https://larepublica.pe/); NASA Earth Observatory, EOS Project Science Office, NASA Goddard Space Flight Center, Goddard, Maryland, USA (URL: http://earthobservatory.nasa.gov/).
Explosions produced ash plumes in September 2019; several lahars generated in January and February 2020
Ubinas, located 70 km from the city of Arequipa in Peru, has produced frequent eruptions since 1550 characterized by ash plumes, ballistic ejecta (blocks and bombs), some pyroclastic flows, and lahars. Activity is focused at the summit crater (figure 53). A new eruptive episode began on 24 June 2019, with an ash plume reaching 12 km altitude on 19 July. This report summarizes activity during September 2019 through February 2020 and is based on agency reports and satellite data.
|
Figure 53. A PlanetScope satellite image of Ubinas on 16 December 2019. Courtesy of PlanetLabs. |
Prior to September 2019 the last explosion occurred on 22 July. At 2145 on 1 September moderate, continuous ash emission occurred reaching nearly 1 km above the crater. An explosion produced an ash plume at 1358 on the 3rd that reached up to 1.3 km above the summit; six minutes later ashfall and lapilli up to 1.5 cm in diameter was reported 6 km away, with ashfall reported up to 8 km away (figure 54 and 55). Three explosions produced ash plumes at 0456, 0551, and 0844 on 4 September, with the two later ash plumes reaching around 2 km above the crater. The ash plume dispersed to the south and ashfall was reported in Ubinas, Tonohaya, San Miguel, Anascapa, Huatahua, Huarina, and Matalaque, reaching a thickness of 1 mm in Ubinas.
|
Figure 54. An eruption at Ubinas produced an ash plume up to 1.3 km on at 1358 on 3 September 2019. Courtesy of INGEMMET. |
|
Figure 55. Ash and lapilli fall up to 1.5 cm in diameter was reported 6 km away from Ubinas on 3 September 2019 (top) and an Ingemmet geologist collects ash samples from the last three explosions. Courtesy of INGEMMET. |
During 8-9 September there were three explosions generating ash plumes to less than 2.5 km, with the largest occurring at 1358 and producing ashfall in the Moquegua region to the south. Following these events, gas and water vapor were continuously emitted up to 1 km above the crater. There was an increase in seismicity during the 10-11th and an explosion produced a 1.5 km high (above the crater) ash plume at 0726 on the 12th, which dispersed to the S and SE (figure 56). During 10-15 September there was continuous emission of gas (blue in color) and steam up to 1.5 km above the volcano. Gas emission, thermal anomalies, and seismicity continued during 16-29 September, but no further explosions were recorded.
|
Figure 56. An explosion at Ubinas on 12 September 2019 produced an ash plume to 1.5 km above the volcano. The ash dispersed to the S and SE. Courtesy of IGP. |
Throughout October activity consisted of seismicity, elevated temperatures within the crater, and gas emissions reaching 800 to 1,500 m above the crater. No explosions were recorded. Drone footage released in early October (figure 57) shows the gas emissions and provided a view of the crater floor (figure 58). On the 15th IGP reported that the likelihood of an eruption had reduced.
|
Figure 57. IGP flew a fixed-wing drone over Ubinas as part of their monitoring efforts. This photograph shows gas emissions rising from the summit crater, published on 7 October 2019. Courtesy of IGP. |
|
Figure 58. Drone image showing gas emissions and the summit crater of Ubinas. Image taken by IGP staff and released on 7 October 2019; courtesy of IGP. |
Similar activity continued through early November with no reported explosions, and the thermal anomalies were no longer detected at the end of November (figure 59), although a faint thermal anomaly was visible in Sentinel-2 data in mid-December (figure 60). A rockfall occurred at 1138 on 13 November down the Volcanmayo gorge.
|
Figure 59. This MIROA Log Radiative Power plot shows increased thermal energy detected at Ubinas during August through November 2019. Courtesy of MIROVA. |
|
Figure 60. Sentinel-2 thermal satellite image showing elevated temperatures in the Ubinas crater on 16 December 2019. Courtesy of Sentinel Hub Playground. |
There were no explosions during January or February 2020, with seismicity and reduced gas emissions continuing. There was a small- to moderate-volume lahar generated at 1620 on 4 January down the SE flank. A second moderate- to high-volume lahar was generated at 1532 on 24 February, and three more lahars at 1325 and 1500 on 29 February, and at 1601 on 1 March, moved down the Volcanmayo gorge and the Sacohaya river channel. The last three lahars were of moderate to large volume.
Information Contacts: Observatorio Volcanologico del INGEMMET (Instituto Geológical Minero y Metalúrgico), Barrio Magisterial Nro. 2 B-16 Umacollo - Yanahuara Arequipa, Peru (URL: http://ovi.ingemmet.gob.pe); Instituto Geofisico del Peru (IGP), Calle Badajoz N° 169 Urb. Mayorazgo IV Etapa, Ate, Lima 15012, Perú (URL: https://www.gob.pe/igp); MIROVA (Middle InfraRed Observation of Volcanic Activity), a collaborative project between the Universities of Turin and Florence (Italy) supported by the Centre for Volcanic Risk of the Italian Civil Protection Department (URL: http://www.mirovaweb.it/); Planet Labs, Inc. (URL: https://www.planet.com/); Sentinel Hub Playground (URL: https://www.sentinel-hub.com/explore/sentinel-playground).
|
|
||||||||||||||||||||||||||
There is data available for 25 confirmed eruptive periods.
2024 May 6 - 2024 Jun 11 (?) Confirmed Eruption (Explosive / Effusive) VEI: 2
| Episode 1 | Eruption (Explosive / Effusive) | ||||||||||||||||||||||||
|---|---|---|---|---|---|---|---|---|---|---|---|---|---|---|---|---|---|---|---|---|---|---|---|---|
| 2024 May 6 - 2024 Jun 11 (?) | Evidence from Observations: Reported | |||||||||||||||||||||||
|
List of 3 Events for Episode 1
|
||||||||||||||||||||||||
2023 Jun 22 - 2023 Dec 15 Confirmed Eruption (Explosive / Effusive) VEI: 3
| Episode 1 | Eruption (Explosive / Effusive) | |||||||||||||||||||||||||||||||||||||||
|---|---|---|---|---|---|---|---|---|---|---|---|---|---|---|---|---|---|---|---|---|---|---|---|---|---|---|---|---|---|---|---|---|---|---|---|---|---|---|---|
| 2023 Jun 22 - 2023 Dec 15 | Evidence from Observations: Reported | ||||||||||||||||||||||||||||||||||||||
|
List of 6 Events for Episode 1
|
|||||||||||||||||||||||||||||||||||||||
2019 Jun 24 - 2019 Sep 12 Confirmed Eruption (Explosive / Effusive) VEI: 2
| Episode 1 | Eruption (Explosive / Effusive) | ||||||||||||||
|---|---|---|---|---|---|---|---|---|---|---|---|---|---|---|
| 2019 Jun 24 - 2019 Sep 12 | Evidence from Observations: Reported | |||||||||||||
|
List of 1 Events for Episode 1
|
||||||||||||||
2016 Sep 13 - 2017 Mar 2 Confirmed Eruption (Explosive / Effusive) VEI: 2
| Episode 1 | Eruption (Explosive / Effusive) | Summit crater | ||||||||||||||||||||||||||||||||||||||||||||||||||||||||||||||||||||||||||||||||||||||||||||||||||||||||||||
|---|---|---|---|---|---|---|---|---|---|---|---|---|---|---|---|---|---|---|---|---|---|---|---|---|---|---|---|---|---|---|---|---|---|---|---|---|---|---|---|---|---|---|---|---|---|---|---|---|---|---|---|---|---|---|---|---|---|---|---|---|---|---|---|---|---|---|---|---|---|---|---|---|---|---|---|---|---|---|---|---|---|---|---|---|---|---|---|---|---|---|---|---|---|---|---|---|---|---|---|---|---|---|---|---|---|---|---|---|---|
| 2016 Sep 13 - 2017 Mar 2 | Evidence from Observations: Reported | ||||||||||||||||||||||||||||||||||||||||||||||||||||||||||||||||||||||||||||||||||||||||||||||||||||||||||||
|
List of 20 Events for Episode 1 at Summit crater
|
|||||||||||||||||||||||||||||||||||||||||||||||||||||||||||||||||||||||||||||||||||||||||||||||||||||||||||||
2013 Sep 1 - 2016 Feb 27 Confirmed Eruption (Explosive / Effusive) VEI: 2
| Episode 1 | Eruption (Explosive / Effusive) | Summit crater | ||||||||||||||||||||||||||||||||||||||||||||||||||||||||||||||||||||||||||||||||||||||||||||||||||||||||||||||||||||||||||||||||||||||||||||||||||||||||||||||||||||||||||||||||||||||||||||||||||||||||||||||||||||||||||||||||||||||||||||||||||||||||||||||||||||||||||||||||||||||||||||||||||||||||||||||||||||||||||||||||||||||||||||||||||||||||||||||||||||||||||||||||||||||||||||||||||||||||||||||||||||||||||||||||||||||||||||||||||||||||||||||||||||||||||||||||||||||||||||||||||||||||||||||||||||||||||||||||||||||||||||||||
|---|---|---|---|---|---|---|---|---|---|---|---|---|---|---|---|---|---|---|---|---|---|---|---|---|---|---|---|---|---|---|---|---|---|---|---|---|---|---|---|---|---|---|---|---|---|---|---|---|---|---|---|---|---|---|---|---|---|---|---|---|---|---|---|---|---|---|---|---|---|---|---|---|---|---|---|---|---|---|---|---|---|---|---|---|---|---|---|---|---|---|---|---|---|---|---|---|---|---|---|---|---|---|---|---|---|---|---|---|---|---|---|---|---|---|---|---|---|---|---|---|---|---|---|---|---|---|---|---|---|---|---|---|---|---|---|---|---|---|---|---|---|---|---|---|---|---|---|---|---|---|---|---|---|---|---|---|---|---|---|---|---|---|---|---|---|---|---|---|---|---|---|---|---|---|---|---|---|---|---|---|---|---|---|---|---|---|---|---|---|---|---|---|---|---|---|---|---|---|---|---|---|---|---|---|---|---|---|---|---|---|---|---|---|---|---|---|---|---|---|---|---|---|---|---|---|---|---|---|---|---|---|---|---|---|---|---|---|---|---|---|---|---|---|---|---|---|---|---|---|---|---|---|---|---|---|---|---|---|---|---|---|---|---|---|---|---|---|---|---|---|---|---|---|---|---|---|---|---|---|---|---|---|---|---|---|---|---|---|---|---|---|---|---|---|---|---|---|---|---|---|---|---|---|---|---|---|---|---|---|---|---|---|---|---|---|---|---|---|---|---|---|---|---|---|---|---|---|---|---|---|---|---|---|---|---|---|---|---|---|---|---|---|---|---|---|---|---|---|---|---|---|---|---|---|---|---|---|---|---|---|---|---|---|---|---|---|---|---|---|---|---|---|---|---|---|---|---|---|---|---|---|---|---|---|---|---|---|---|---|---|---|---|---|---|---|---|---|---|---|---|---|---|---|---|---|---|---|---|---|---|---|---|---|---|---|---|---|---|---|---|---|---|---|---|---|---|---|---|---|---|---|---|---|---|---|---|---|---|---|---|---|---|---|---|---|---|---|---|---|---|---|---|---|---|---|---|---|---|---|---|---|---|---|---|---|---|---|---|---|---|---|---|---|---|---|---|---|---|---|---|---|---|---|---|---|---|---|---|---|---|---|---|---|---|---|---|---|---|---|---|---|---|---|---|---|---|---|---|---|---|---|---|---|---|---|---|---|---|---|---|---|---|---|---|---|---|---|---|---|
| 2013 Sep 1 - 2016 Feb 27 | Evidence from Observations: Reported | ||||||||||||||||||||||||||||||||||||||||||||||||||||||||||||||||||||||||||||||||||||||||||||||||||||||||||||||||||||||||||||||||||||||||||||||||||||||||||||||||||||||||||||||||||||||||||||||||||||||||||||||||||||||||||||||||||||||||||||||||||||||||||||||||||||||||||||||||||||||||||||||||||||||||||||||||||||||||||||||||||||||||||||||||||||||||||||||||||||||||||||||||||||||||||||||||||||||||||||||||||||||||||||||||||||||||||||||||||||||||||||||||||||||||||||||||||||||||||||||||||||||||||||||||||||||||||||||||||||||||||||||||
|
List of 104 Events for Episode 1 at Summit crater
|
|||||||||||||||||||||||||||||||||||||||||||||||||||||||||||||||||||||||||||||||||||||||||||||||||||||||||||||||||||||||||||||||||||||||||||||||||||||||||||||||||||||||||||||||||||||||||||||||||||||||||||||||||||||||||||||||||||||||||||||||||||||||||||||||||||||||||||||||||||||||||||||||||||||||||||||||||||||||||||||||||||||||||||||||||||||||||||||||||||||||||||||||||||||||||||||||||||||||||||||||||||||||||||||||||||||||||||||||||||||||||||||||||||||||||||||||||||||||||||||||||||||||||||||||||||||||||||||||||||||||||||||||||
[ 2010 Jul 18 - 2010 Jul 18 ] Uncertain Eruption
| Episode 1 | Eruption (Explosive / Effusive) | |||||||||||||||||||
|---|---|---|---|---|---|---|---|---|---|---|---|---|---|---|---|---|---|---|---|
| 2010 Jul 18 - 2010 Jul 18 | Evidence from Observations: Aviation | ||||||||||||||||||
|
List of 2 Events for Episode 1
|
|||||||||||||||||||
2006 Mar 25 (?) - 2009 Jul 4 (?) Confirmed Eruption (Explosive / Effusive) VEI: 2
| Episode 1 | Eruption (Explosive / Effusive) | ||||||||||||||||||||||||||||||||||||||||||||||||||||||||||||||||
|---|---|---|---|---|---|---|---|---|---|---|---|---|---|---|---|---|---|---|---|---|---|---|---|---|---|---|---|---|---|---|---|---|---|---|---|---|---|---|---|---|---|---|---|---|---|---|---|---|---|---|---|---|---|---|---|---|---|---|---|---|---|---|---|---|
| 2006 Mar 25 (?) - 2009 Jul 4 (?) | Evidence from Observations: Reported | |||||||||||||||||||||||||||||||||||||||||||||||||||||||||||||||
|
List of 11 Events for Episode 1
|
||||||||||||||||||||||||||||||||||||||||||||||||||||||||||||||||
1969 Jun 16 ± 15 days Confirmed Eruption (Explosive / Effusive) VEI: 2 (?)
| Episode 1 | Eruption (Explosive / Effusive) | |||||||||||||||||||||||||||||
|---|---|---|---|---|---|---|---|---|---|---|---|---|---|---|---|---|---|---|---|---|---|---|---|---|---|---|---|---|---|
| 1969 Jun 16 ± 15 days - Unknown | Evidence from Observations: Reported | ||||||||||||||||||||||||||||
|
List of 4 Events for Episode 1
|
|||||||||||||||||||||||||||||
1956 May 16 ± 15 days - 1956 Oct 21 Confirmed Eruption (Explosive / Effusive) VEI: 2
| Episode 1 | Eruption (Explosive / Effusive) | |||||||||||||||||||||||||||||
|---|---|---|---|---|---|---|---|---|---|---|---|---|---|---|---|---|---|---|---|---|---|---|---|---|---|---|---|---|---|
| 1956 May 16 ± 15 days - 1956 Oct 21 | Evidence from Observations: Reported | ||||||||||||||||||||||||||||
|
List of 4 Events for Episode 1
|
|||||||||||||||||||||||||||||
1951 Jul 23 ± 8 days Confirmed Eruption (Explosive / Effusive) VEI: 2
| Episode 1 | Eruption (Explosive / Effusive) | ||||||||||||||||||||||||
|---|---|---|---|---|---|---|---|---|---|---|---|---|---|---|---|---|---|---|---|---|---|---|---|---|
| 1951 Jul 23 ± 8 days - Unknown | Evidence from Observations: Reported | |||||||||||||||||||||||
|
List of 3 Events for Episode 1
|
||||||||||||||||||||||||
1937 Jun Confirmed Eruption (Explosive / Effusive) VEI: 2
| Episode 1 | Eruption (Explosive / Effusive) | ||||||||||||||||||||||||
|---|---|---|---|---|---|---|---|---|---|---|---|---|---|---|---|---|---|---|---|---|---|---|---|---|
| 1937 Jun - Unknown | Evidence from Observations: Reported | |||||||||||||||||||||||
|
List of 3 Events for Episode 1
|
||||||||||||||||||||||||
1907 Confirmed Eruption (Explosive / Effusive) VEI: 2
| Episode 1 | Eruption (Explosive / Effusive) | |||||||||||||||||||
|---|---|---|---|---|---|---|---|---|---|---|---|---|---|---|---|---|---|---|---|
| 1907 - Unknown | Evidence from Observations: Reported | ||||||||||||||||||
|
List of 2 Events for Episode 1
|
|||||||||||||||||||
1906 Oct Confirmed Eruption (Explosive / Effusive) VEI: 2
| Episode 1 | Eruption (Explosive / Effusive) | |||||||||||||||||||
|---|---|---|---|---|---|---|---|---|---|---|---|---|---|---|---|---|---|---|---|
| 1906 Oct - Unknown | Evidence from Observations: Reported | ||||||||||||||||||
|
List of 2 Events for Episode 1
|
|||||||||||||||||||
1869 Oct Confirmed Eruption (Explosive / Effusive) VEI: 2
| Episode 1 | Eruption (Explosive / Effusive) | |||||||||||||||||||
|---|---|---|---|---|---|---|---|---|---|---|---|---|---|---|---|---|---|---|---|
| 1869 Oct - Unknown | Evidence from Observations: Reported | ||||||||||||||||||
|
List of 2 Events for Episode 1
|
|||||||||||||||||||
1867 May 24 - 1867 May 28 Confirmed Eruption (Explosive / Effusive) VEI: 2
| Episode 1 | Eruption (Explosive / Effusive) | |||||||||||||||||||
|---|---|---|---|---|---|---|---|---|---|---|---|---|---|---|---|---|---|---|---|
| 1867 May 24 - 1867 May 28 | Evidence from Observations: Reported | ||||||||||||||||||
|
List of 2 Events for Episode 1
|
|||||||||||||||||||
1865 Confirmed Eruption (Explosive / Effusive) VEI: 2
| Episode 1 | Eruption (Explosive / Effusive) | ||||||||||||||||||||||||
|---|---|---|---|---|---|---|---|---|---|---|---|---|---|---|---|---|---|---|---|---|---|---|---|---|
| 1865 - Unknown | Evidence from Observations: Reported | |||||||||||||||||||||||
|
List of 3 Events for Episode 1
|
||||||||||||||||||||||||
1862 Confirmed Eruption (Explosive / Effusive) VEI: 2
| Episode 1 | Eruption (Explosive / Effusive) | |||||||||||||||||||
|---|---|---|---|---|---|---|---|---|---|---|---|---|---|---|---|---|---|---|---|
| 1862 - Unknown | Evidence from Observations: Reported | ||||||||||||||||||
|
List of 2 Events for Episode 1
|
|||||||||||||||||||
1830 Confirmed Eruption (Explosive / Effusive) VEI: 2
| Episode 1 | Eruption (Explosive / Effusive) | |||||||||||||||||||
|---|---|---|---|---|---|---|---|---|---|---|---|---|---|---|---|---|---|---|---|
| 1830 - Unknown | Evidence from Observations: Reported | ||||||||||||||||||
|
List of 2 Events for Episode 1
|
|||||||||||||||||||
[ 1826 ] Uncertain Eruption
| Episode 1 | Eruption (Explosive / Effusive) | ||||
|---|---|---|---|---|
| 1826 - Unknown | Evidence from Unknown | |||
1784 Confirmed Eruption (Explosive / Effusive) VEI: 2
| Episode 1 | Eruption (Explosive / Effusive) | |||||||||||||||||||
|---|---|---|---|---|---|---|---|---|---|---|---|---|---|---|---|---|---|---|---|
| 1784 - Unknown | Evidence from Observations: Reported | ||||||||||||||||||
|
List of 2 Events for Episode 1
|
|||||||||||||||||||
1677 Confirmed Eruption (Explosive / Effusive) VEI: 3 (?)
| Episode 1 | Eruption (Explosive / Effusive) | ||||||||||||||||||||||||||||||||||
|---|---|---|---|---|---|---|---|---|---|---|---|---|---|---|---|---|---|---|---|---|---|---|---|---|---|---|---|---|---|---|---|---|---|---|
| 1677 - Unknown | Evidence from Observations: Reported | |||||||||||||||||||||||||||||||||
|
List of 5 Events for Episode 1
|
||||||||||||||||||||||||||||||||||
1667 Confirmed Eruption (Explosive / Effusive) VEI: 3
| Episode 1 | Eruption (Explosive / Effusive) | ||||||||||||||||||||||||
|---|---|---|---|---|---|---|---|---|---|---|---|---|---|---|---|---|---|---|---|---|---|---|---|---|
| 1667 - Unknown | Evidence from Observations: Reported | |||||||||||||||||||||||
|
List of 3 Events for Episode 1
|
||||||||||||||||||||||||
1662 Confirmed Eruption (Explosive / Effusive) VEI: 3 (?)
| Episode 1 | Eruption (Explosive / Effusive) | ||||||||||||||||||||||||
|---|---|---|---|---|---|---|---|---|---|---|---|---|---|---|---|---|---|---|---|---|---|---|---|---|
| 1662 - Unknown | Evidence from Observations: Reported | |||||||||||||||||||||||
|
List of 3 Events for Episode 1
|
||||||||||||||||||||||||
[ 1600 ] Uncertain Eruption
| Episode 1 | Eruption (Explosive / Effusive) | ||||||||||||||
|---|---|---|---|---|---|---|---|---|---|---|---|---|---|---|
| 1600 - Unknown | Evidence from Unknown | |||||||||||||
|
List of 1 Events for Episode 1
|
||||||||||||||
1550 ± 50 years Confirmed Eruption (Explosive / Effusive) VEI: 3 (?)
| Episode 1 | Eruption (Explosive / Effusive) | ||||||||||||||||||||||||
|---|---|---|---|---|---|---|---|---|---|---|---|---|---|---|---|---|---|---|---|---|---|---|---|---|
| 1550 ± 50 years - Unknown | Evidence from Observations: Reported | |||||||||||||||||||||||
|
List of 3 Events for Episode 1
|
||||||||||||||||||||||||
1082 ± 82 years Confirmed Eruption (Explosive / Effusive) VEI: 5
| Episode 1 | Eruption (Explosive / Effusive) | |||||||||||||||||||||||||||||||||||||||
|---|---|---|---|---|---|---|---|---|---|---|---|---|---|---|---|---|---|---|---|---|---|---|---|---|---|---|---|---|---|---|---|---|---|---|---|---|---|---|---|
| 1082 ± 82 years - Unknown | Evidence from Isotopic: 14C (calibrated) | ||||||||||||||||||||||||||||||||||||||
|
List of 6 Events for Episode 1
|
|||||||||||||||||||||||||||||||||||||||
6850 BCE ± 150 years Confirmed Eruption (Explosive / Effusive)
| Episode 1 | Eruption (Explosive / Effusive) | ||||||||||||||||||||||||
|---|---|---|---|---|---|---|---|---|---|---|---|---|---|---|---|---|---|---|---|---|---|---|---|---|
| 6850 BCE ± 150 years - Unknown | Evidence from Isotopic: 14C (calibrated) | |||||||||||||||||||||||
|
List of 3 Events for Episode 1
|
||||||||||||||||||||||||
8560 BCE ± 300 years Confirmed Eruption (Explosive / Effusive)
| Episode 1 | Eruption (Explosive / Effusive) | ||||||||||||||||||||||||
|---|---|---|---|---|---|---|---|---|---|---|---|---|---|---|---|---|---|---|---|---|---|---|---|---|
| 8560 BCE ± 300 years - Unknown | Evidence from Isotopic: 14C (calibrated) | |||||||||||||||||||||||
|
List of 3 Events for Episode 1
|
||||||||||||||||||||||||
This compilation of synonyms and subsidiary features may not be comprehensive. Features are organized into four major categories: Cones, Craters, Domes, and Thermal Features. Synonyms of features appear indented below the primary name. In some cases additional feature type, elevation, or location details are provided.
Synonyms |
| Uvillas | Uvinas |
There are no samples for Ubinas in the Smithsonian's NMNH Department of Mineral Sciences Rock and Ore collection.
| Copernicus Browser | The Copernicus Browser replaced the Sentinel Hub Playground browser in 2023, to provide access to Earth observation archives from the Copernicus Data Space Ecosystem, the main distribution platform for data from the EU Copernicus missions. |
| MIROVA | Middle InfraRed Observation of Volcanic Activity (MIROVA) is a near real time volcanic hot-spot detection system based on the analysis of MODIS (Moderate Resolution Imaging Spectroradiometer) data. In particular, MIROVA uses the Middle InfraRed Radiation (MIR), measured over target volcanoes, in order to detect, locate and measure the heat radiation sourced from volcanic activity. |
| MODVOLC Thermal Alerts | Using infrared satellite Moderate Resolution Imaging Spectroradiometer (MODIS) data, scientists at the Hawai'i Institute of Geophysics and Planetology, University of Hawai'i, developed an automated system called MODVOLC to map thermal hot-spots in near real time. For each MODIS image, the algorithm automatically scans each 1 km pixel within it to check for high-temperature hot-spots. When one is found the date, time, location, and intensity are recorded. MODIS looks at every square km of the Earth every 48 hours, once during the day and once during the night, and the presence of two MODIS sensors in space allows at least four hot-spot observations every two days. Each day updated global maps are compiled to display the locations of all hot spots detected in the previous 24 hours. There is a drop-down list with volcano names which allow users to 'zoom-in' and examine the distribution of hot-spots at a variety of spatial scales. |
|
WOVOdat
Single Volcano View Temporal Evolution of Unrest Side by Side Volcanoes |
WOVOdat is a database of volcanic unrest; instrumentally and visually recorded changes in seismicity, ground deformation, gas emission, and other parameters from their normal baselines. It is sponsored by the World Organization of Volcano Observatories (WOVO) and presently hosted at the Earth Observatory of Singapore.
GVMID Data on Volcano Monitoring Infrastructure The Global Volcano Monitoring Infrastructure Database GVMID, is aimed at documenting and improving capabilities of volcano monitoring from the ground and space. GVMID should provide a snapshot and baseline view of the techniques and instrumentation that are in place at various volcanoes, which can be use by volcano observatories as reference to setup new monitoring system or improving networks at a specific volcano. These data will allow identification of what monitoring gaps exist, which can be then targeted by remote sensing infrastructure and future instrument deployments. |
| Volcanic Hazard Maps | The IAVCEI Commission on Volcanic Hazards and Risk has a Volcanic Hazard Maps database designed to serve as a resource for hazard mappers (or other interested parties) to explore how common issues in hazard map development have been addressed at different volcanoes, in different countries, for different hazards, and for different intended audiences. In addition to the comprehensive, searchable Volcanic Hazard Maps Database, this website contains information about diversity of volcanic hazard maps, illustrated using examples from the database. This site is for educational purposes related to volcanic hazard maps. Hazard maps found on this website should not be used for emergency purposes. For the most recent, official hazard map for a particular volcano, please seek out the proper institutional authorities on the matter. |
| IRIS seismic stations/networks | Incorporated Research Institutions for Seismology (IRIS) Data Services map showing the location of seismic stations from all available networks (permanent or temporary) within a radius of 0.18° (about 20 km at mid-latitudes) from the given location of Ubinas. Users can customize a variety of filters and options in the left panel. Note that if there are no stations are known the map will default to show the entire world with a "No data matched request" error notice. |
| UNAVCO GPS/GNSS stations | Geodetic Data Services map from UNAVCO showing the location of GPS/GNSS stations from all available networks (permanent or temporary) within a radius of 20 km from the given location of Ubinas. Users can customize the data search based on station or network names, location, and time window. Requires Adobe Flash Player. |
| DECADE Data | The DECADE portal, still in the developmental stage, serves as an example of the proposed interoperability between The Smithsonian Institution's Global Volcanism Program, the Mapping Gas Emissions (MaGa) Database, and the EarthChem Geochemical Portal. The Deep Earth Carbon Degassing (DECADE) initiative seeks to use new and established technologies to determine accurate global fluxes of volcanic CO2 to the atmosphere, but installing CO2 monitoring networks on 20 of the world's 150 most actively degassing volcanoes. The group uses related laboratory-based studies (direct gas sampling and analysis, melt inclusions) to provide new data for direct degassing of deep earth carbon to the atmosphere. |
| Large Eruptions of Ubinas | Information about large Quaternary eruptions (VEI >= 4) is cataloged in the Large Magnitude Explosive Volcanic Eruptions (LaMEVE) database of the Volcano Global Risk Identification and Analysis Project (VOGRIPA). |
| EarthChem | EarthChem develops and maintains databases, software, and services that support the preservation, discovery, access and analysis of geochemical data, and facilitate their integration with the broad array of other available earth science parameters. EarthChem is operated by a joint team of disciplinary scientists, data scientists, data managers and information technology developers who are part of the NSF-funded data facility Integrated Earth Data Applications (IEDA). IEDA is a collaborative effort of EarthChem and the Marine Geoscience Data System (MGDS). |


 Volcán Ubinas, seen here from the west, is Perú's most active volcano. A small, 1.2-km-wide caldera that cuts the top of Ubinas gives it a truncated appearance. The upper slopes of the stratovolcano steepen to nearly 45 degrees. The steep-walled, 150-m-deep caldera contains an ash cone with a 500-m-wide funnel-shaped vent that is 200-m deep. Holocene lava flows are visible on the volcano's flanks, but historical activity, documented since the 16th century, has consisted of intermittent minor explosive eruptions.