
Water temperatures and chemistry
A study of the geochemical evolution of Carbet l'Echelle spring, continued during 1981 and 1982 (figure 10). The water temperature decreased from 62.5°C in January 1981 to 50° in September 1982, while the concentration of HCO3 ions continued to increase (+ 30%). Moreover, although large variations in Cl concentration have been observed since 1979, the background level of Cl began to fall in September 1981 and was reduced by half in one year. Likewise, the concentration of F ions, which has oscillated around a constant value since the beginning of the survey, decreased slightly in late 1982. Water temperatures and chemistry remained nearly constant at the other springs monitored by this study.
Further References: Bigot, S., and Hammouya, G., 1987, Surveillance hydrogéochimique de la Soufrière de Guadeloupe, 1979-1985: Diminuition d'activité ou confinement?: C.R. Acad. Sci. Paris, t. 304, Série II, no. 13, p. 757-760.
Observations volcanologiques: Rapport d'Activité des Observatoires Volcanologiques des Antilles (Guadeloupe-Martinique) - November 1976-April 1977, April 1977-December 1978, 1979, 1980, 1981, 1982, and 1983-1984: Institut de Physique du Globe, Paris.
Information Contacts: S. Bigot, Lab. de Géochemie, Paris; G. Hammouya, Lab. de Physique du Globe; J. Le Mouel, J. Cheminée, IPG, Paris.
The Global Volcanism Program has no Weekly Reports available for Soufrière Guadeloupe.
Reports are organized chronologically and indexed below by Month/Year (Publication Volume:Number), and include a one-line summary. Click on the index link or scroll down to read the reports.
Seismic crisis during November 1975-April 1976; no surface activity
The recent seismic crisis began in November 1975 when 25 tremors were recorded. Thirty tremors were registered in December, 36 in January 1976, 93 in February, and 680 in March (of which 1/3 were felt by inhabitants very near the volcano). The crisis was declining at the end of April. The foci of the tremors were under the NW part of Soufrière, and depths of focus varied from 1 to 5 km.
No new surface manifestations accompanied or followed these tremors (up to 9 April). There were no modifications of temperatures nor of the composition of gases emitted by the fumaroles. An overflight of the volcano did not indicate any sign of abnormal activity on the surface. . . .
Local earthquake swarms are rather frequent at volcanoes of this type. They have taken place approximately once per year on Guadeloupe since 1962, but none have reached the frequency of March 1976. The same phenomenon has previously occurred on neighboring islands (Montserrat 1966, St. Kitts in 1950 and 1961, and St. Vincent 1947) without any eruption.
J. Dorel believes that, for the present time, there is no important risk of an eruption of this volcano, but that it is impossible to make a long-term (several months or years) prognostication on the evolution of such volcanoes.
Information Contacts: J. Dorel, IPG, Paris.
Phreatic eruption on 8 July; crack opens in summit dome
On 8 July at approximately 0900, a phreatic eruption began at Soufrière (figure 1). A new crack, 300 m long [but see 1:10] and up to 10 m wide, opened down the SE side of the summit dome. Steam and gas with ash and lava fragments were blowing through the crack on that day, but on 9 July there were only steam and gas with no solids. The eruption appeared to be purely phreatic, with no molten material reported.
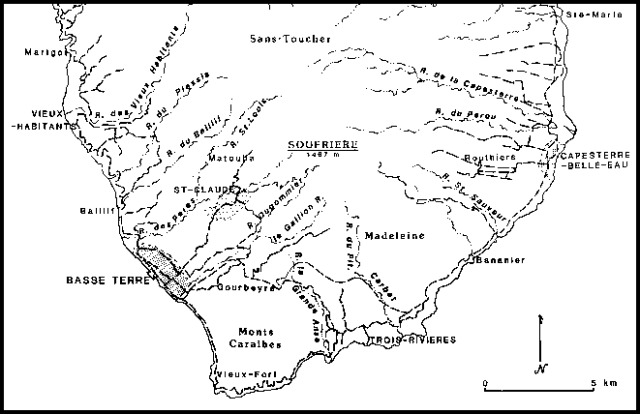 |
Figure 1. Map of the S part of Basse-Terre (one of the islands that comprise Guadeloupe). After Guadeloupe Tourist Map, 1:100,000, Institut Géographique National, 1982. |
On the 9th the gas and steam were venting at a "vast rate," and the column rose ~300 m above the crack. Steam and gas venting was continuing as of this report, but the activity appeared to be slowing down. It was not possible to ascertain the height of the steam column because of clouds. It is believed that local earthquakess occurred just before the eruptive activity began; longer-term premonitory seismicity was described in 1:8.
A phreatic eruption occurred in 1956 from a fracture across the top of the dome (figure 2), but the current eruption is bigger in that the crack is longer and the volume of products is greater. There were comparable phreatic eruptions in [1837-38] and 1797, each lasting a few days. The present activity appears to be following the pattern of these previous eruptions. Radiocarbon evidence indicates that there was a large magmatic eruption about 1500 A.D.
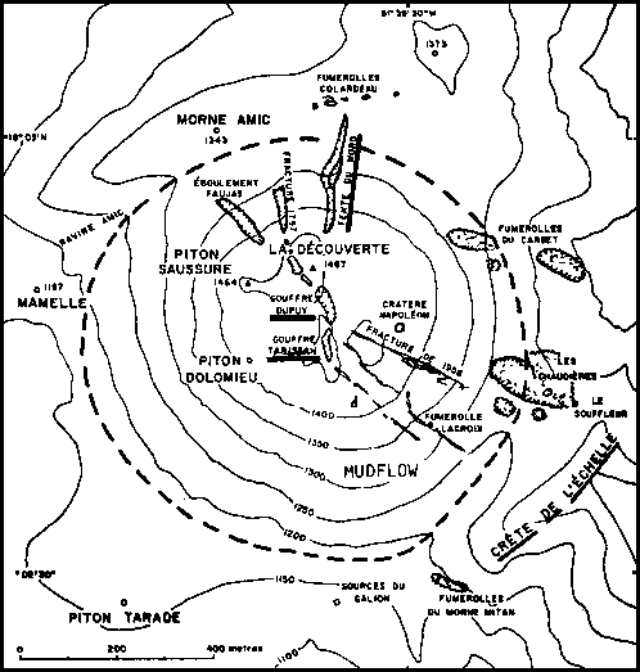 |
Figure 2. Map of the summit of Soufrière volcano, Guadeloupe, after Catalog of Active Volcanoes of the World. Heights are in meters. |
In general characteristics Soufrière is comparable to the Martinique and St. Vincent volcanoes, which are capable of extremely violent activity.
Information Contacts: J. Tomblin, UWI; Lab. de Physique du Globe.
Additional details about 8 July phreatic explosion; summary of activity during 21 July-25 August 1976
Since March 1976 a great number of volcanic earthquakes have been registered by the seismic array of the Observatory of St. Claude, Guadeloupe. The earthquakes numbered about 607 in March, 747 in April, 611 in May, and 668 in June. Most foci were distributed between 2 and 6 km under the volcano, along a NW-SE axis. Many earthquakes were felt by people living near Soufrière. The maximum magnitude was 3.8.
On 8 July at 0856, the volcano threw out a column of fine sand and dust, plunging the surrounding regions into darkness for 40 minutes. This fine volcanic material settled over the W side of the mountain and extended to the towns of Basse-Terre and Vieux-Habitants, on the W coast of Guadeloupe 8 km away. The thickness of this grey tephra was very irregular because of the influence of winds: about 8 cm near the summit to 1 or 2 cm near Basse-Terre. This eruption was followed by steam and gases rising from a new fracture 400 m long on the SE flank of the cone. A little avalanche (800 m long) of mud and rocks from this fracture accompanied the eruption.
Since 8 July the pressure of the gases has decreased and the temperature has remained around 96°C, but the volcanic seismicity remains important (300 earthquakes registered 9-20 July). A group of scientists from IPG, Commissariat à l'Energie Atomique, and the Université de Paris Sud, is investigating this eruption. They concluded that the eruption is phreatic (like the eruptions in 1956, [1837-38], and 1797). The chemical composition of the volcanic sand is the same as that of 1956 and corresponds to the composition of the old material of the cone (SiO2 = 57.8%). No new magma was emitted during this eruption.
Addendum: Summary of eruptive and seismic activity 25 July-1 September. Earthquake hypocenters are given in kilometers below sea level unless otherwise noted. [Corrections and additions to this addendum supplied by J. Gautheyrou and LANL, originally printed in 1:11, have been incorporated here.]
25 July: Significant ash eruption.
09 August: Ash eruption, causing a small river to stop flowing for 24 hours. When flow resumed, the water was very muddy.
12 August: Powerful new ash eruption containing juvenile material [but see 1:12]. Evacuation of 72,000 persons began (figure 3); evacuation was completed 15 August.
16 August: Very fine ash erupted from the fissure that opened 8 July. At 1730 a magnitude 4.6 earthquake with a hypocenter at about 2.5 km occurred, followed by 20 minutes of very frequent tremors that saturated a detector 8 km from the volcano for about 10 minutes.
17 August: Approximately 900 earthquakes were recorded in the 24 hours after the beginning of the 16 August seismic crisis. Depths of focus ranged from 1 to 3 km. An earthquakes registering about 4.0 occurred at 2315. An expedition to the volcano noted weaker gas pressure and a new 5-cm ashfall at the foot of the dome. Mudflows were forming from the new ash because of heavy rainfall. At 1700 the principal vent was puffing and a plume of fine particles was being emitted from the N fracture. The 1,500 residents of Vieux-Fort were evacuated. Microprobe analysis of earlier 1976 ejecta indicated andesitic magma at ~900°C.
18 August: The volcano was quiet enough to allow the temporary return of farmers. Earthquake foci were about 2.5 km deep.
19 August: About 1 mm of fine dust was found on the dome. 95% of the erupted material was <0.2 mm in diameter; the coarsest was 2 mm mushroom-colored glass. Dust made breathing difficult in a sector from Basse Terre to Bouillante. Earthquake hypocenters were at about 2.5 km depth.
20 August: There was a steady, non-explosive emission of steam rising to <300 m.
21 August: A major increase in the SO2 content of gases sampled was followed in about 8 hours by 11 minutes of harmonic tremor, beginning at 2326. All instruments were saturated for the first 3 minutes. An ash eruption, probably coinciding with the harmonic tremor, left a few centimeters of ash at the base of the dome, 3 mm 1/3 of the way up the mountain, and ~1 mm on the S coast. An expedition the following day discovered that the SE fracture had been widened and that blocks up to 1 m across had been blown 400 m to the old rim (L'Echelle). Hypocenters of recorded earthquakes were at or above sea level.
22 August: More than 100 of the 156 recorded earthquakes occurred by 0800. Activity then declined. Emission of steam and other gases occurred from vents south of the summit dome (Gouffre Tarissan, Pont Chinois and Gouffre Dupuy). Rain caused a mudflow in the Galion River.
23 August: An increase in radon emission during the afternoon predicted an increase in activity; minor dust emissions were reported.
24 August: A period of major seismic activity began at 0256 with a M 4.1 event centered 2 km under the W side of Soufrière. More than 1,000 earthquakes were recorded by 1530 (figure 4), two of which were felt in Pointe-a-Pitre, 20 km away. Intervals between events and earthquake amplitudes were both decreasing by afternoon. Radon percentage in the gas increased with increased seismicity. SO2 had returned to normal. Minor dust emission continued. 50 cm of dust, largely composed of fresh glass, was present at the S side of the summit dome (Gouffre Tarissan).
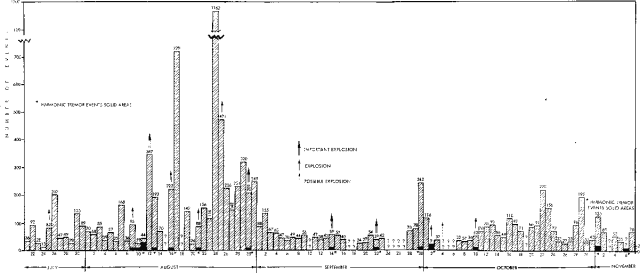 |
Figure 4. Number of recorded seismic events per day at Soufrière Guadeloupe, 21 July-7 November 1976. |
25 August: The volume of ash erupted increased significantly and the eruption clouds were much darker after 1530. Ash emission was from the S and E vents (Gouffre Tarissan and Dent de l'Est). Study of the tephra erupted since the 24 August seismic crisis indicates both an increase in the percentage of fresh glass and an increase (to 2 mm) in the size of the glass shards. The percentage of chemical weathering products in the ejecta also increased. Between 2000 on 25 August and 0600 on 26 August, 120 earthquakes were recorded, some having hypocenters as shallow as 300 m above sea level. Gas analyses showed lower percentages of SO2, SO3, and H2S than for previous days. Radon again increased during seismic crises.
26 August: A 100-200 m column of ash was erupted continuously from Gouffre Tarissan (the main vent at the top of the dome) and from the upper end of the SE fracture. The remainder of the SE fracture emitted steam that was almost entirely of meteoric origin. The 26 August ash was dry, and therefore paler than the wet ash of 25 August. The ash was blown W; 2 cm were deposited on the W slopes of the dome and 1-2 mm on the W coast towns. Approximately 50% of the ash was juvenile glass [but see 1:12]. Ash emission ended in the morning. The magmatic component of the emitted gases was low.
27 August: Considerable steam was emitted, along with some dust. Fresh glass was erupted from Pont Chinois and the N fracture. SO2 and H2S were present in small amounts in the volcanic gases.
28 August: An expedition to the dome found 1 m of very fine dust around Gouffre Tarissan and a few centimeters of dust along the flanks of the dome. One block a few centimeters across was found near the top of the dome.
29 August: A 10 µrad inflation of the volcano had occurred since 28 August. Eruptive activity was limited to minor ash emission. Earthquake hypocenters 27-29 August were all shallower than 3 km; all but four were shallower than 2 km, and one was above sea level. No ash emission occurred 28-29 August. The gases analyzed were almost entirely of meteoric origin.
30 August: A small eruption occurred at 1015 from the main vent, accompanied by 22 minutes of harmonic tremor, the first 13 minutes of which saturated the instruments. A party of seven volcanologists was showered by blocks up to 1 m across; four were injured but none seriously. 209 earthquakes were recorded. The ash, analyzed by the LANL, is 95% alteration products (fine-grained clayey material and pyrite) and 5% rock and crystal fragments (andesite, plagioclase, and pyroxene). Volatile content was high, and there was no fresh glass.
31 August: Large volumes of steam with some admixed ash erupted from all of the previously active vents. The steam cloud from the main vent reached 2,000 m altitude in the evening due to light winds. 6-8 cm of juvenile ash (80% glass), which flocculated into 5 mm flakes as it fell, was deposited near the main vent, as were blocks up to 20 cm across that were torn from the vent and blown up to 400 m away. A new earthquake swarm began at 1035 and lasted for 6-8 hours, accounting for most of the 249 seismic events recorded 31 August. A total of 5989 earthquakes were recorded in August, 43 of which were felt.
1 September: Strong steam emission continued, producing cauliflower clouds that reached a height of 300 m before being blown W. A grayish-brown haze of very fine ash was falling on the top quarter of the volcano.
Information Contacts: J. Dorel, IPG, Paris; J. Gautheyrou, ORSTOM; J. Tomblin, UWI; M. Feuillard, Lab. de Physique du Globe; LANL.
Summary of activity during 2-15 September 1976
2 September: Heavy steam emission from all vents continued after the 30 August eruption. Ash emission was slight. Several loud, booming reports were heard in rapid succession at 1600.
3-7 September: Surface activity diminished. No significant ash eruption occurred. Tilt measurements showed a very slight movement downwards to the NW through 5 September; a 2-3 µrad deflation was noted between 6 and 7 September. Mean earthquake focal depth increased to ~3 km.
7-9 September: Eruptive activity was limited to mild steaming. Gas analysis yielded low values for acid gases (SO2, F2, and fluorides). The magnetic anomaly increased slightly. Mean focal depths were 2.5 km (based on 4 events) on 8 September, increasing to 3.4 km (based on three events) on 9 September.
10-13 September: Mild steaming continued; only small amounts of gases other than H2O were present. At 0418 on 13 September a M 3 earthquake occurred, centered under St. Claude (SW of the summit).
14 September: A summit eruption, lasting between 5 and 9 minutes, began at 1922, 15.4 days after the last significant eruption. Juergen Kienle (University of Alaska) had predicted an eruption between 14 and 18 September, a period centered around the lunar last quarter on 16 September. Immediately prior to the eruption, tilt at the summit went off scale. Loud noise was heard, but cloud cover at the summit prevented visual observation. Harmonic tremor accompanied the eruption, saturating seismographs for the first 4 minutes. Inspection of the summit area revealed airfall ash as far away as St. Claude (4.5 km SW of the summit) and Vieux Habitants (11 km W of the summit). Tom McGetchin reported that a small directed blast, originating from a fissure just S of the main vent, defoliated vegetation up to 500 m away.
15 September: Eruptive activity was confined to steaming and minor ash emission.
Local seismic energy release from mid-July to mid-September was calculated at the University of the West Indies (table 1).
Table 1. Total local earthquake energy for each of six 10-day periods and one 8-day period, 8 July-13 September 1976. Calculated using the formula log E = 9.4 + 2.14 M + 0.054 m2 by the Seismic Research Unit, University of the West Indies.
| Dates | Total Local Earthquake Energy (Ergs) | Comment |
| 08 Jul-17 Jul 1976 | 3.0 x 10¹⁷ | Initial steam explosion 8 July. |
| 18 Jul-27 Jul 1976 | 6.3 x 10¹⁷ | -- |
| 28 Jul-06 Aug 1976 | 1.6 x 10¹⁸ | -- |
| 07 Aug-16 Aug 1976 | 2.27 x 10¹⁹ | Evacuation began 12 August. |
| 27 Aug-05 Sep 1976 | 1.72 x 10¹⁹ | -- |
| 06 Sep-13 Sep 1976 | 4.63 x 10¹⁶ | 8-day period. |
Dry tilt stations were installed 28 August by the USGS and are being relevelled daily by George Jezouin, government engineer (table 2).
Table 2. Data from three USGS dry-tilt stations (with azimuth and distance to summit) on the SW flank of Soufrière, August-September 1976. All values are expressed in µrad vectored towards or away from the summit. Positive values represent inflation.
| Date | Bonne Terre (N47°E, 5 km) | Parnasse (N66°E, 3 km) | Savane à Mulets (N10°E, 1 km) |
| 29 Aug 1976 | 10 µrad inflation; no station data | ||
| 31 Aug 1976 | -4.1 | -7.0 | +32.0 |
| 02 Sep 1976 | 0.0 | +5.0 | -9.0 |
| 03 Sep 1976 | +3.0 | -4.0 | -6.0 |
| 04 Sep 1976 | -3.0 | -6.0 | -4.5 |
| 06 Sep 1976 | +5.0 | -4.0 | +2.5 |
| 07 Sep 1976 | 0.0 | -7.0 | -- |
| 08 Sep 1976 | -3.5 | -5.0 | 0.0 |
| 09 Sep 1976 | +2.3 | +3.8 | -- |
| 10 Sep 1976 | Deflation; no figures | ||
| 12 Sep 1976 | Inflation; no figures | ||
| 13 Sep 1976 | Inflation; no figures | ||
| 14 Sep 1976 | +5.0 | 0.0 | 0.0 |
Raw data from the LANL borehole tiltmeter array appear to be generally compatible with the dry tilt figures. 5-10 µrad tilt events occurring over about 10-minute time spans have been recorded simultaneously at more than one tilt station.
Seismic velocity profiles (18 shot points on land, 2-3 in the ocean) were being run 16 and 17 September by a French team. Velocities previously used to calculate focal depths were estimates which may have been too high. The French scientific team is responsible for gas sampling, magnetic readings and seismic recording as well as overseeing all scientific work on the volcano. The LANL is operating a camera station at Fort St. Charles and plans to establish another at Pointe-à-Pitre. Juergen Kienle is running a daily gravity survey. Michael Sheridan (Arizona State Univ.) is studying pyroclastic flow deposits from past eruptions.
Information Contacts: J. Tomblin and W. Aspinall, UWI; T. McGetchin, LANL.
Variable activity continues; ash eruption on 22 September
16 September: Heavy steaming occurred from the S and SE sides of the summit dome. Differential magnetometer readings increased at the summit and decreased at Matouba with respect to a base station at Basse Terre.
17-19 September: Large inflation was shown by LANL tilt stations to continue through the 18th. Deflation was observed by the same stations on the 19th. Sulfur was noted in the gases on the 18th. Eruptive activity was minor.
20 September: A seismic event occurred at 0100. LANL reports that the tilt, gravity, differential magnetometry, and seismicity each showed distinctive patterns prior to this event, similar to the patterns noted before the 14 September activity. These data have yet to be interpreted in terms of a magma chamber model. LANL noted approximately 10 µrad inflation at the summit, and ~5 µrad deflation at lower tilt stations during the the 24 hours after the event.
21 September: Eruptive activity was minor.
22 September: An ash eruption, producing a 3,500-m cloud, occurred at 0645, accompanied by 18 minutes of harmonic tremor, 6 minutes of which saturated seismographs. About 1 cm of ash fell downwind at Baillif-Vieux-Habitants. Ash was sampled from a 1-mm deposit near the S edge of the ashfall area.
23 September: Strong steaming, possibly with some ash emission, was occasionally visible through heavy clouds.
24-27 September: The activity stabilized to moderate steaming and minor ash emission. LANL recorded a large tilt episode, beginning at 2300 on the 27th and lasting several hours.
28 September: A 300-m plume was visible for much of the day. At 1010 an earthquake occurred that was felt in Pointe-a-Pitre. Seventy minutes later, LANL recorded the beginning of deflation. The tilt and seismic data are thought by LANL to indicate cavity collapse.
29 September: LANLLASL reported the beginning of inflation at 1445, then deflation at 1745.
30 September: A 20-minute period of tremors began at 0002. Two large and four small events were recorded. Cavity collapse was again suggested by LANL as an explanation for the seismic episode.
In other tilt experiments, R.S. Fiske and W.T. Kinoshita, supported by the USGS, SI, and OFDA, established four dry-tilt arrays on the SW flank of Soufrière in late August. These four arrays are at about 1, 3, 4, and 5 km from the summit. More than 25 reoccupations of these arrays (29 August-30 September) by French technicians have indicated daily station "noise" sometimes exceeding 5 µrad, but the suggestion of true volcano inflation has been recorded only at the station 5 km from the summit. The bulk of the dry-tilt data gathered to date therefore do not indicate that the volcano is being deformed as a result of the inflation of a magma reservoir. This tentative conclusion is supported by measurements of P.A. Blum, who installed two pendulum-type tiltmeters at the now abandoned volcano observatory about 3 km from the summit. These tiltmeters, capable of detecting changes in ground tilt of a few parts in 108, have indicated tilt changes of only fractions of a µrad from 25 September, when measurements were begun, to 29 September. Neither of these observations, however, has been made over times that would record the short periods of tilt reported by LANL during the hour preceding small eruptions.
[Magnetic variations measured on the volcano in September were positive at all but one station, and intense, reaching 6nT at the end of the month (Zlotnicki, 1986).]
Earlier reports of fresh volcanic glass in the ejected ash from La Soufrière are now regarded to have been in error. There is no confirmed evidence that juvenile magma has reached the surface.
Information Contacts: W. Aspinall and J. Tomblin, UWI; LANL; J. Gautheyrou, ORSTOM; R. Fiske, SI.
Eruption on 2 October deposits ash 7 km away; continued steam emission
2 October: At about 1630, a steam and ash eruption began, producing a cloud that reached a maximum of 1000-1500 m height. The cloud deposited a fine veneer of ash on vegetation as far as 7 km downwind. Maximum ejecta diameter on the summit dome was 1-2 cm. Mudflows accompanied the eruption. Harmonic tremor events of 10 and 13 minutes respectively saturated seismographs at 1615 and 1654.
3 October: Normal activity resumed (200-300-m sulfurous steam plumes).
4 October: Steam clouds, fluctuating in volume and ash content, were emitted from the dome fracture system. Activity was greatest near the S flank. Ash slurries, 4-5 m wide, flowed downslope from the dome fractures. Two ash samples and one mudflow sample were taken by LANL the next day.
5 October: Summit fumarolic activity was visible in the early morning and late afternoon. Little or no ash was present in the steam plumes.
6-7 October: Clouds and heavy rain precluded observations of the summit area.
8 October: Moderate steam plumes, sometimes containing small amounts of ash, were emitted during the morning. A significant increase in activity began at 1237, about 2.5 hours after unusual heavy rains on the summit area. The steam plumes reached 50 m height.
9 October: Continued moderate steam emission, with varying but minor amounts of ash in the plumes.
10 October: At 1111, a 13-minute period of harmonic tremor began, coincident with a pronounced increase in ash emission from the summit, which lasted for 20-30 minutes. Four mm of ash were deposited at the summit parking lot and at Marigot (5.5 km W of the summit), considerably more than was deposited from the larger ash clouds of 2 and 4 October.
11 October: A pronounced increase in seismic activity began at about 0500 and continued through about 1100. No simultaneous increase in eruptive activity was noted.
12 October: Eruptive activity was limited to weak steaming. Plumes rose only 10-12 m above the summit.
13-14 October: Steam emission returned to the "moderate" level of 8-9 October.
15 October: LANL scientists returned to Los Alamos leaving borehole tiltmeters in concrete building foundations for continued use by the French team.
21 October: 65 earthquakes were recorded.
22 October: Earthquake activity increased sharply. Between 1330 and 1610, 182 earthquakes larger than M 2.2 were recorded. Eruptive activity increased during the afternoon and evening.
23 October: A harmonic tremor event occurred at about 0530, saturating instruments for 1 minute. Steam and "smoke" emission had declined since the previous evening.
Continuing dry tilt measurements by French technicians have indicated no coherent pattern of deformation 1-16 October. It is probable that the small tilts observed can be attributed to the near-surface effects of variation in rainfall, sunlight, and evaporation at each of the 4 stations.
Analysis of unsieved material by LANL from the 30 September and 15 October eruptions detected mainly hydrothermally altered lithic and mineral fragments. No fresh glass was found (table 3).
Table 3. Modal analyses by LANL of unsieved 30 September and 15 October 1976 ejecta from Soufrière.
| Components (%) | 30 Sep 1976 | 15 Oct 1976 |
| Altered and unaltered plagioclase, ortho- and clinopyroxe | 18 | 16 |
| Altered and unaltered lithic fragments (mostly porphyritic, glassy dacite) | 18 | 20 |
| Altered colorless glass | 4 | 1 |
| Matrix; less than 2 µm altered glass and mineral phases, clay, and celadonite (?) | 55 | 60 |
Sulfur contents of tephra samples increased over the period mid-August to early September, according to LANL analyses (table 4).
Table 4. Sulfur content of several ash samples from August 1976 eruptions of Soufrière. Analyzed by D. Curtis, LANL, using the thermal neutron-prompt gamma activation method.
| Date | Wt.% sulfur of tephra samples |
| 12 Aug 1976 | 1.7 |
| 22 Aug 1976 | 2.3 (1.1, 3.4; two locations) |
| 26 Aug 1976 | 2.7 |
| 27 Aug 1976 | 3.6 (3.0, 4.1; two locations) |
| 30 Aug 1976 | 4.3 |
Information Contacts: LANL; J. Gautheyrou, ORSTOM; AFP.
Phreatic explosions and mild steaming; evacuation ends 1 December
30 October: A 9-minute phreatic explosion occurred at about 1000. At 2238 a period of volcanic tremor began.
1 November: Phreatic explosion at about 1100.
6 November: Phreatic explosion at about 2200. The periods between phreatic explosions were characterized by mild steaming from fissures on the summit dome.
On 15-18 November, CNRS convened a committee of scientists in Paris to review the Soufrière situation and to assess the hazard posed by the volcano. This committee was chaired by Frank Press of the U.S., and included the following members: Shigeo Aramaki, Japan; Franco Barberi, Italy; Jean Coulomb, France; Richard S. Fiske, U.S.; Paolo Gasparini, Italy; Claude Guillemin, France; and Gudmundur Sigvaldason, Iceland.
The committee concluded that as of mid-November there was low probability of a dangerous eruption at La Soufrière, but that the situation could change. In order to detect these changes, the committee recommended an augmented program of study that included increased geological and petrological observation of the volcano and its ejecta, expansion of the deformation studies (precise levelling and tiltmetry), monitoring of volcanic gases, and expansion and improvement of seismic monitoring procedures. The committee report also outlined a possible model explaining the volcano's behavior. The model calls for the tectonic fracturing of hot rock or partly solidified magma beneath the volcano. This fracturing permitted the rapid influx of groundwater, of both meteoric and marine origin, which was then heated and driven off in copious outpourings of steam from the summit of the volcano. At times, steam was expelled with such violence that particles of pre-existing, altered rock were torn from the interior of the volcano and ejected to form airborne clouds of ash.
Several hours after the release of the committee report on 18 November, the French Government announced that the evacuation on Guadeloupe would end, and that the last of the 72,000 evacuees could return to their homes on 1 December.
Information Contacts: M. Feuillard, Lab. de Physique du Globe; J. Dorel, IPG, Paris; R. Fiske, SI.
Mild steaming with an occasional weak phreatic explosion
Activity has declined to mild steaming with an occasional weak phreatic explosion.
Information Contacts: J. Gautheyrou, ORSTOM.
Summary of steam-and-ash explosions during October 1976-January 1977
Significant steam and ash explosions after 11 October occurred 30 October, 1, 6, and 7 November, and 5, 13, 14, 15, 17, 19, and 30 January [but see 2:2]. Two harmonic tremor events were recorded on 1 November and one on 6 November. No information on harmonic tremor is available after 7 November. [Both the number of earthquakes and seismic energy release declined after mid-November (table 5).]
Table 5. Number of earthquakes and total seismic energy release at Soufrière Guadeloupe, October 1976-May 1977. Courtesy of M. Feuillard.
| Dates | Number of Earthquakes | Total Seismic Energy (x 1013 ergs) |
| 01-10 Oct 1976 | 412 | 446 |
| 11-20 Oct 1976 | 895 | 532 |
| 21-31 Oct 1976 | 1008 | 929 |
| 01-10 Nov 1976 | 489 | 523 |
| 11-20 Nov 1976 | 235 | 402 |
| 21-30 Nov 1976 | 316 | 168 |
| 01-10 Dec 1976 | 204 | 225 |
| 11-20 Dec 1976 | 102 | 165 |
| 21-31 Dec 1976 | 93 | 41 |
| 01-10 Jan 1976 | 69 | 76 |
| 11-20 Jan 1976 | 126 | 71 |
| 21-31 Jan 1976 | 116 | 154 |
| 01-10 Feb 1976 | 76 | 152 |
| 11-20 Feb 1976 | 86 | 38 |
| 21-28 Feb 1976 | 17 | 32 |
| 01-10 Mar 1976 | 23 | 4 |
| 11-20 Mar 1976 | 65 | 54 |
| 21-31 Mar 1976 | 66 | 52 |
| 01-10 Apr 1976 | 12 | 2 |
| 11-20 Apr 1976 | 28 | 6.9 |
| 21-30 Apr 1976 | 6 | 1.1 |
| 01-10 May 1976 | 5 | 0.9 |
| 11-20 May 1976 | 9 | 1.7 |
Information Contacts: M. Feuillard, Lab. de Physique du Globe.
Phreatic activity continues; large explosion on 29 January
"Phreatic activity has continued at La Soufrière through 23 February. The largest explosion of the 1976-77 activity occurred at 1911 on 29 January 1977 and was heard by people living as far as 10 km from the summit. Lithic blocks as large as 0.5 m in diameter were thrown 1 km from the summit fissures. Five centimeters of ash was deposited at Savane à Mulets and 5 mm of ash fell on Matouba, 3 km W of the summit. Smaller phreatic explosions occurred on 13 and 15 February, and measurable amounts of ash were erupted on 5, 7, and 10-15 February. On 23 February only minor amounts of steam were being emitted from the volcano.
"In contrast to the eventful phreatic activity of recent weeks, the local seismicity has continued to decline. Only 6-10 earthquakes/day were detected 1-23 February and a felt event occurs only once in every 10 days.
"Petrographic study continues to confirm that ejecta from Soufrière consist only of older, altered material. No fresh glass has been observed. As before, ground deformation measurements with various types of tiltmeters (pendulum, borehole, dry tilt) have indicated no significant changes in the overall shape of the volcano."
Information Contacts: R. Fiske, SI.
Earthquake rate decreases to 1 per day
"Daily recorded earthquakes at Soufrière had decreased from a maximum of 1257 on 24 August 1976 to one per day by the first week in March 1977 (figure 5). Figure 6 shows the seismic energy released during 10-day periods. Total energy release from 1 November 1975 through February 1977 was ~1.9 x 10¹⁸ ergs. Figure 7 shows the number of earthquakes in various magnitude ranges. The largest magnitude was 4.2 (4.9 by NEIS determination) on 16 August 1976.
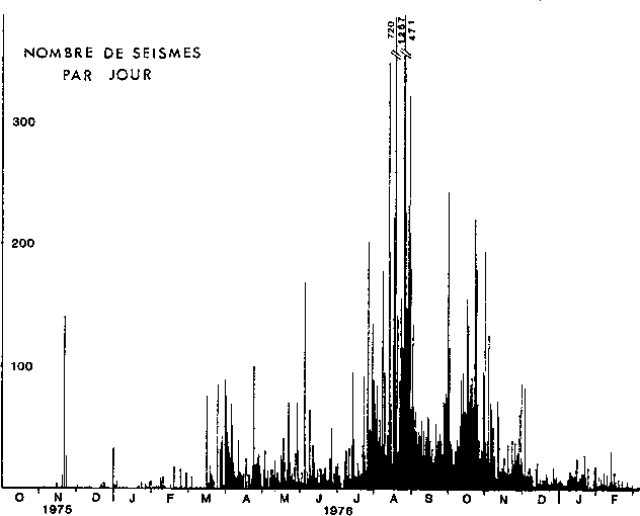 |
Figure 5. Daily recorded earthquakes at Soufrière Guadeloupe, October 1975-March 1977. Courtesy of J. Dorel. |
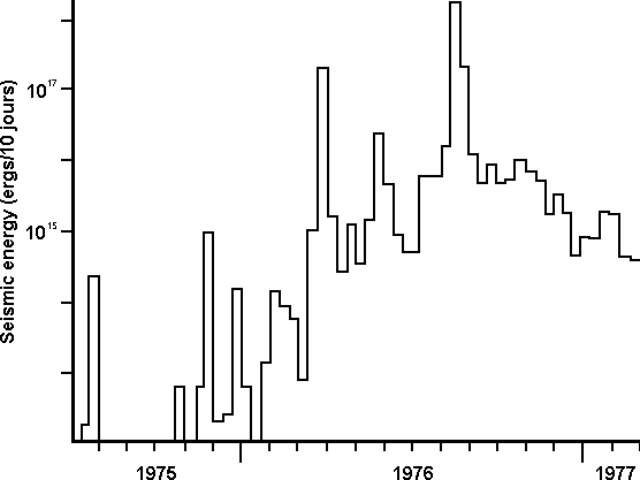 |
Figure 6. Seismic energy release in ergs for 10-day periods at Soufrière Guadeloupe, July 1975-February 1977. Courtesy of J. Dorel. |
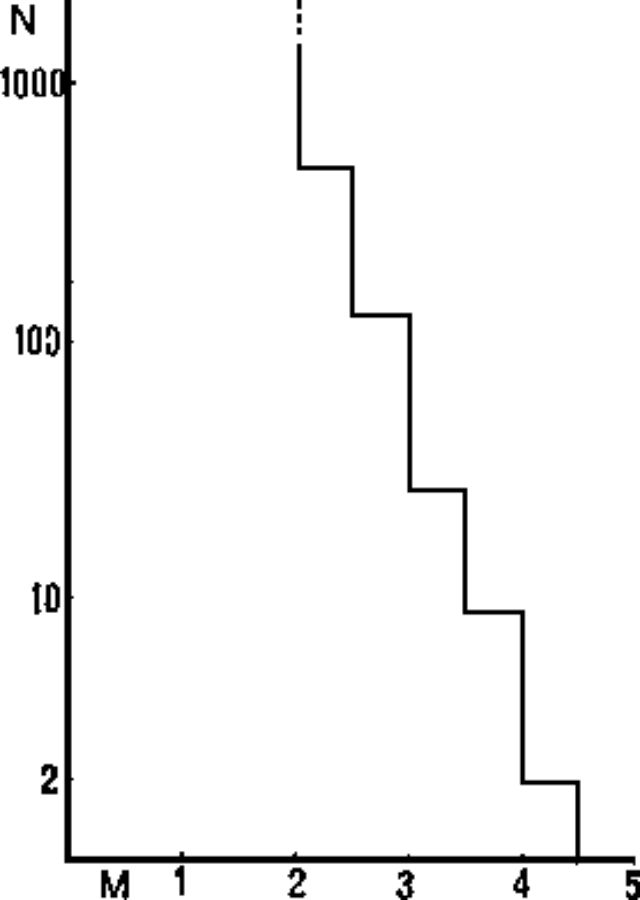 |
Figure 7. Number of recorded earthquakes at Soufrière Guadeloupe in magnitude increments of 0.5, late 1975-February 1977. Courtesy of J. Dorel. |
"Hypocenter determination has been made for about 350 events. Figure 8 shows NW-SE and NE-SW vertical sections (under the volcano) onto which the foci are projected. Different symbols are used for different time series, but the variation with time of the depths of quakes during the crisis is not meaningful. Mean depth is about 2.5 km.
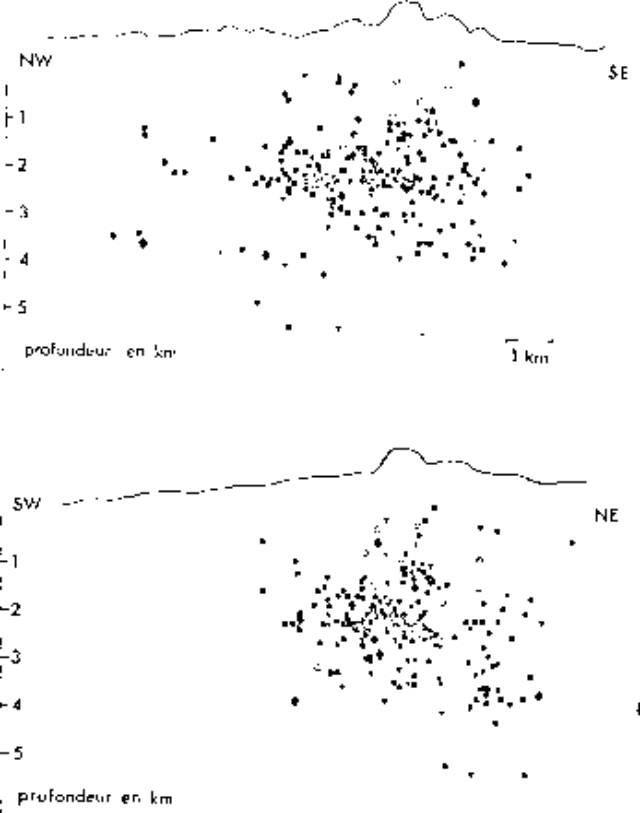 |
Figure 8. Cross-sections at Soufrière Guadeloupe running NW-SE (top) and NE-SW (bottom) showing earthquake hypocenters. Courtesy of J. Dorel. |
"Volcanic tremor, the duration of which varied from a few minutes to a few tens of minutes, has been recorded by the seismographs. The tremor events correspond to such important surface manifestations as steam, solid ejecta, and fracture opening. With its 16,000 earthquakes and a total energy release greater than 1018 ergs, the La Soufrière crisis is the most important in the Carribean region in the past 40 years."
Information Contacts: J. Dorel, Univ. Pierre et Marie Curie, Paris.
Decreased seismic and surface activity
Surface and seismic activity have declined considerably at Soufrière since the peak of the volcano-seismic crisis in August 1976 (table 5). The most recent phreatic explosion occurred on 1 March, after which solfataric activity continued into April from the uppermost craters but diminished on the flank and in the Col de l'Echelle, just SE of the summit dome. Ash was emitted for portions of 20 days 1 January-15 April.
Information Contacts: M. Feuillard, Lab. de Physique du Globe.
Fumarolic activity
Surface activity at La Soufrière remained entirely fumarolic, and was strongest from the fissures toward the top of the summit dome. [Seismicity continued an irregular decline (table 5).]
Information Contacts: M. Feuillard, Lab. de Physique du Globe.
Summary of seismicity since mid-1975
Table 6 summarizes seismicity at Soufrière from mid-1975 through May 1976.
Table 6. Total seismic energy release (x 1013 ergs) per 1/3-month period, July 1975-May 1977. Courtesy of M. Feuillard.
| Month | Days 01-10 | Days 11-20 | Days 21-end |
| Jul 1975 | 0 | 0 | 23 |
| Aug 1975 | 0 | 0 | 0 |
| Sep 1975 | 0 | 0 | 0 |
| Oct 1975 | 0 | 0 | 1 |
| Nov 1975 | 0 | 1 | 91 |
| Dec 1975 | 0 | 0 | 14 |
| Jan 1976 | 0 | 0 | 1 |
| Feb 1976 | 1 | 7 | 5 |
| Mar 1976 | 1 | 100 | 18000 |
| Apr 1976 | 175 | 26 | 125 |
| May 1976 | 35 | 150 | 4600 |
| Jun 1976 | 380 | 88 | 64 |
| Jul 1976 | 80 | 510 | 768 |
| Aug 1976 | 1544 | 33831 | 20010 |
| Sep 1976 | 1027 | 469 | 949 |
| Oct 1976 | 446 | 532 | 930 |
| Nov 1976 | 523 | 402 | 168 |
| Dec 1976 | 225 | 165 | 41 |
| Jan 1977 | 76 | 71 | 154 |
| Feb 1977 | 152 | 38 | 33 |
| Mar 1977 | 4 | 54 | 52 |
| Apr 1977 | 2 | 7 | 1 |
| May 1977 | 1 | 2 | 6 |
Further References. Feuillard, M., Allegre, C.J., Brandeis, G., Gaulon, R., and others, 1983, The 1975-1977 crisis of La Soufrière de Guadeloupe (F.W.I.): A still-born magmatic eruption: JVGR, v. 16, p. 317-334.
Information Contacts: M. Feuillard, Lab. de Physique du Globe.
Temperature, magnetic field stable
IPG geophysicists have installed three telemetering magnetometers and established a network of 20 additional non-telemetering magnetometer stations on the flanks of Soufrière. Although significant changes in the magnetic field were recorded over periods of a few [months] during the phreatic and seismic activity of 1976-77, no variations of more than 1.5 nT were detected between August 1980 and March 1981.
IPG geophysicists also drilled two boreholes, to 77 m depth in the summit dome, and to 97 m depth immediately beside the dome. The temperature measurement at the bottom of dome borehole decreased steadily, from 97.5°C in April 1978 to 87°C in December 1980. . . . No significant temperature variation was recorded in the borehole near the dome, which remained at about 19°C through 1980. The temperature of a fumarole (Lacroix) about 80 m below the summit dropped from about 160°C in July 1978 to just over 100° by January 1979 and has remained between 96° and 98°C in 1981.
Further Reference. Zlotnicki, J., 1986, Magnetic measurements on La Soufrière volcano, Guadeloupe (Lesser Antilles), 1976-1984: A re-examination of the volcanomagnetic effects observed during the volcanic crisis of 1976-1977: JVGR, v. 30, p. 83-116.
Information Contacts: J. Pozzi, J. Zlotnicki, G. Simon, J. Le Mouel and J. Cheminée, IPG, Paris.
Temperatures and chemistry of thermal springs
Since January 1979, samples have been collected 2-3 times per month from six springs with water temperatures of 25-69°C, 0.5-3.5 km from the summit dome. Water temperatures and chemistry remained nearly constant at five of the six springs, as shown by the following maximum variations recorded at any one spring in the nearly 3 years of sampling: temperature (°C) 4%, pH 5%, Cl 20%, HCO3 25%, F 25%. These variations were independent of rainfall and apparently random.
However, Carbet l'Echelle spring, the hottest and nearest to the summit (0.5 km) showed appreciable changes during the survey period. Its water temperature dropped from 69°C in January 1979 to 57° in November 1981, while the concentration of HCO3 ions approximately doubled and large variations in Cl concentrations occurred (figure 9).
Information Contacts: S. Bigot, Lab. de Géochemie, Paris; G. Hammouya, Lab. de Physique du Globe; J. Le Mouel and J. Cheminée, IPG, Paris.
Water temperatures and chemistry
A study of the geochemical evolution of Carbet l'Echelle spring, continued during 1981 and 1982 (figure 10). The water temperature decreased from 62.5°C in January 1981 to 50° in September 1982, while the concentration of HCO3 ions continued to increase (+ 30%). Moreover, although large variations in Cl concentration have been observed since 1979, the background level of Cl began to fall in September 1981 and was reduced by half in one year. Likewise, the concentration of F ions, which has oscillated around a constant value since the beginning of the survey, decreased slightly in late 1982. Water temperatures and chemistry remained nearly constant at the other springs monitored by this study.
Further References: Bigot, S., and Hammouya, G., 1987, Surveillance hydrogéochimique de la Soufrière de Guadeloupe, 1979-1985: Diminuition d'activité ou confinement?: C.R. Acad. Sci. Paris, t. 304, Série II, no. 13, p. 757-760.
Observations volcanologiques: Rapport d'Activité des Observatoires Volcanologiques des Antilles (Guadeloupe-Martinique) - November 1976-April 1977, April 1977-December 1978, 1979, 1980, 1981, 1982, and 1983-1984: Institut de Physique du Globe, Paris.
Information Contacts: S. Bigot, Lab. de Géochemie, Paris; G. Hammouya, Lab. de Physique du Globe; J. Le Mouel, J. Cheminée, IPG, Paris.
This compilation of synonyms and subsidiary features may not be comprehensive. Features are organized into four major categories: Cones, Craters, Domes, and Thermal Features. Synonyms of features appear indented below the primary name. In some cases additional feature type, elevation, or location details are provided.
Cones |
||||
| Feature Name | Feature Type | Elevation | Latitude | Longitude |
| Carmichaël | Stratovolcano | 1414 m | 16° 3' 0" N | 61° 40' 0" W |
| Citerne, La | Pyroclastic cone | 1115 m | 16° 2' 0" N | 61° 39' 0" W |
| Eschelle | Pyroclastic cone | 1397 m | 16° 3' 0" N | 61° 39' 0" W |
| Grande Découverte, La | Stratovolcano | 1263 m | 16° 4' 0" N | 61° 40' 0" W |
| Gros Fougas | Pyroclastic cone | 801 m | 16° 1' 0" N | 61° 39' 0" W |
| Lenglet, Morne | Pyroclastic cone | 722 m | 16° 1' 0" N | 61° 40' 0" W |
| Trois Rivières-Madeleine | Volcanic field | 801 m | 16° 1' 0" N | 61° 39' 0" W |
Craters |
||||
| Feature Name | Feature Type | Elevation | Latitude | Longitude |
| Amic | Crater | 1343 m | 16° 3' 0" N | 61° 40' 0" W |
| Gouffre Dupuis | Crater | 1450 m | 16° 3' 0" N | 61° 40' 0" W |
| Gouffre Tarissan | Crater | 1450 m | 16° 3' 0" N | 61° 40' 0" W |
| Napoleon, Cratere | Crater | 1400 m | 16° 3' 0" N | 61° 40' 0" W |
Domes |
||||
| Feature Name | Feature Type | Elevation | Latitude | Longitude |
| Amic, Morne | Dome | 1343 m | 16° 3' 0" N | 61° 40' 0" W |
| Dongo, Morne | Dome | 486 m | 16° 2' 0" N | 61° 37' 0" W |
| Madeleine | Dome | 972 m | 16° 1' 0" N | 61° 38' 0" W |
| Soufrière, La | Dome | 1467 m | 16° 3' 0" N | 61° 40' 0" W |
Thermal |
||||
| Feature Name | Feature Type | Elevation | Latitude | Longitude |
| Carbet, Fumerolles du | Fumarole | 1300 m | 16° 3' 0" N | 61° 39' 0" W |
| Chaudieres, Les | Thermal | 1264 m | 16° 3' 0" N | 61° 39' 0" W |
| Colardeau, Fumerolles | Fumarole | 1318 m | 16° 3' 0" N | 61° 40' 0" W |
| Fente du Nord, Fumerolle de la | Fumarole | 1350 m | 16° 3' 0" N | 61° 40' 0" W |
| Lacroix, Fumerolle | Fumarole | 1350 m | 16° 3' 0" N | 61° 40' 0" W |
| Mitan, Morne | Thermal | 1200 m | 16° 3' 0" N | 61° 39' 0" W |
|
|
||||||||||||||||||||||||||||
There is data available for 16 confirmed Holocene eruptive periods.
1976 Jul 8 - 1977 Mar 1 Confirmed Eruption VEI: 2
| Episode 1 | Eruption | SE side of summit (Gouffre Tarissan) | ||||||||||||||||||||||||||||||||||||||||||||||||||||||||||||||||
|---|---|---|---|---|---|---|---|---|---|---|---|---|---|---|---|---|---|---|---|---|---|---|---|---|---|---|---|---|---|---|---|---|---|---|---|---|---|---|---|---|---|---|---|---|---|---|---|---|---|---|---|---|---|---|---|---|---|---|---|---|---|---|---|---|---|
| 1976 Jul 8 - 1977 Mar 1 | Evidence from Observations: Reported | ||||||||||||||||||||||||||||||||||||||||||||||||||||||||||||||||
|
List of 11 Events for Episode 1 at SE side of summit (Gouffre Tarissan)
| |||||||||||||||||||||||||||||||||||||||||||||||||||||||||||||||||
1956 Oct 19 - 1956 Oct 27 Confirmed Eruption VEI: 1
| Episode 1 | Eruption | ESE side, Napoléon Crater | |||||||||||||||||||||||||||||||||||||||||||||||||||||||||||
|---|---|---|---|---|---|---|---|---|---|---|---|---|---|---|---|---|---|---|---|---|---|---|---|---|---|---|---|---|---|---|---|---|---|---|---|---|---|---|---|---|---|---|---|---|---|---|---|---|---|---|---|---|---|---|---|---|---|---|---|---|
| 1956 Oct 19 - 1956 Oct 27 | Evidence from Observations: Reported | |||||||||||||||||||||||||||||||||||||||||||||||||||||||||||
|
List of 10 Events for Episode 1 at ESE side, Napoléon Crater
| ||||||||||||||||||||||||||||||||||||||||||||||||||||||||||||
[ 1903 ] Uncertain Eruption
| Episode 1 | Eruption | SE side summit dome | |||||||||||||||||||
|---|---|---|---|---|---|---|---|---|---|---|---|---|---|---|---|---|---|---|---|---|
| 1903 - Unknown | Evidence from Unknown | |||||||||||||||||||
|
List of 2 Events for Episode 1 at SE side summit dome
| ||||||||||||||||||||
1836 Dec 3 - 1837 Feb 12 Confirmed Eruption VEI: 2
| Episode 1 | Eruption | SE to NW sides of summit dome | ||||||||||||||||||||||||||||||||||||||||||||
|---|---|---|---|---|---|---|---|---|---|---|---|---|---|---|---|---|---|---|---|---|---|---|---|---|---|---|---|---|---|---|---|---|---|---|---|---|---|---|---|---|---|---|---|---|---|
| 1836 Dec 3 - 1837 Feb 12 | Evidence from Observations: Reported | ||||||||||||||||||||||||||||||||||||||||||||
|
List of 7 Events for Episode 1 at SE to NW sides of summit dome
| |||||||||||||||||||||||||||||||||||||||||||||
1812 Apr - 1812 May 10 Confirmed Eruption VEI: 1
| Episode 1 | Eruption | E-W fissure on summit dome | ||||||||||||||||||||||||||||||||||
|---|---|---|---|---|---|---|---|---|---|---|---|---|---|---|---|---|---|---|---|---|---|---|---|---|---|---|---|---|---|---|---|---|---|---|---|
| 1812 Apr - 1812 May 10 | Evidence from Observations: Reported | ||||||||||||||||||||||||||||||||||
|
List of 5 Events for Episode 1 at E-W fissure on summit dome
| |||||||||||||||||||||||||||||||||||
1797 Sep 29 - 1798 Apr 26 (?) Confirmed Eruption VEI: 2
| Episode 1 | Eruption | NNW side of summit dome | |||||||||||||||||||||||||||||||||||||||||||||||||
|---|---|---|---|---|---|---|---|---|---|---|---|---|---|---|---|---|---|---|---|---|---|---|---|---|---|---|---|---|---|---|---|---|---|---|---|---|---|---|---|---|---|---|---|---|---|---|---|---|---|---|
| 1797 Sep 29 - 1798 Apr 26 (?) | Evidence from Observations: Reported | |||||||||||||||||||||||||||||||||||||||||||||||||
|
List of 8 Events for Episode 1 at NNW side of summit dome
| ||||||||||||||||||||||||||||||||||||||||||||||||||
[ 1696 Apr ] Uncertain Eruption
| Episode 1 | Eruption | North side of summit dome | ||||||||||||||||||||||||
|---|---|---|---|---|---|---|---|---|---|---|---|---|---|---|---|---|---|---|---|---|---|---|---|---|---|
| 1696 Apr - Unknown | Evidence from Observations: Reported | ||||||||||||||||||||||||
|
List of 3 Events for Episode 1 at North side of summit dome
| |||||||||||||||||||||||||
1690 Apr 5 (in or after) Confirmed Eruption VEI: 1
| Episode 1 | Eruption | Gouffre Dupuy, Gouffre Tarissan | ||||||||||||||||||||||||||||||||||
|---|---|---|---|---|---|---|---|---|---|---|---|---|---|---|---|---|---|---|---|---|---|---|---|---|---|---|---|---|---|---|---|---|---|---|---|
| 1690 Apr 5 (in or after) - Unknown | Evidence from Observations: Reported | ||||||||||||||||||||||||||||||||||
|
List of 5 Events for Episode 1 at Gouffre Dupuy, Gouffre Tarissan
| |||||||||||||||||||||||||||||||||||
1530 ± 30 years Confirmed Eruption VEI: 4
| Episode 1 | Eruption | La Soufrière | |||||||||||||||||||||||||||||||||||||||||||||||||
|---|---|---|---|---|---|---|---|---|---|---|---|---|---|---|---|---|---|---|---|---|---|---|---|---|---|---|---|---|---|---|---|---|---|---|---|---|---|---|---|---|---|---|---|---|---|---|---|---|---|---|
| 1530 ± 30 years - Unknown | Evidence from Isotopic: 14C (calibrated) | |||||||||||||||||||||||||||||||||||||||||||||||||
|
List of 8 Events for Episode 1 at La Soufrière
| ||||||||||||||||||||||||||||||||||||||||||||||||||
0370 ± 75 years Confirmed Eruption
| Episode 1 | Eruption | La Citerne and L'Eschelle cones | ||||||||||||||||||||||||||||||||||
|---|---|---|---|---|---|---|---|---|---|---|---|---|---|---|---|---|---|---|---|---|---|---|---|---|---|---|---|---|---|---|---|---|---|---|---|
| 0370 ± 75 years - Unknown | Evidence from Isotopic: 14C (calibrated) | ||||||||||||||||||||||||||||||||||
|
List of 5 Events for Episode 1 at La Citerne and L'Eschelle cones
| |||||||||||||||||||||||||||||||||||
0580 BCE (after) Confirmed Eruption VEI: 2
| Episode 1 | Eruption | South flank (Morne Lenglet) | |||||||||||||||||||||||||||||||||||||||
|---|---|---|---|---|---|---|---|---|---|---|---|---|---|---|---|---|---|---|---|---|---|---|---|---|---|---|---|---|---|---|---|---|---|---|---|---|---|---|---|---|
| 0580 BCE (after) - Unknown | Evidence from Isotopic: 14C (uncalibrated) | |||||||||||||||||||||||||||||||||||||||
|
List of 6 Events for Episode 1 at South flank (Morne Lenglet)
| ||||||||||||||||||||||||||||||||||||||||
0820 BCE ± 100 years Confirmed Eruption VEI: 3 (?)
| Episode 1 | Eruption | Morne Amic ? | |||||||||||||||||||||||||||||||||||||||||||||||||
|---|---|---|---|---|---|---|---|---|---|---|---|---|---|---|---|---|---|---|---|---|---|---|---|---|---|---|---|---|---|---|---|---|---|---|---|---|---|---|---|---|---|---|---|---|---|---|---|---|---|---|
| 0820 BCE ± 100 years - Unknown | Evidence from Isotopic: 14C (calibrated) | |||||||||||||||||||||||||||||||||||||||||||||||||
|
List of 8 Events for Episode 1 at Morne Amic ?
| ||||||||||||||||||||||||||||||||||||||||||||||||||
0980 BCE ± 200 years Confirmed Eruption
| Episode 1 | Eruption | ||||||||||||||||||||||||||||||||||||||||
|---|---|---|---|---|---|---|---|---|---|---|---|---|---|---|---|---|---|---|---|---|---|---|---|---|---|---|---|---|---|---|---|---|---|---|---|---|---|---|---|---|
| 0980 BCE ± 200 years - Unknown | Evidence from Isotopic: 14C (calibrated) | |||||||||||||||||||||||||||||||||||||||
|
List of 6 Events for Episode 1
| ||||||||||||||||||||||||||||||||||||||||
1310 BCE ± 150 years Confirmed Eruption VEI: 3 (?)
| Episode 1 | Eruption | Morne Amic | ||||||||||||||||||||||||||||||||||||||||||||||||||||||
|---|---|---|---|---|---|---|---|---|---|---|---|---|---|---|---|---|---|---|---|---|---|---|---|---|---|---|---|---|---|---|---|---|---|---|---|---|---|---|---|---|---|---|---|---|---|---|---|---|---|---|---|---|---|---|---|
| 1310 BCE ± 150 years - Unknown | Evidence from Isotopic: 14C (calibrated) | ||||||||||||||||||||||||||||||||||||||||||||||||||||||
|
List of 9 Events for Episode 1 at Morne Amic
| |||||||||||||||||||||||||||||||||||||||||||||||||||||||
1810 BCE ± 150 years Confirmed Eruption
| Episode 1 | Eruption | |||||||||||||||||||||||||||||||||||||||||||||||||||||||
|---|---|---|---|---|---|---|---|---|---|---|---|---|---|---|---|---|---|---|---|---|---|---|---|---|---|---|---|---|---|---|---|---|---|---|---|---|---|---|---|---|---|---|---|---|---|---|---|---|---|---|---|---|---|---|---|
| 1810 BCE ± 150 years - Unknown | Evidence from Isotopic: 14C (calibrated) | ||||||||||||||||||||||||||||||||||||||||||||||||||||||
|
List of 9 Events for Episode 1
| |||||||||||||||||||||||||||||||||||||||||||||||||||||||
[ 2050 BCE (?) ] Uncertain Eruption
| Episode 1 | Eruption | |||||||||||||||
|---|---|---|---|---|---|---|---|---|---|---|---|---|---|---|---|
| 2050 BCE (?) - Unknown | Evidence from Unknown | ||||||||||||||
|
List of 1 Events for Episode 1
| |||||||||||||||
3310 BCE ± 150 years Confirmed Eruption
| Episode 1 | Eruption | South flank (Gros Fougas) | ||||||||||||||||||||||||||||||||||||||||||||
|---|---|---|---|---|---|---|---|---|---|---|---|---|---|---|---|---|---|---|---|---|---|---|---|---|---|---|---|---|---|---|---|---|---|---|---|---|---|---|---|---|---|---|---|---|---|
| 3310 BCE ± 150 years - Unknown | Evidence from Isotopic: 14C (calibrated) | ||||||||||||||||||||||||||||||||||||||||||||
|
List of 7 Events for Episode 1 at South flank (Gros Fougas)
| |||||||||||||||||||||||||||||||||||||||||||||
6450 BCE ± 150 years Confirmed Eruption
| Episode 1 | Eruption | |||||||||||||||||||||||||||||||||||
|---|---|---|---|---|---|---|---|---|---|---|---|---|---|---|---|---|---|---|---|---|---|---|---|---|---|---|---|---|---|---|---|---|---|---|---|
| 6450 BCE ± 150 years - Unknown | Evidence from Isotopic: 14C (calibrated) | ||||||||||||||||||||||||||||||||||
|
List of 5 Events for Episode 1
| |||||||||||||||||||||||||||||||||||
7490 BCE ± 150 years Confirmed Eruption
| Episode 1 | Eruption | |||||||||||||||||||||||||||||||||||
|---|---|---|---|---|---|---|---|---|---|---|---|---|---|---|---|---|---|---|---|---|---|---|---|---|---|---|---|---|---|---|---|---|---|---|---|
| 7490 BCE ± 150 years - Unknown | Evidence from Isotopic: 14C (calibrated) | ||||||||||||||||||||||||||||||||||
|
List of 5 Events for Episode 1
| |||||||||||||||||||||||||||||||||||
There is no Deformation History data available for Soufrière Guadeloupe.
There is no Emissions History data available for Soufrière Guadeloupe.
 An ash plume rises above the summit of Soufrière volcano on Guadeloupe Island in October 1976 with the deserted streets of Basse-Terre, the island's capital city, in the foreground. The 72,000 inhabitants of Basse-Terre had been evacuated since August because of concern of larger eruptions. In November the evacuation was ended.
  Steam pours from a fissure cutting the summit of La Soufrière in September 1976. Intermittent phreatic eruptions had begun in July and continued until March of the following year. This view from the north shows the Les Santes islands at the right and the tip of Dominica Island in the distance.
  An ash column rises above a fissure on the upper NW flank of La Soufrière de la Guadeloupe volcano in October 1976, with the capital city of Basse-Terre in the background. Intermmitent mild-to-moderate phreatic explosions took place from July 8, 1976, to March 1, 1977. Concern about the possibility of a larger eruption prompted the evacuation of the capital city of Basse-Terre from August to November 1976.
 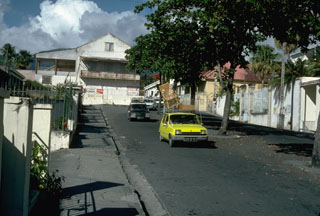 Vehicles laden with possessions are driven down the streets of Basse-Terre in September 1976, during the evacuation of the island's capital city. About 72,000 people living on the slopes of the volcano were evacuated until November 1976, producing significant economic disruption.
 A steam-and-ash plume from the summit of La Soufrière volcano rises above the deserted streets of Basse-Terre in October 1976. Intense controversy surrounded the evacuation of 72,000 people living on the flanks of the volcano. The evacuation, which had resulted in major economic and social disruption, was officially ended in November. This eruption ended without catastrophe, unlike another West Indies eruption two decades later, when the evacuated capital city of Montserrat was devastated by pyroclastic flows.
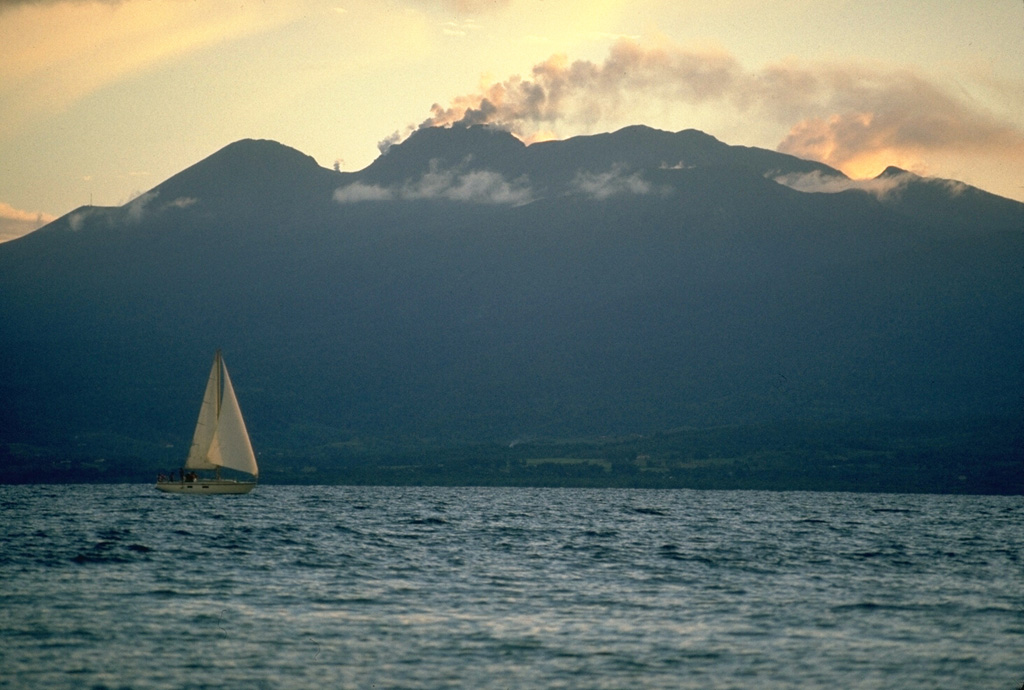
 La Soufrière volcano, the highest in the West Indies, is a complex stratovolcano that dominates the southern end of Basse-Terre, the western half of the butterfly-shaped island of Guadeloupe. A steam-and-ash column rises above the summit in this October 1976 view from the NE at Pointe-a-Pitre, on the isthmus connecting the island segments. The peak at the left (above the sailboat), l'Echelle, is a young cinder cone; the summit itself is a 500-year-old lava dome, and remnants of older collapsed volcanoes are located to its right.
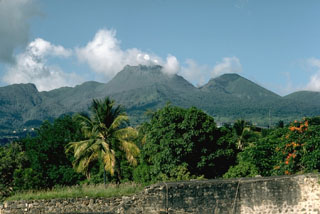 Steam rises from a 500-year-old lava dome that forms the summit of La Soufrière volcano on Guadeloupe. It was constructed within the 1-km-wide, horseshoe-shaped Amic Crater, whose northern rim is the flat-topped ridge at the extreme left. Amic Crater was the source of a major explosion and debris avalanche about 3100 years ago during an eruption that resembled the 1980 Mount St. Helens eruption. The peak to its right is l'Echelle, a young cinder cone. This September 1976 view is from the west.
 The summit dome of La Soufrière is seen in the center of this October 1976 aerial view from the SW. The peak at the right is l'Echelle, a scoria cone that is thought to have formed about 1500-2000 years ago. Historical eruptions from the volcano have originated from fissures cutting across the summit dome and its upper flanks.
 Scientists unload equipment in October 1976 to measure deformation of the volcanic edifice at Savane à Mulets, on the south side of the summit lava dome. This was one of several tools used to monitor the volcano during the 1976-77 eruption.
  La Soufrière, the summit lava dome of La Soufrière de la Guadeloupe volcano, was formed at the end of a major magmatic eruption about 500 years ago. This 1981 photo shows the craggy andesitic lava dome from Savane à Mulets, SW of the summit.
 The steep-sided, flat-topped summit lava dome of Soufrière de la Guadeloupe volcano is seen here in a 1981 aerial view from the SW. The dome was emplaced at the end of a powerful explosive eruption about 500 years ago. Most historical eruptions have originated from fissures cutting the summit and flanks of the dome. The 1976-77 eruptions originated from a fissure cutting across the summit from the NW to the SE (right) flank.
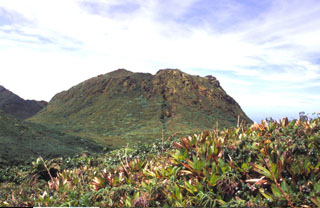 La Soufrière lava dome, forming the summit of Soufrière Guadeloupe volcano, was emplaced at the end of a major eruption that took place around the mid-15th century. The eruption began with collapse of part of a previous lava dome forming a debris avalanche, followed by a major explosive eruption in which dacitic pumice and andesitic banded scoria were sequentially ejected. The eruption concluded with growth of La Soufrière summit lava dome, which is seen here from the north.
Maps are not currently available due to technical issues.
The following 2 samples associated with this volcano can be found in the Smithsonian's NMNH Department of Mineral Sciences collections, and may be availble for research (contact the Rock and Ore Collections Manager). Catalog number links will open a window with more information.
| Catalog Number | Sample Description | Lava Source | Collection Date |
|---|---|---|---|
| NMNH 116271-17 | Andesite | -- | -- |
| NMNH 117580 | Aluminum (?) | -- | -- |
| Copernicus Browser | The Copernicus Browser replaced the Sentinel Hub Playground browser in 2023, to provide access to Earth observation archives from the Copernicus Data Space Ecosystem, the main distribution platform for data from the EU Copernicus missions. |
| MIROVA | Middle InfraRed Observation of Volcanic Activity (MIROVA) is a near real time volcanic hot-spot detection system based on the analysis of MODIS (Moderate Resolution Imaging Spectroradiometer) data. In particular, MIROVA uses the Middle InfraRed Radiation (MIR), measured over target volcanoes, in order to detect, locate and measure the heat radiation sourced from volcanic activity. |
| MODVOLC Thermal Alerts | Using infrared satellite Moderate Resolution Imaging Spectroradiometer (MODIS) data, scientists at the Hawai'i Institute of Geophysics and Planetology, University of Hawai'i, developed an automated system called MODVOLC to map thermal hot-spots in near real time. For each MODIS image, the algorithm automatically scans each 1 km pixel within it to check for high-temperature hot-spots. When one is found the date, time, location, and intensity are recorded. MODIS looks at every square km of the Earth every 48 hours, once during the day and once during the night, and the presence of two MODIS sensors in space allows at least four hot-spot observations every two days. Each day updated global maps are compiled to display the locations of all hot spots detected in the previous 24 hours. There is a drop-down list with volcano names which allow users to 'zoom-in' and examine the distribution of hot-spots at a variety of spatial scales. |
|
WOVOdat
Single Volcano View Temporal Evolution of Unrest Side by Side Volcanoes |
WOVOdat is a database of volcanic unrest; instrumentally and visually recorded changes in seismicity, ground deformation, gas emission, and other parameters from their normal baselines. It is sponsored by the World Organization of Volcano Observatories (WOVO) and presently hosted at the Earth Observatory of Singapore.
GVMID Data on Volcano Monitoring Infrastructure The Global Volcano Monitoring Infrastructure Database GVMID, is aimed at documenting and improving capabilities of volcano monitoring from the ground and space. GVMID should provide a snapshot and baseline view of the techniques and instrumentation that are in place at various volcanoes, which can be use by volcano observatories as reference to setup new monitoring system or improving networks at a specific volcano. These data will allow identification of what monitoring gaps exist, which can be then targeted by remote sensing infrastructure and future instrument deployments. |
| Volcanic Hazard Maps | The IAVCEI Commission on Volcanic Hazards and Risk has a Volcanic Hazard Maps database designed to serve as a resource for hazard mappers (or other interested parties) to explore how common issues in hazard map development have been addressed at different volcanoes, in different countries, for different hazards, and for different intended audiences. In addition to the comprehensive, searchable Volcanic Hazard Maps Database, this website contains information about diversity of volcanic hazard maps, illustrated using examples from the database. This site is for educational purposes related to volcanic hazard maps. Hazard maps found on this website should not be used for emergency purposes. For the most recent, official hazard map for a particular volcano, please seek out the proper institutional authorities on the matter. |
| IRIS seismic stations/networks | Incorporated Research Institutions for Seismology (IRIS) Data Services map showing the location of seismic stations from all available networks (permanent or temporary) within a radius of 0.18° (about 20 km at mid-latitudes) from the given location of Soufrière Guadeloupe. Users can customize a variety of filters and options in the left panel. Note that if there are no stations are known the map will default to show the entire world with a "No data matched request" error notice. |
| UNAVCO GPS/GNSS stations | Geodetic Data Services map from UNAVCO showing the location of GPS/GNSS stations from all available networks (permanent or temporary) within a radius of 20 km from the given location of Soufrière Guadeloupe. Users can customize the data search based on station or network names, location, and time window. Requires Adobe Flash Player. |
| DECADE Data | The DECADE portal, still in the developmental stage, serves as an example of the proposed interoperability between The Smithsonian Institution's Global Volcanism Program, the Mapping Gas Emissions (MaGa) Database, and the EarthChem Geochemical Portal. The Deep Earth Carbon Degassing (DECADE) initiative seeks to use new and established technologies to determine accurate global fluxes of volcanic CO2 to the atmosphere, but installing CO2 monitoring networks on 20 of the world's 150 most actively degassing volcanoes. The group uses related laboratory-based studies (direct gas sampling and analysis, melt inclusions) to provide new data for direct degassing of deep earth carbon to the atmosphere. |
| Large Eruptions of Soufrière Guadeloupe | Information about large Quaternary eruptions (VEI >= 4) is cataloged in the Large Magnitude Explosive Volcanic Eruptions (LaMEVE) database of the Volcano Global Risk Identification and Analysis Project (VOGRIPA). |
| EarthChem | EarthChem develops and maintains databases, software, and services that support the preservation, discovery, access and analysis of geochemical data, and facilitate their integration with the broad array of other available earth science parameters. EarthChem is operated by a joint team of disciplinary scientists, data scientists, data managers and information technology developers who are part of the NSF-funded data facility Integrated Earth Data Applications (IEDA). IEDA is a collaborative effort of EarthChem and the Marine Geoscience Data System (MGDS). |